Sample Category Title
EUR/GBP Technical: Bullish Impulsive Upleg Intact (EUR Outperformance over GBP) as BoE Looms
Today, the Bank of England (BoE) is set to cut its short-term policy interest rate by 25 basis points to 4%, its lowest level in over two years, based on consensus expectations.
It will be the BoE’s second rate cut this year, as several of its Monetary Policy Committee members were cautious over a sticky inflationary trend that overshadowed growth concerns.
The latest core inflation rate in the UK jumped to 3.7% y/y in June, surpassing May’s print of 3.5%, and market expectations of 3.5%. Since the current inflation print is close to double the central bank's 2% target, the MPC is expected to leave in place guidance steering markets toward more “gradual and careful” interest-rate cuts and a meeting-by-meeting approach.
Let’s now focus on a short-term technical trading set-up on the EUR/GBP cross ahead of the BoE’s monetary policy decision today.
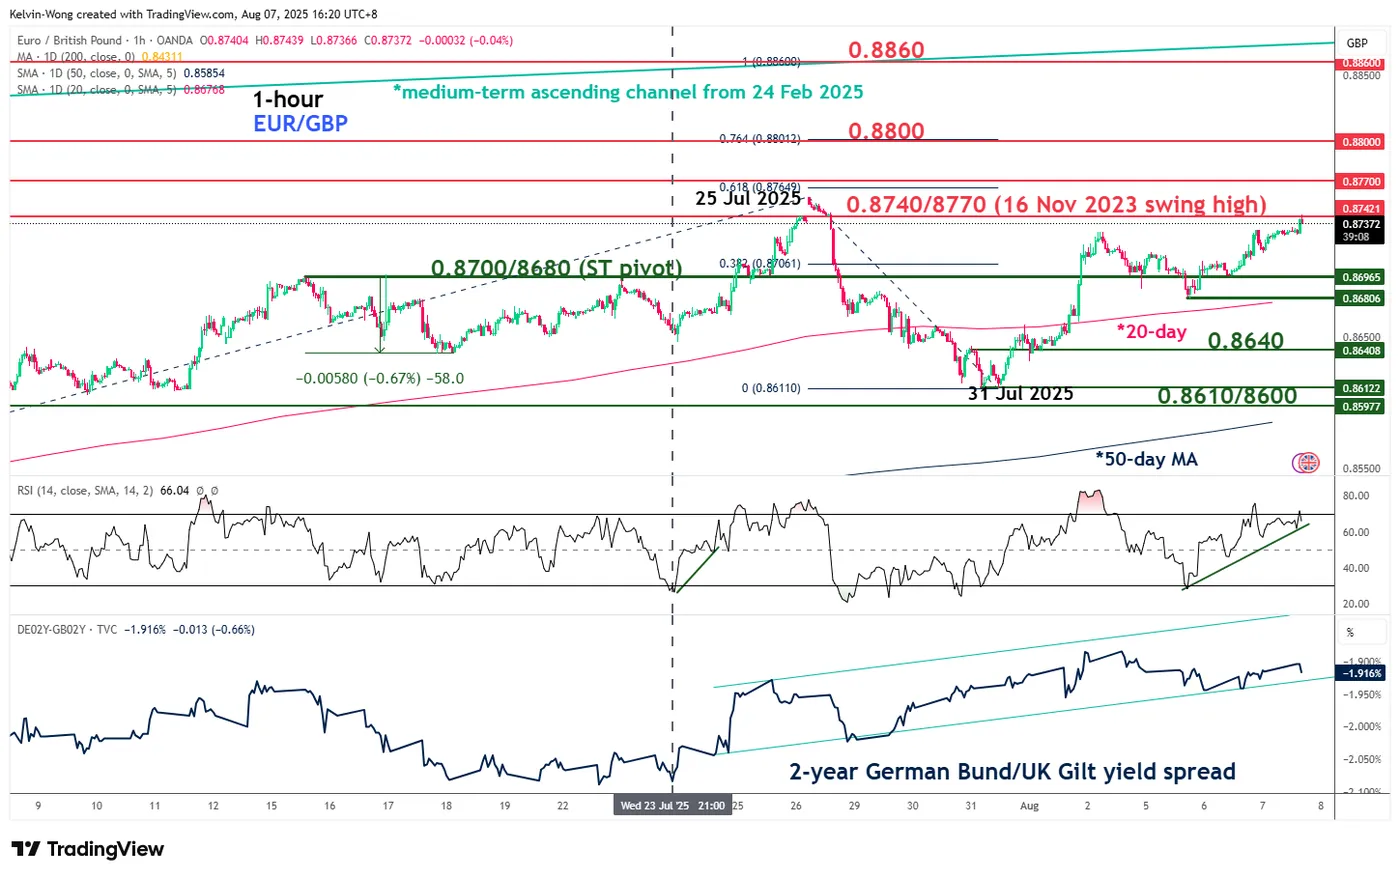
Fig. 1: EUR/GBP minor trend as of 7 Aug 2025 (Source: TradingView)
Preferred trend bias (1-3 days)
The recent minor corrective decline of 145 pips seen in the EUR/GBP from the 25 July high to the 31 July low is likely to have ended.
A potential bullish impulsive up move sequence is unfolding that supports EUR outperformance over GBP within its medium-term uptrend phase.
Bullish bias with 0.8700/8680 as the key short-term pivotal support for the next intermediate resistances to come in at 0.8740/8770, 0.8800, and 0.8860 (Fibonacci extension and upper boundary of the medium-term ascending channel from 24 February 2025) (see Fig. 1).
Key elements
- The price actions of the EUR/GBP have reintegrated back above its upward sloping 20-day and 50-day moving averages, which suggests the medium-term uptrend phase remains intact.
- Its hourly RSI momentum indicator has continued to exhibit a bullish momentum condition that advocates short-term EUR outperformance over GBP.
- The discount yield spread between the 2-year German Bund and 2-year UK Gilt has narrowed from -2.08% to -1.92% which suggests that short-term sovereign bonds in the UK are getting “less attractive” to own than Germany’s short-term sovereign bonds. A positive driver of further potential upside in EUR/GBP.
Alternative trend bias (1 to 3 days)
A break below 0.8680 negates the bullish tone, where the EUR/GBP may see a minor slide to retest the next intermediate supports of 0.8640 and 0.8610/8600 (31 July 2025 minor swing low and 50-day moving average).
EUR/USD Rises 2.3% Since the Beginning of August
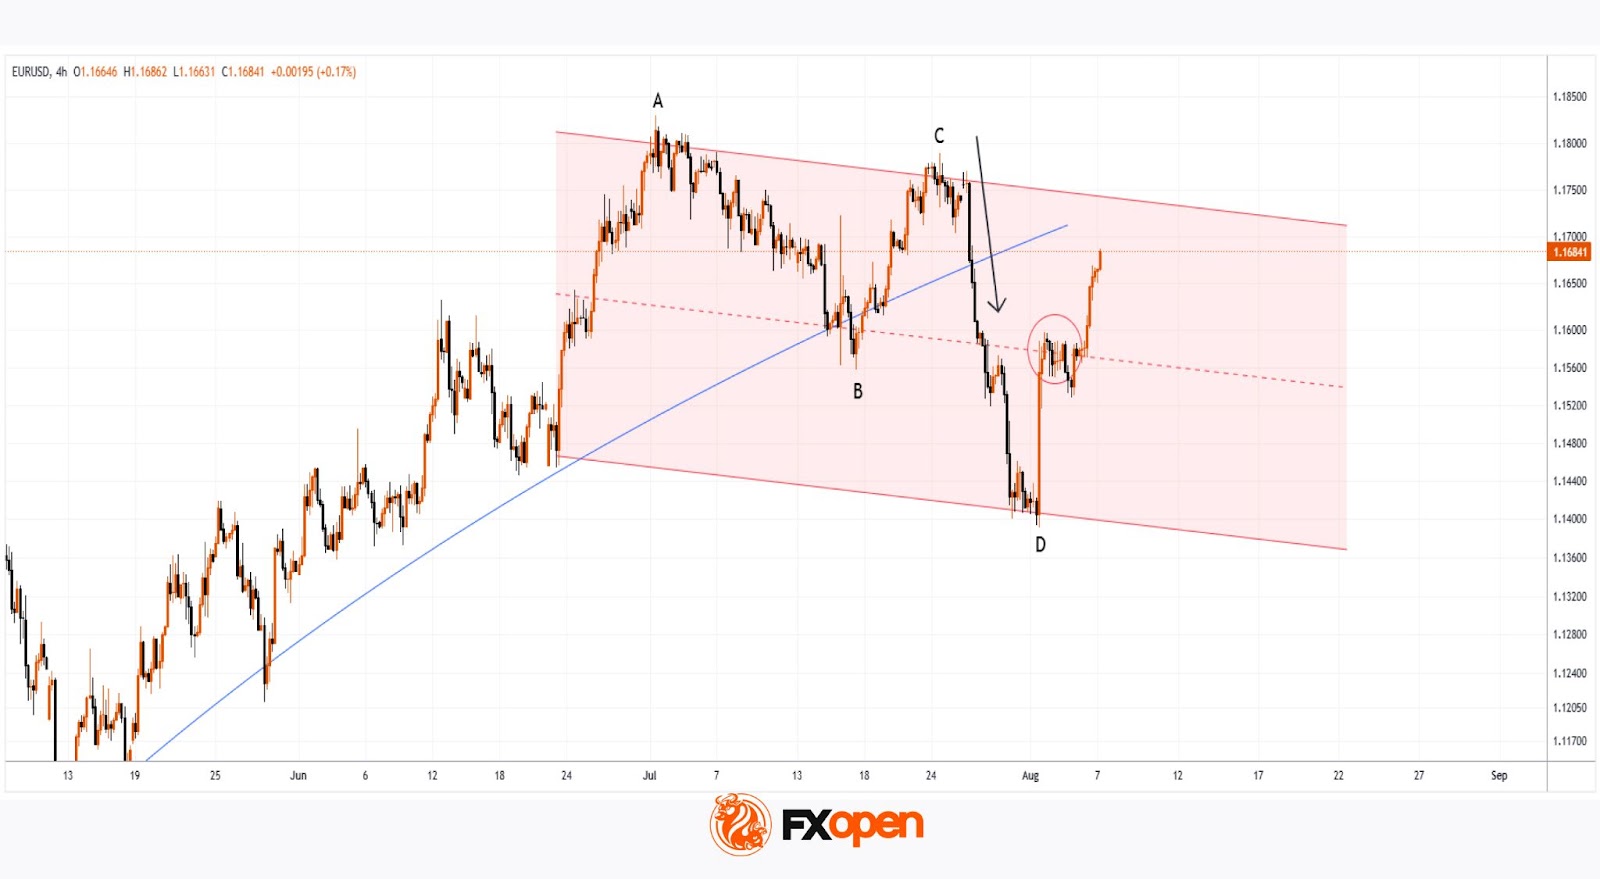
As the EUR/USD chart shows today, the euro has strengthened against the US dollar, climbing above the 1.1670 level, compared to the 1.1400 area at the beginning of the month.
Why Is EUR/USD Rising?
According to Reuters, the US dollar's weakness is being driven by:
→ Expectations of a Federal Reserve rate cut, which intensified following last week's disappointing US labour market data.
→ Anticipation of the upcoming US inflation report, scheduled for release on 12 August at 15:30 GMT+3.
On the other hand, the euro is being supported by growing optimism around a possible resolution of the military conflict in Ukraine, as well as the potential meeting between Donald Trump and Vladimir Putin.
Technical Analysis of the EUR/USD Chart
On 30 July, we noted that after hitting its July low, EUR/USD could stage a recovery — which indeed materialised. But does the chart now look bullish?
A definitive bullish outlook is hindered by the sequence of lower highs and lower lows (A-B-C-D), which continues to form a bearish market structure.
At the same time, the descending channel on the EUR/USD chart has become more pronounced. After a brief period of consolidation near the channel’s median line (marked with a circle), the price moved up towards the upper boundary of the channel. It is worth noting that a sharp decline occurred recently from these same levels (highlighted with an arrow), breaking through the blue support line.
Given these factors, it is reasonable to assume that bearish activity may intensify around current levels, potentially slowing further EUR/USD growth.
Trade over 50 forex markets 24 hours a day with FXOpen. Take advantage of low commissions, deep liquidity, and spreads from 0.0 pips. Open your FXOpen account now or learn more about trading forex with FXOpen.
This article represents the opinion of the Companies operating under the FXOpen brand only. It is not to be construed as an offer, solicitation, or recommendation with respect to products and services provided by the Companies operating under the FXOpen brand, nor is it to be considered financial advice.
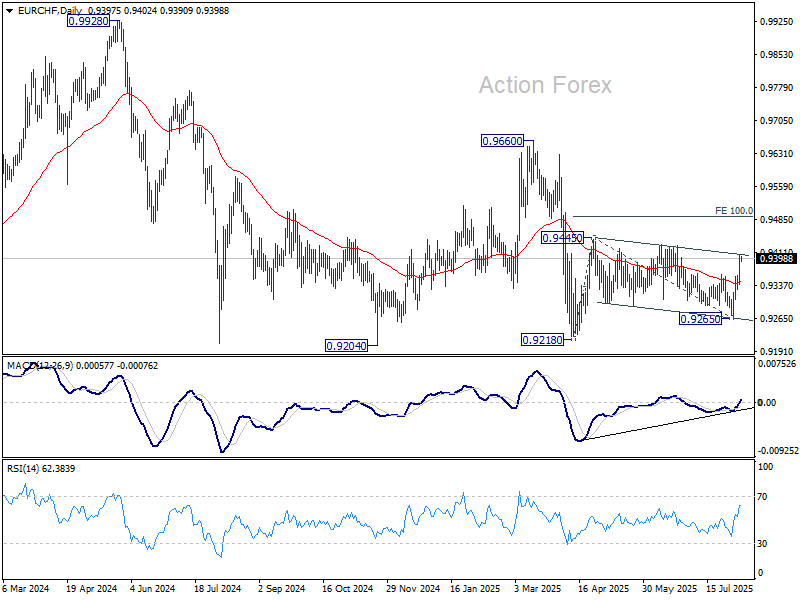
EUR/CHF Daily Outlook
Daily Pivots: (S1) 0.9352; (P) 0.9380; (R1) 0.9430; More....
Intraday bias in EUR/CHF stays on the upside for 0.9428 resistance. Firm break there should confirm that corrective pattern from 0.9445 has completed. Rise from 0.9128 should then be ready to resume to 100% projection of 0.9218 to 0.9445 from 0.9265 at 0.9492. ON the downside, below 0.9359 minor support will turn intraday bias neutral again first.
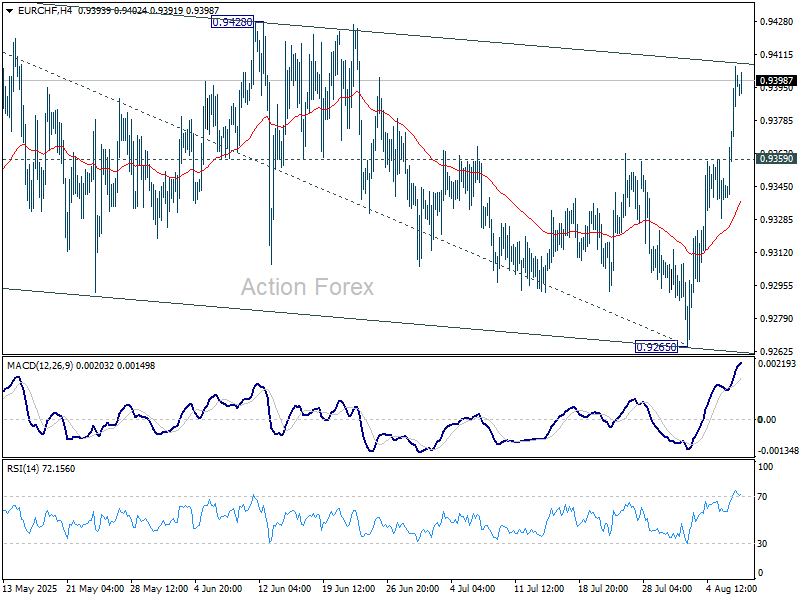
In the bigger picture, the down trend from 0.9204 (2018 high) might still be in progress considering that EUR/CHF is staying well inside the long term falling channel. However, with bullish convergence condition in W MACD, downside position should be limited in case of another fall. Instead, firm break of 0.9660 resistance will be an important sign of medium term bullish trend reversal.
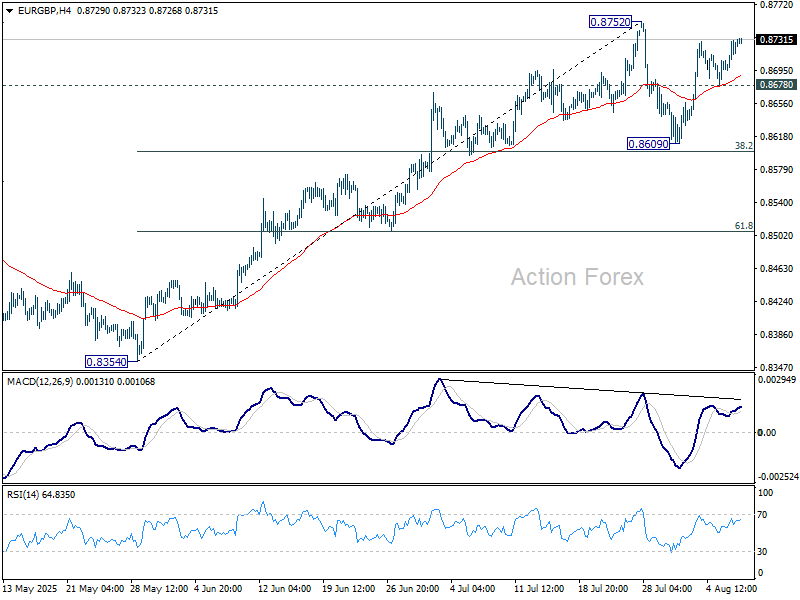
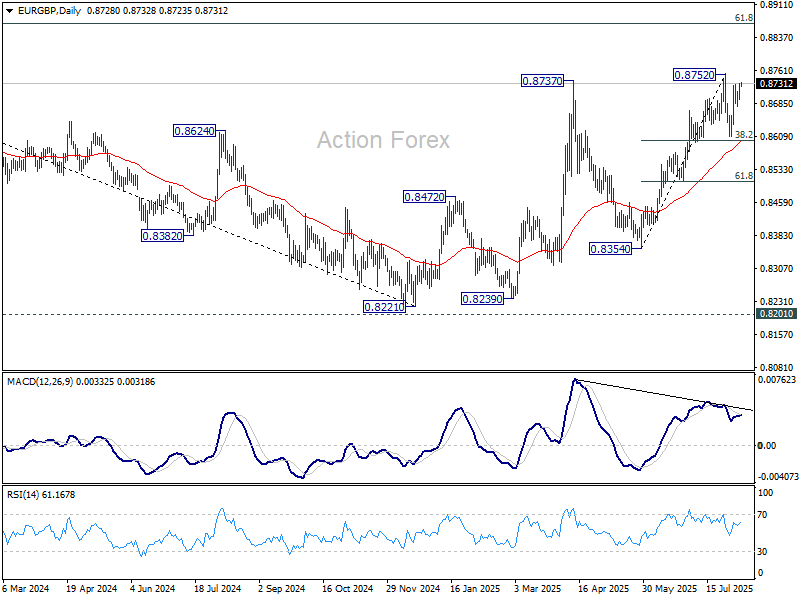
EUR/GBP Daily Outlook
Daily Pivots: (S1) 0.8707; (P) 0.8720; (R1) 0.8742; More...
Range trading continues in EUR/GBP and intraday bias remains neutral On the upside, firm break of 0.8752 will resume the rise from 0.8354 towards 0.8867 fibonacci level. On the downside, below 0.8678 will extend the corrective pattern from 0.8752 with another falling leg. But downside should be contained by 38.2% retracement of 0.8354 to 0.8752 at 0.8600.
In the bigger picture, the structure from 0.8221 medium term bottom are not impulsive enough to suggest that it's reversing the down trend from 0.9267 (2022 high). But even if it's a correction, further rise is expected to 61.8% retracement of 0.9267 to 0.8221 at 0.8867. This will remain the favored case as long as 55 W EMA (now at 0.8493) holds.
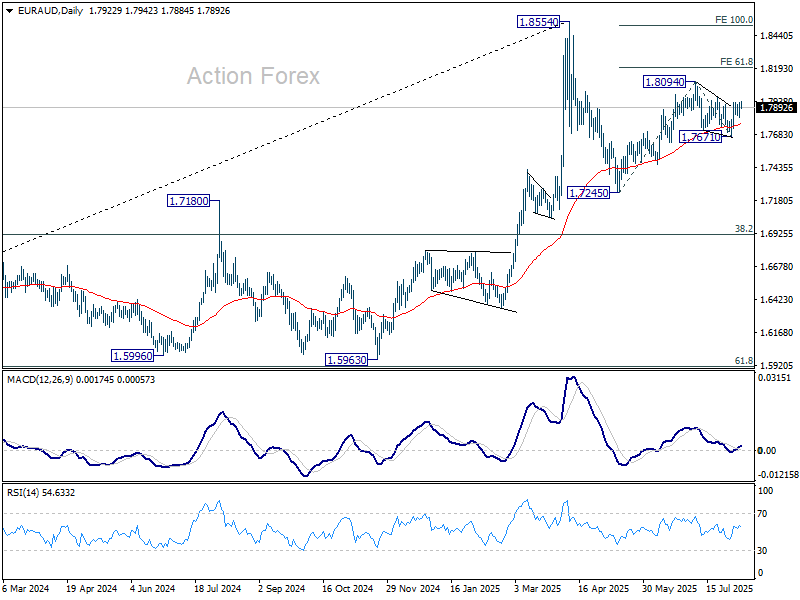
EUR/AUD Daily Outlook
Daily Pivots: (S1) 1.7857; (P) 1.7895; (R1) 1.7968; More...
Intraday bias in EUR/AUD remains neutral for the moment. On the upside, break of 1.7972 resistance should resume the whole rally from 1.7245 through 1.8094 to 61.8% projection of 1.7245 to 1.8094 from 1.7671 at 1.8196. On the downside, below 1.7671 will bring deeper fall back to 1.7459 support instead.
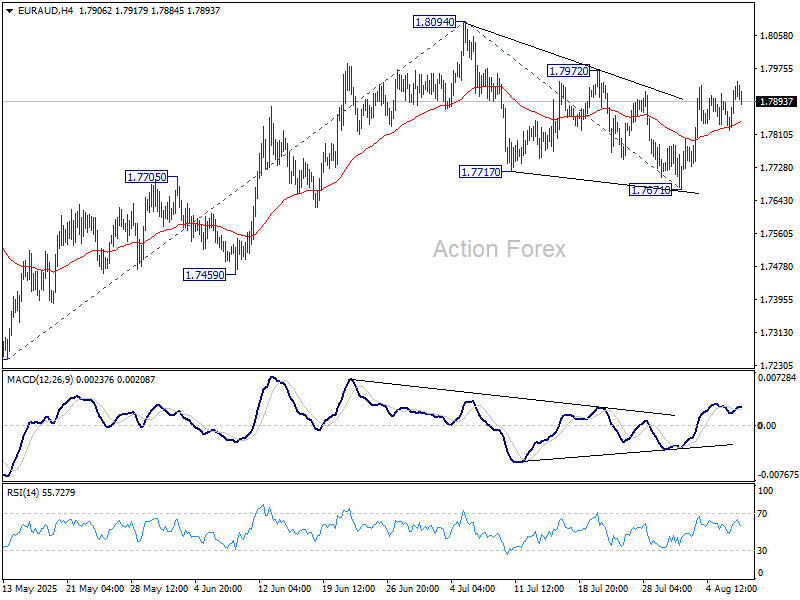
In the bigger picture, price actions from 1.8554 medium term top are seen as a corrective pattern. Such pattern could extend further with another falling leg. But even in that case, downside should be contained by 38.2% retracement of 1.4281 (2022 low) to 1.8554 at 1.6922 to bring rebound. Up trend from 1.4281 is expected to resume at a later stage.
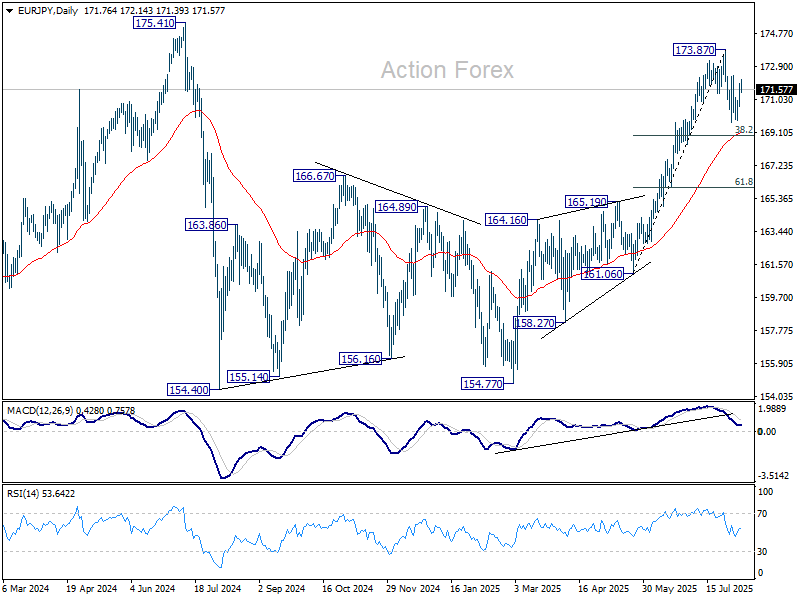
EUR/JPY Daily Outlook
Daily Pivots: (S1) 170.96; (P) 171.48; (R1) 172.34; More...
Intraday bias in EUR/JPY remains neutral for the moment. While fall from 173.87 short term top could extend lower, downside should be contained by 38.2% retracement of 161.06 to 173.87 at 168.97 to bring rebound, at least on first attempt. On the upside, above 172.36 resistance will bring retest of 173.87 first. However, sustained break of 168.97 will raise the chance of near term bearish reversal.
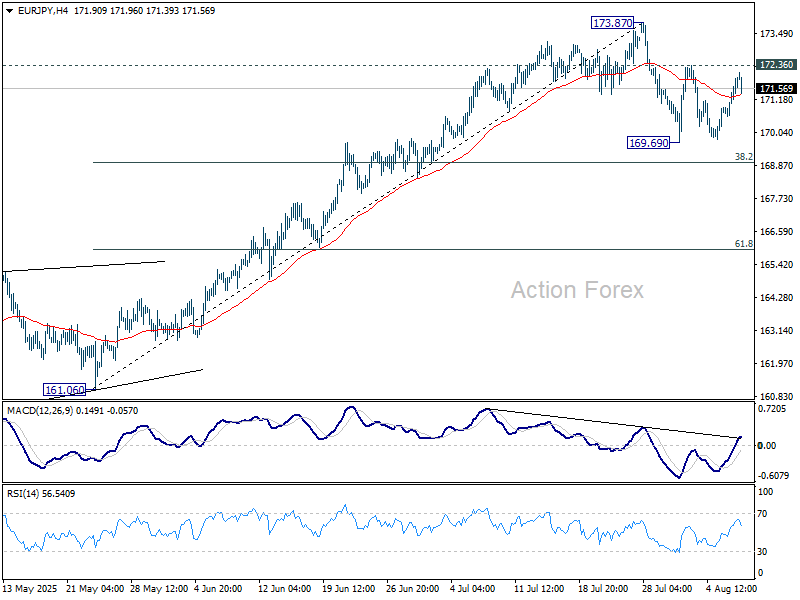
In the bigger picture, considering current strong momentum as seen in the rally from 154.77, corrective pattern from 175.41 could have already completed. Decisive break there will confirm long term up trend resumption. Next target is 61.8% projection of 124.37 to 175.41 from 154.77 at 186.31. However, rejection by 175.41, followed by firm break of 55 D EMA (now at 168.80) will delay this bullish case.
GBP/JPY Daily Outlook
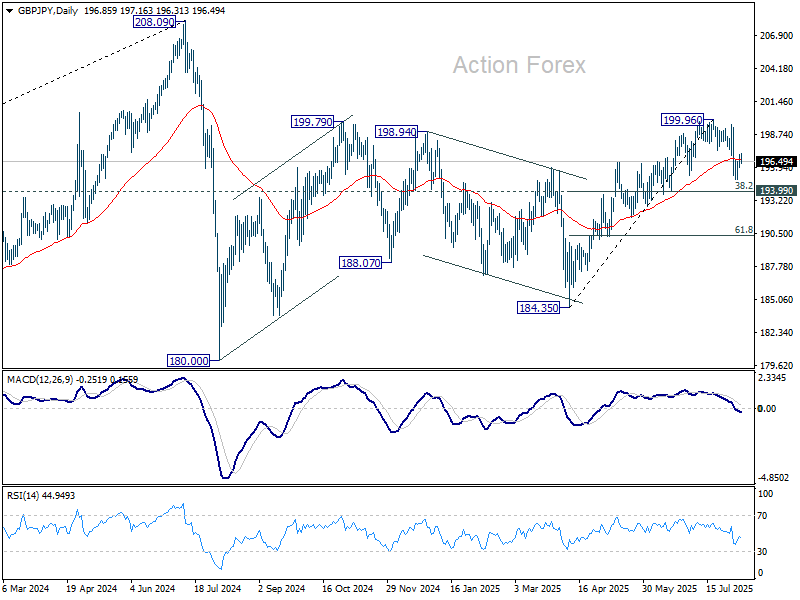
Daily Pivots: (S1) 196.25; (P) 196.67; (R1) 197.25; More...
Intraday bias n GBP/JPY stays neutral for the moment. Corrective fall from 199.96 short term top could extend lower. But strong support is expected from 193.99 cluster support (38.2% retracement of 184.35 to 199.96 at 193.99). to bring rebound. On the upside, break of 197.41 support turned resistance will bring retest of 199.96. However, sustained break of 193.99 will raise the chance of near term bearish reversal.
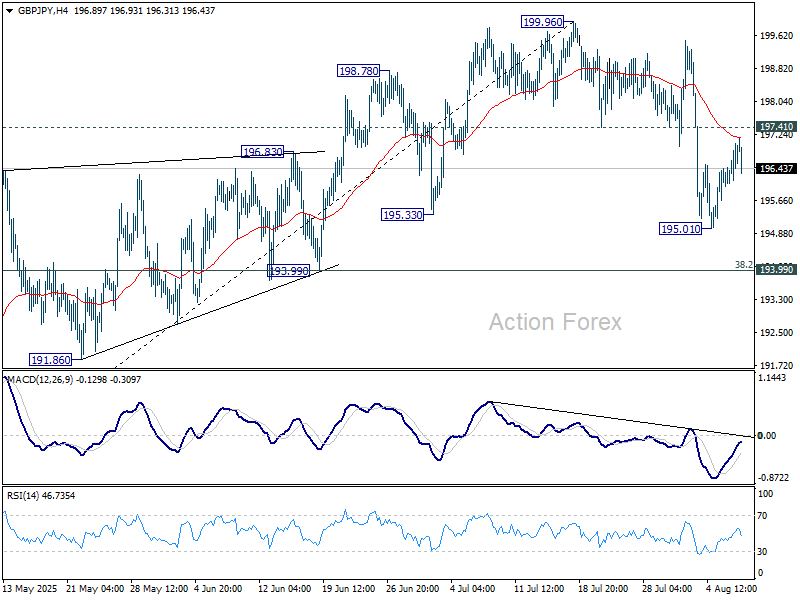
In the bigger picture, price actions from 208.09 (2024 high) are seen as a correction to rally from 123.94 (2020 low). The pattern might still extend with another falling leg. But in that case, strong support should be seen from 38.2% retracement of 123.94 to 208.09 at 175.94 to contain downside. Meanwhile, decisive break of 208.09 will confirm long term up trend resumption.
Bitcoin Could Struggle Ahead – Short-Term Obstacles Mount
Key Highlights
- Bitcoin corrected gains and tested the $112,000 support.
- BTC/USD is now recovering toward a bearish trend line with resistance at $117,500 on the 4-hour chart.
- Ethereum is consolidating gains above the $3,250 support.
- XRP price could start a fresh increase if it stays above $2.840.
Bitcoin Price Technical Analysis
Bitcoin price started a downside correction below $115,000 against the US Dollar. BTC tested the $112,000 support and recently started a recovery wave.
Looking at the 4-hour chart, the price climbed above the $113,500 and $114,000 levels. There was a move above the 38.2% Fib retracement level of the downward move from the $119,833 swing high to the $111,913 low.
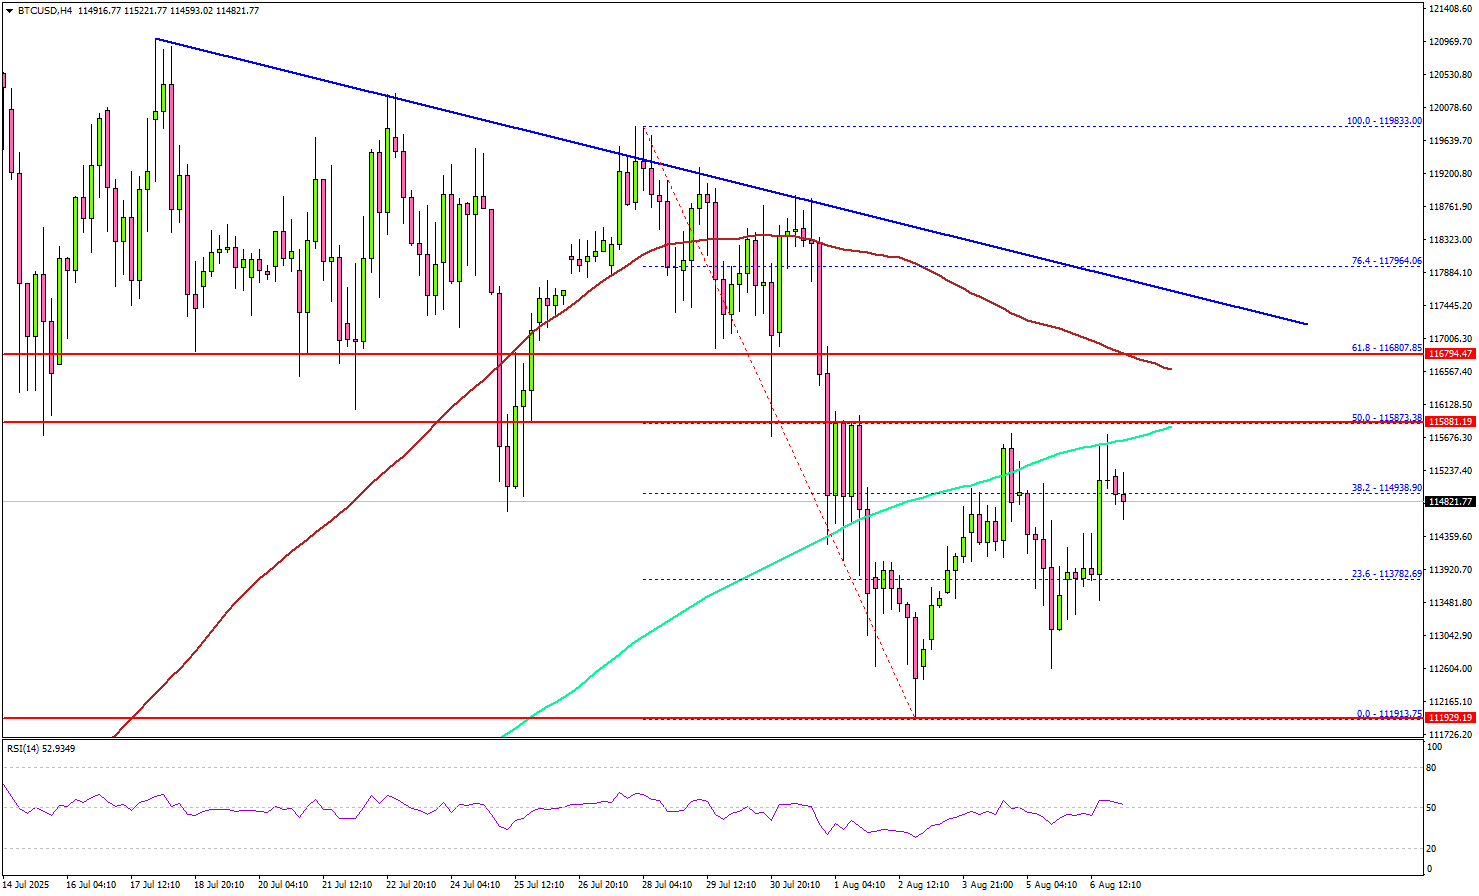
However, the price is still below the 100 simple moving average (red, 4-hour) and the 200 simple moving average (green, 4-hour). On the upside, the price could face resistance near the $116,800 level.
The next key resistance is $117,500. There is also a bearish trend line forming with resistance at $117,500 on the same chart. It coincides with the 61.8% Fib retracement level of the downward move from the $119,833 swing high to the $111,913 low.
A successful close above $117,500 might start another steady increase. In the stated case, the price may perhaps rise toward the $120,000 level. Any more gains might call for a test of $123,200.
Immediate support is near $114,000. A downside break below $114,000 might send BTC toward the $113,500 support. Any more losses might send the price toward the $112,000 support zone.
Looking at Ethereum, the bulls seem to be in control, and they might soon aim for a move above the $3,880 resistance zone.
Today’s Key Economic Releases
- US Initial Jobless Claims - Forecast 221K, versus 218K previous.
Pound Under Pressure Ahead of Bank of England Meeting
The GBP/USD pair climbed to 1.3355 on Thursday as markets braced for today’s Bank of England (BoE) meeting. Traders are closely watching two key factors: the voting split among Monetary Policy Committee (MPC) members and any signals regarding future rate moves.
The central bank is widely expected to cut interest rates by 25 basis points (bps) to 4.00%. However, there is speculation that some members, such as Swati Dingra or Alan Taylor, could push for a more aggressive 50 bps reduction, as seen in May. Should this occur, particularly if accompanied by a shift away from the BoE’s usual cautious tone, the pound could come under significant selling pressure.
Currently, markets have largely priced in a quarter-point cut. Yet, uncertainty remains around the future path of interest rates. While UK inflation remains elevated at 3.6%, well above the 2% target, the economy is weakening, and the labour market is showing signs of strain.
The baseline scenario suggests the BoE will maintain a gradual, data-dependent approach, with potential quarterly cuts. However, any deviation, such as a more aggressive voting split or dovish guidance, could significantly shift market sentiment.
Technical Analysis: GBP/USD
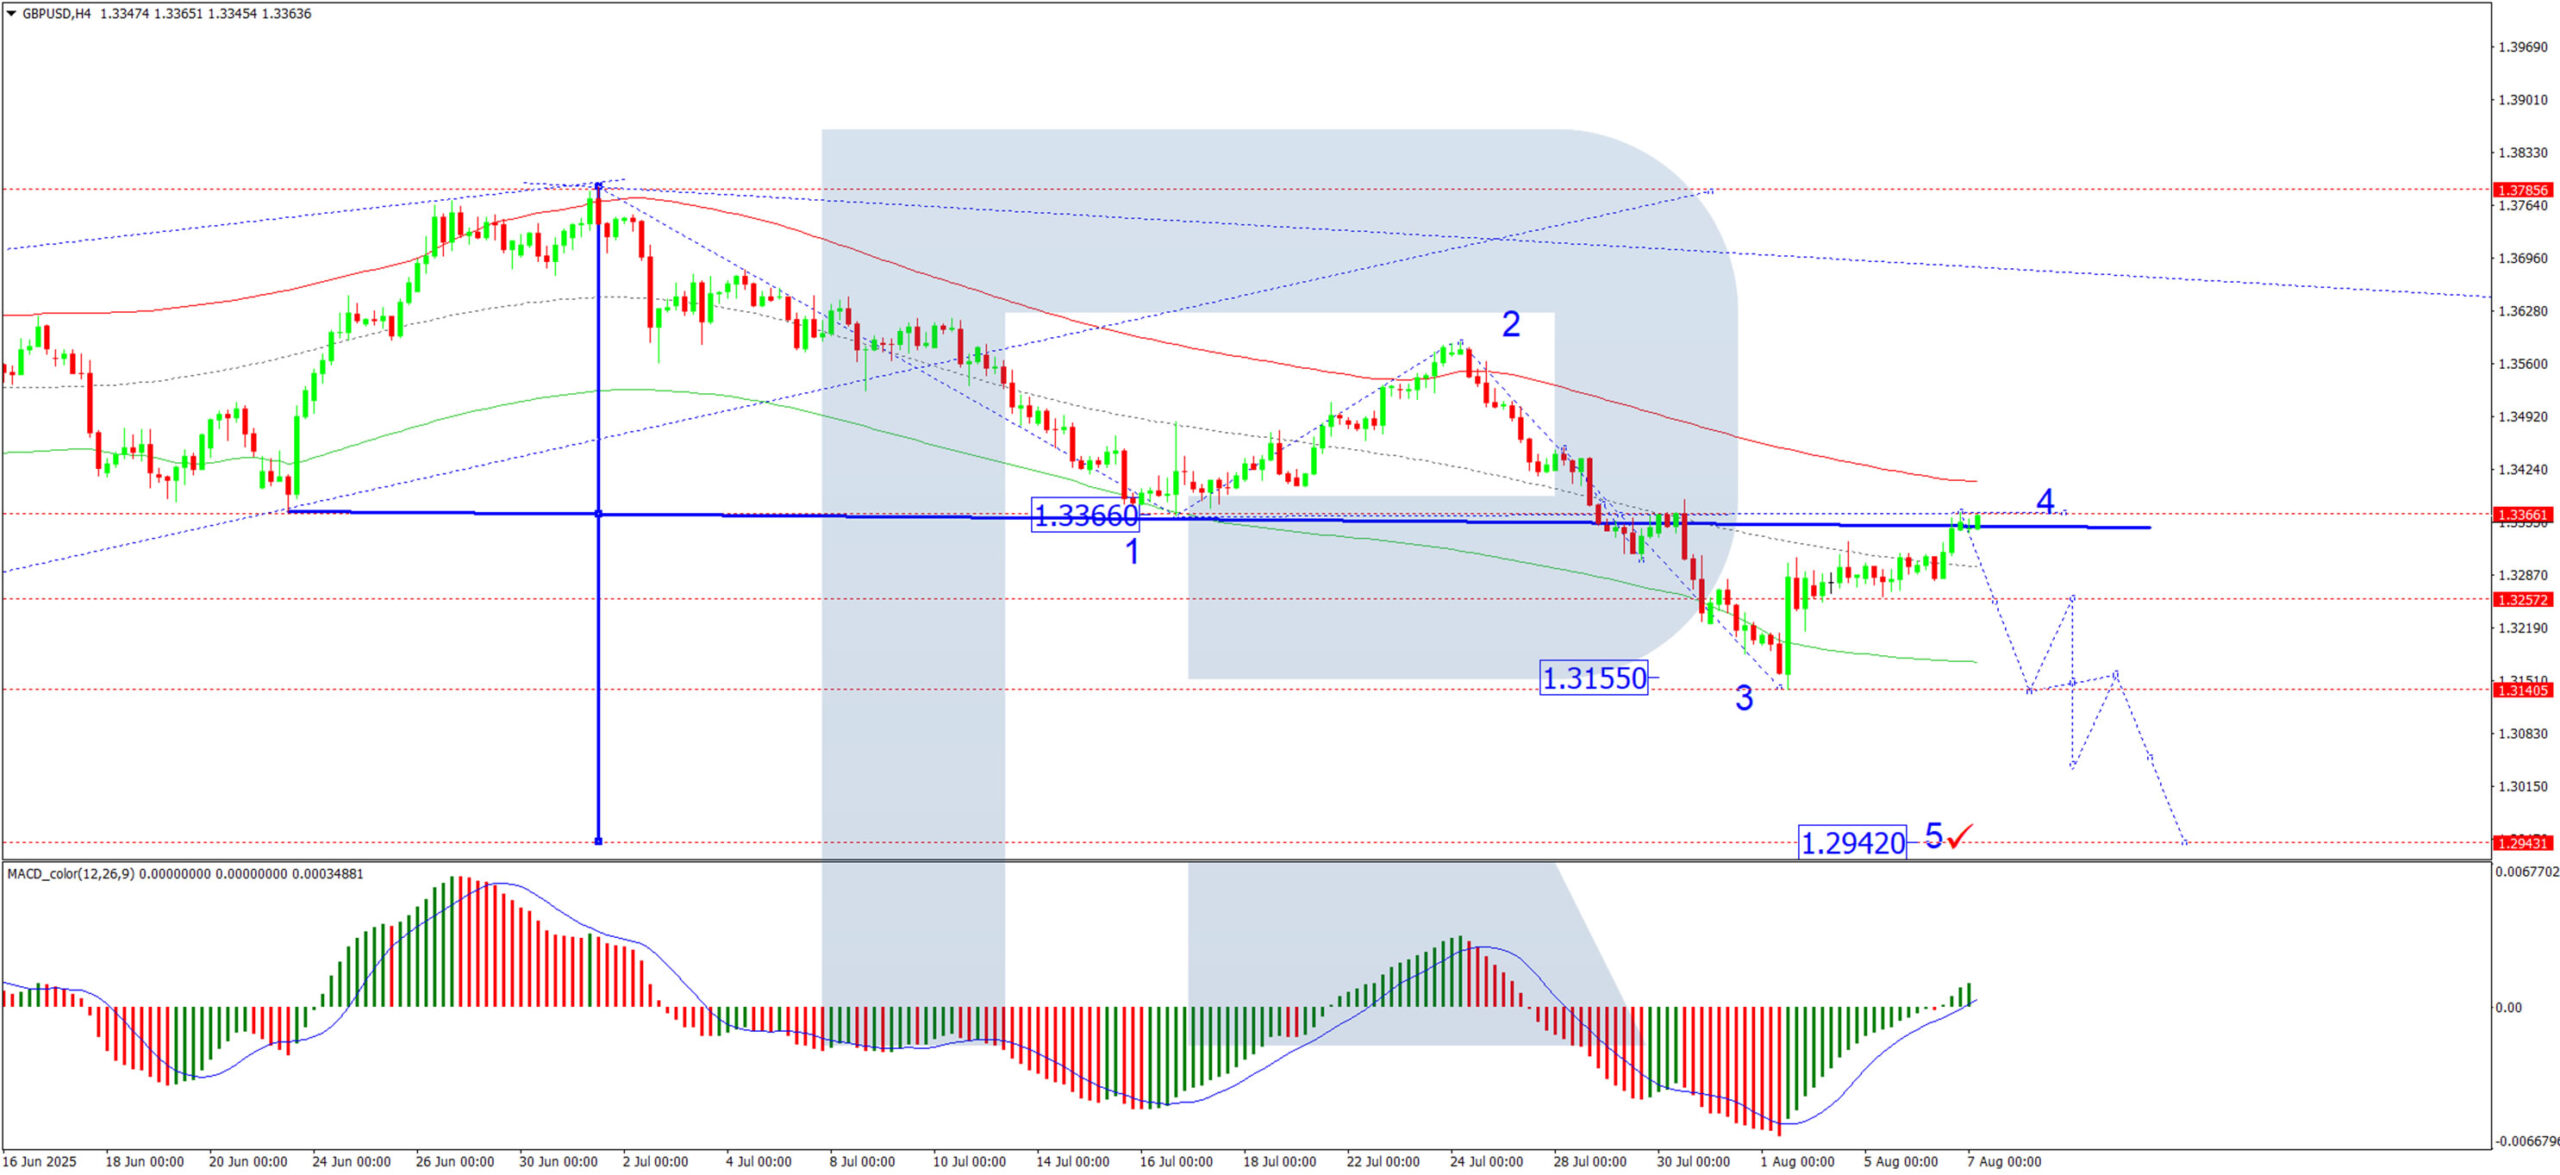
H4 Chart:
The GBP/USD pair has retraced to 1.3366 in a technical correction. A fifth downward wave towards 1.2942 is likely, potentially followed by a corrective rebound to 1.3366. This outlook is supported by the MACD indicator, with its signal line hovering near zero, signalling that downside momentum may soon resume.
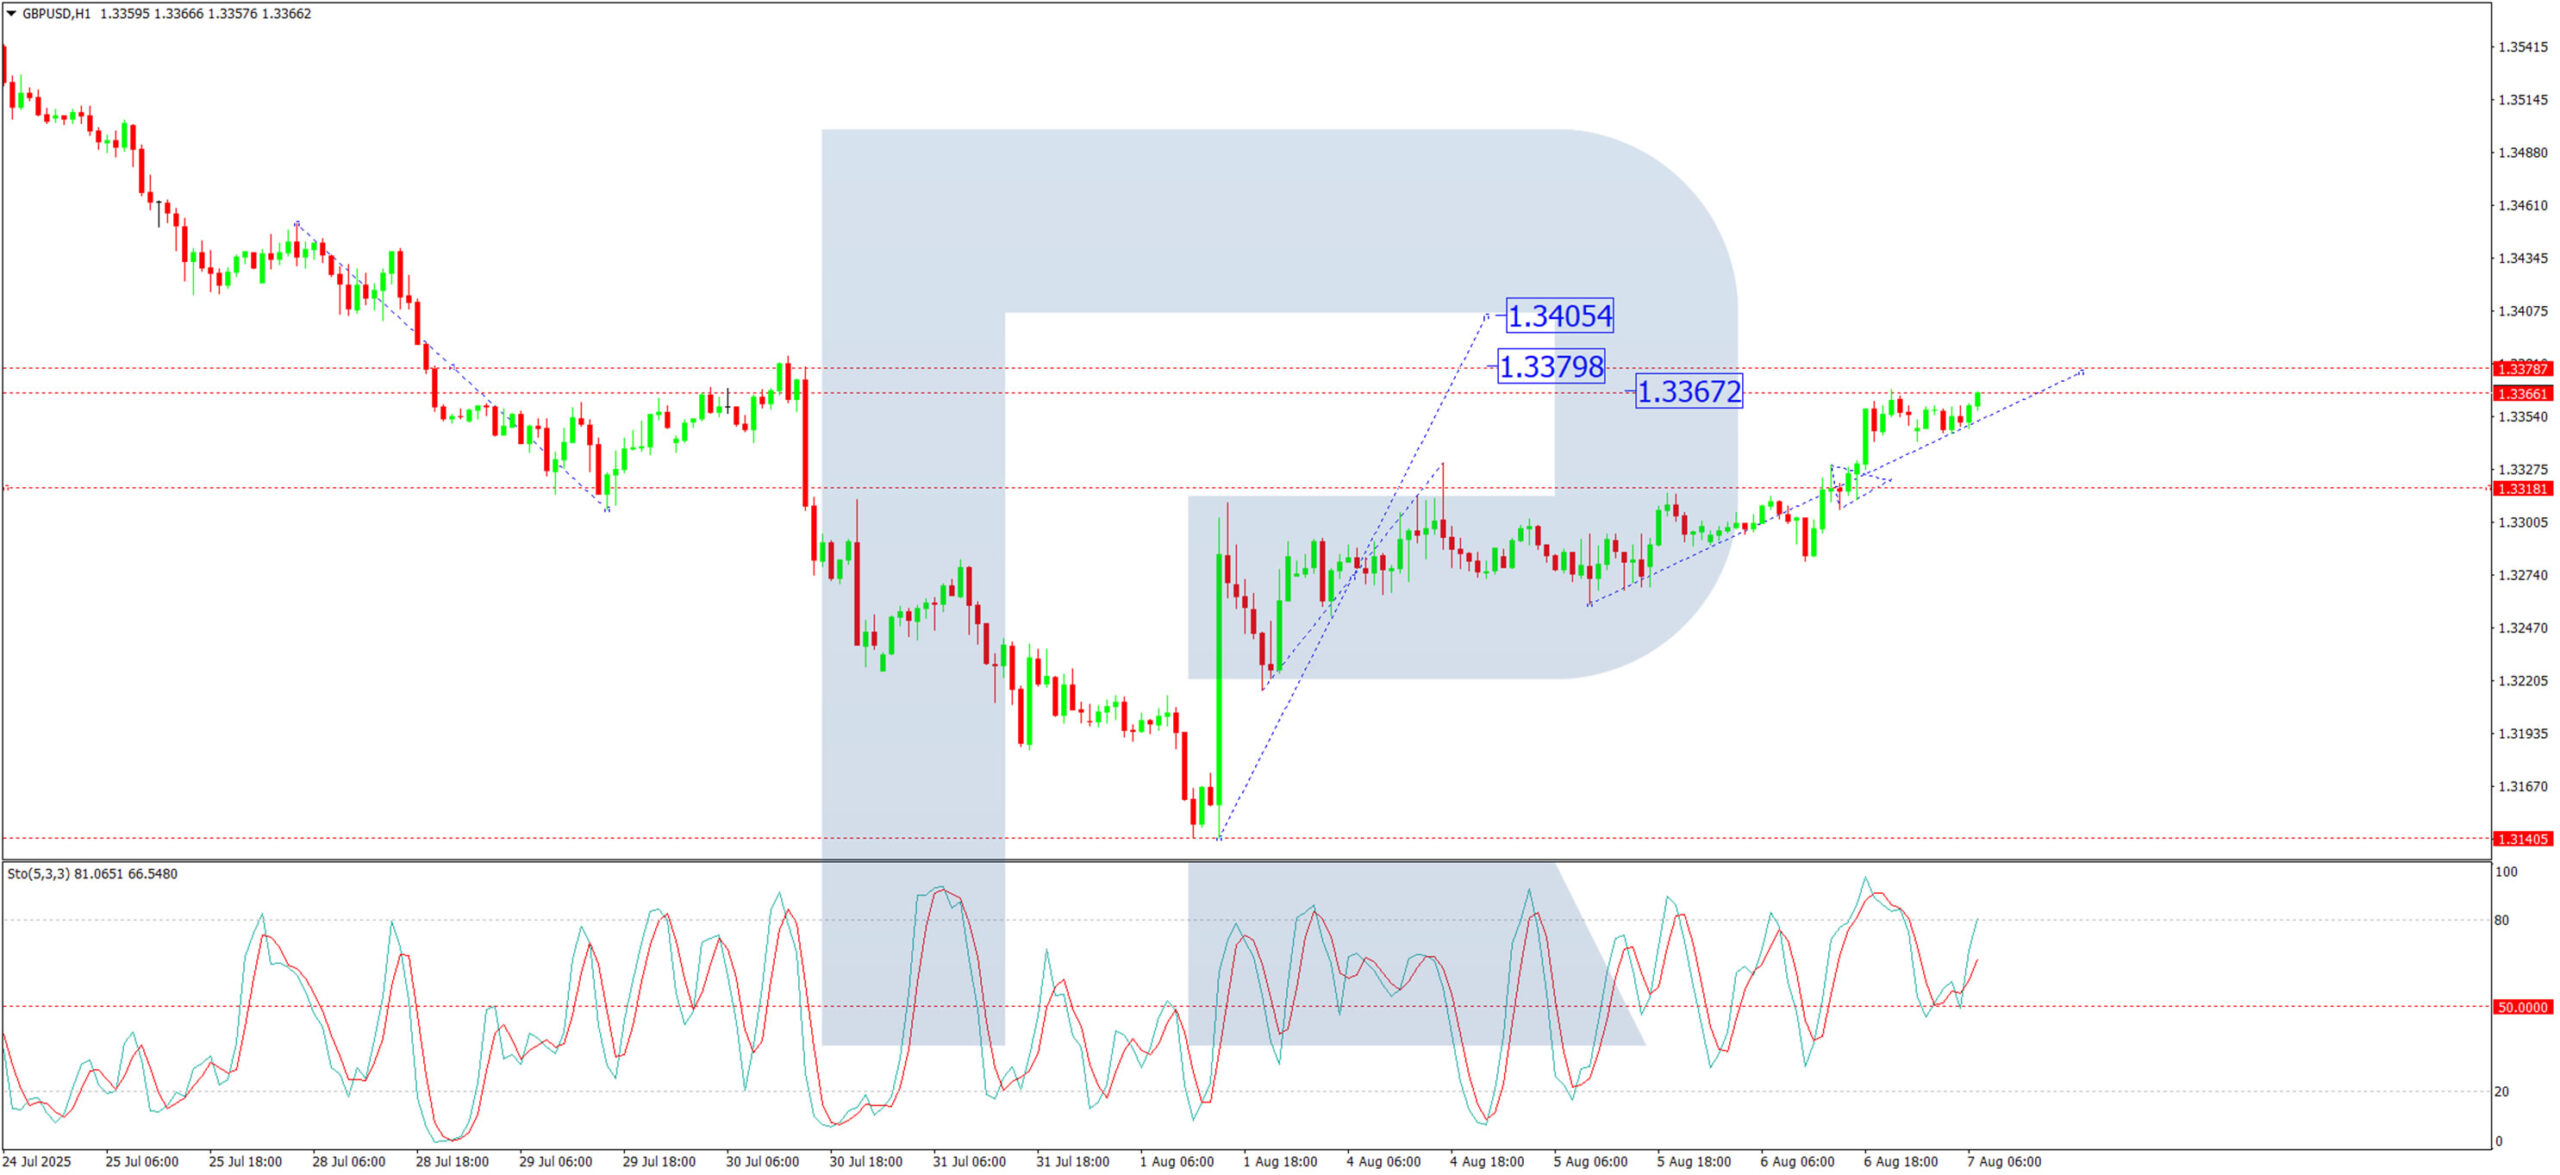
H1 Chart:
A corrective wave is forming following the recent decline. The pair is currently consolidating around 1.3273 –a break above this range could see a push towards 1.3377. However, upon reaching this area, a fresh decline towards 1.3160 is anticipated. A breakdown below this would open the path to 1.2942. This bearish scenario is supported by the Stochastic oscillator, with the signal line below 80 and trending sharply down towards 20.
Conclusion
The pound remains vulnerable ahead of the BoE’s decision, with risks skewed towards further weakness if the central bank adopts a more dovish stance. Technically, the setup points to a resumption of the downtrend, with key levels at 1.3160 and 1.2942 in focus.
EUR/USD Daily Outlook
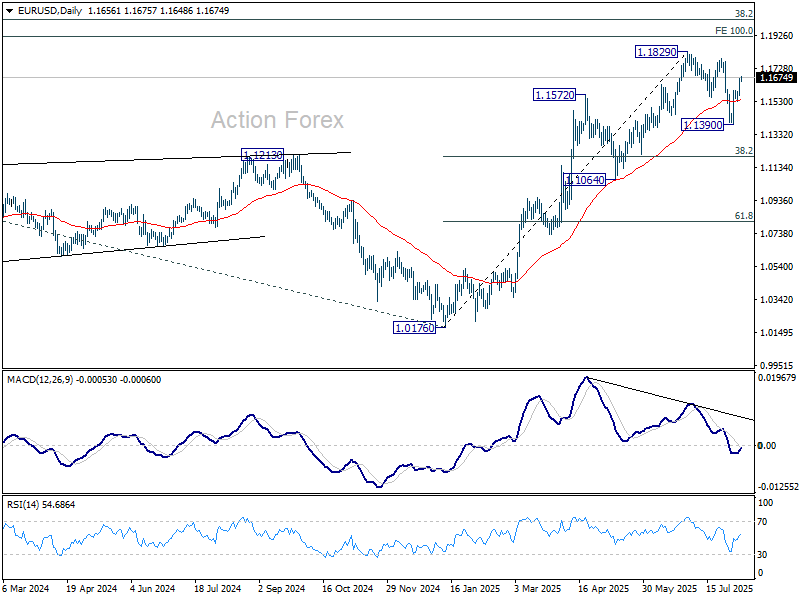
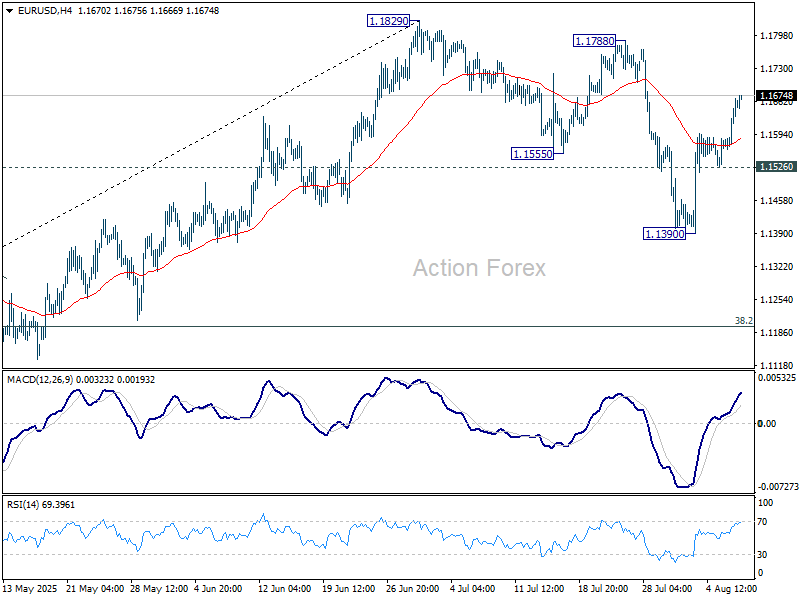
Daily Pivots: (S1) 1.1593; (P) 1.1631; (R1) 1.1697; More...
Intraday bias in EUR/USD remains on the upside for the moment. Correction from 1.1829 should have completed with three waves down to 1.1390. Further rally should be seen to retest 1.1788/1820 resistance zone. On the downside, however, break of 1.1526 minor support will dampen this view and bring retest of 1.1390 instead.
In the bigger picture, rise from 0.9534 long term bottom could be correcting the multi-decade downtrend or the start of a long term up trend. In either case, further rise should be seen to 100% projection of 0.9534 to 1.1274 from 1.0176 at 1.1916. This will remain the favored case as long as 1.1604 support holds.