
Sample Category Title
GBPUSD Outlook Ahead of Thursday’s Bank of England Rate Decision
GBPUSD found intermediate lows at 1.3140, losing close to 7 handles since its June 30 highs.
The pound had seen a huge uptrend in 2025, with a 13.57% increase from 1.21, as the year commenced, to its recent top at 1.3790.
July changed Forex markets consequently with the Dollar Index retaking some of what it had lost through the first half – After the injurious US Non-Farm Payrolls report from last Friday, the Greenback saw some of its momentary strength evaporate and which allowed the GBP to take a breather from strong selling flows.
The Bank of England began a non-continuous rate-cutting cycle, taking their benchmark rate from 5.25% to the current 4.25%.
The Central Bank has struggled with persistently high inflation, in both goods and services sectors, prompting a cautious dovish stance.
However, with the degrading global outlooks and some government mess-ups, Markets have priced a 96% chance of a 25 bps cut for the upcoming meeting.
There is still some uncertainty regarding how dovish the communications from the BoE will be, which will impact the outlook for the pair.
In the waiting for the Thursday meeting (decision released at 7:00 A.M. ET), let's have a look at the Technicals for the pair.
GBPUSD Technical Analysis ahead of Thursday's Bank of England Meeting
GBPUSD Daily Chart
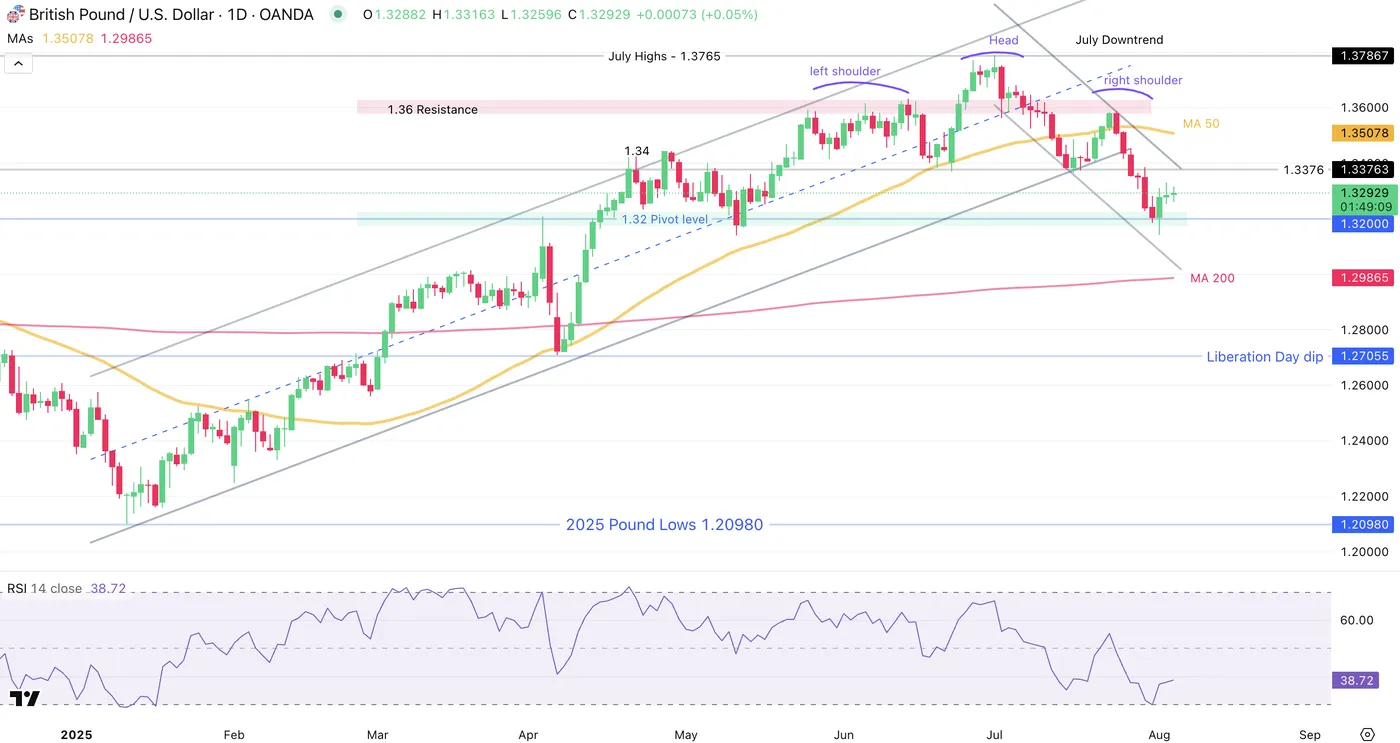
GBPUSD Daily Chart, August 5, 2025 – Source: TradingView
As explained in the introduction, the strong selling flows that started on the 1st of July has found a local bottom on Friday, leading the pair to a 1,300 Pip recovery back right around the 1.33 handle.
It is notable that GBP/USD broke below its 2025 rising channel – It will be key to see how markets react after this. A Head and Shoulders pattern could also be developing.
The pair saw some technical support from an oversold daily RSI, with the indicator currently still stalling in its lower bound. Participants seem to await for the BoE Meeting to move their pieces further.
Today's session marks another consecutive doji candle, so let's take a closer look to spot more detailed levels.
GBPUSD 4H Chart
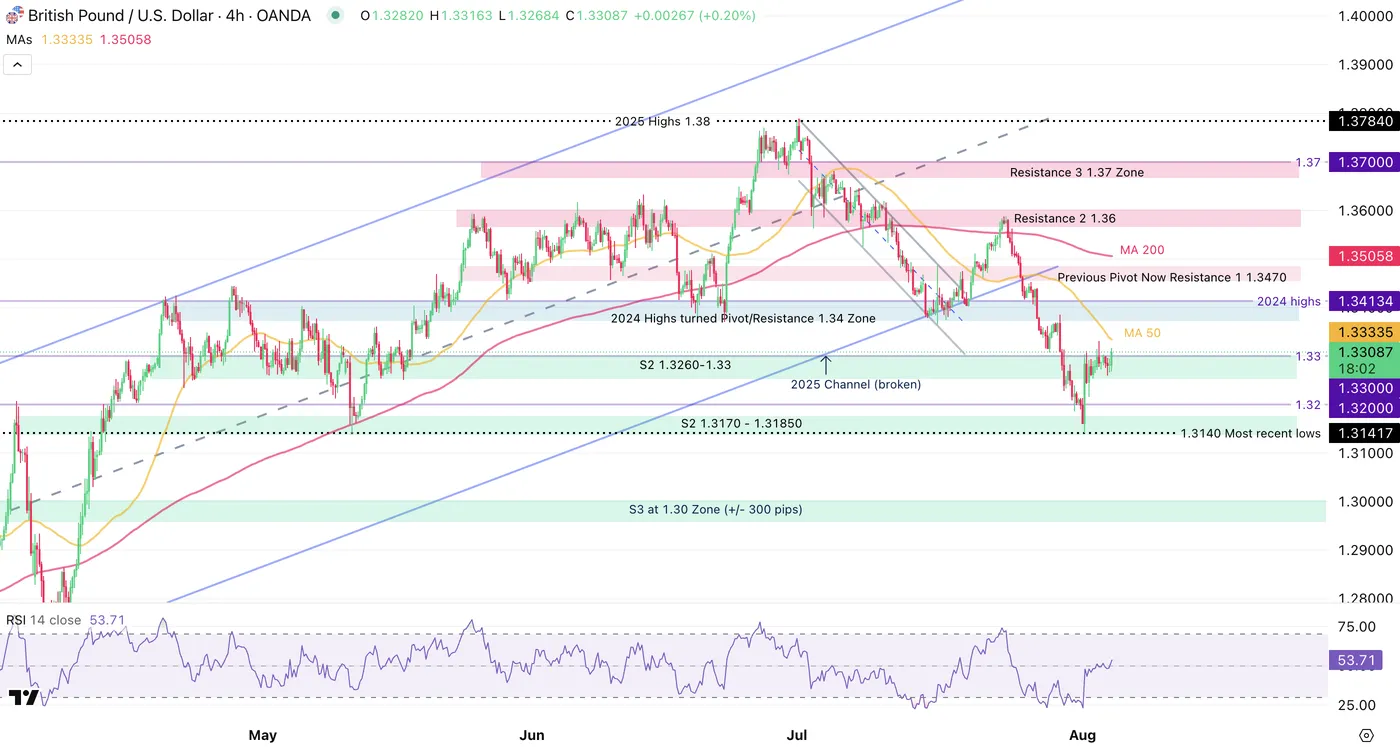
GBPUSD 4H Chart, August 5, 2025 – Source: TradingView
Buyers are trying to push the pair towards the 4H 50-period Moving Average but seem to find some lack of conviction at the 1.33 psychological level.
The support and resistance levels, drawn in our previous Bank of England June-meeting analysis have held very strongly (for now), with the pair finding some dip buyers at the previous S3 level (currently S2 – see the prices below).
Breaking the most recent lows point to a resumption of the bearish trend and this would see the Pound giving back more of its early 2025 gains.
In the meantime, look at the reactions to the 50-period MA (currently at 1.3328); any break higher will test the key 1.34 pivot, a major level for bull/bear strength.
Levels to watch for the pair:
Resistance Levels
- 4H MA 50 1.3328
- 2024 Highs turned Pivot/Resistance 1.34 Zone
- Previous Pivot Now Resistance 1.3470
- Main Resistance 2 1.36
Daily Support Levels
- Support 1 1.3260-1.33
- Support 2 1.3170 - 1.31850 – Most recent lows 1.3140
- S3 at 1.30 Zone (+/- 300 pips)
A lack of conclusive price action does not warrant many reasons to look at smaller timeframes, with the pair stuck in a 500 pip range between 1.3260 (lows) to 1.33150 (highs).
Trade the pair with caution in the waiting of the rate decision.
Safe Trades!
USDCHF – Is It the End of the Run for Swiss Franc?
The Swiss Franc has been on a formidable run in 2025, continuing a trend that began when it reached parity with the US Dollar in November 2022.
With the American Exceptionalism theme, widening deficits, and growing trade distrust, markets have sought the CHF as a stable hedge against the Greenback.
Switzerland’s neutrality in economic and geopolitical affairs—and its low, stable inflation—make it an attractive safe haven, especially in a world facing fresh conflicts.
The Franc’s rally to 2011 highs has also been fueled by regional currency trends. Since early 2025, the Euro’s strength has lifted its neighbors, adding tailwinds to the CHF.
This trend is actually one to watch in Forex where currencies tend to move in tandem with their neighbours – It's an historic trend but got exacerbated with the ongoing geopolitics.
Still, the Swissie hit a local top in July against most majors, including the Yen against which it attained weekly record highs.
While the CHF’s appreciation has not been as explosive as the Euro’s, the trend had remained consistent and persistent – but is it now over?
Next, we’ll look at USDCHF technicals to see if momentum can hold—or if a reversal is on the horizon.
Which safe-haven currency to choose – A small parenthesis on CHF/JPY
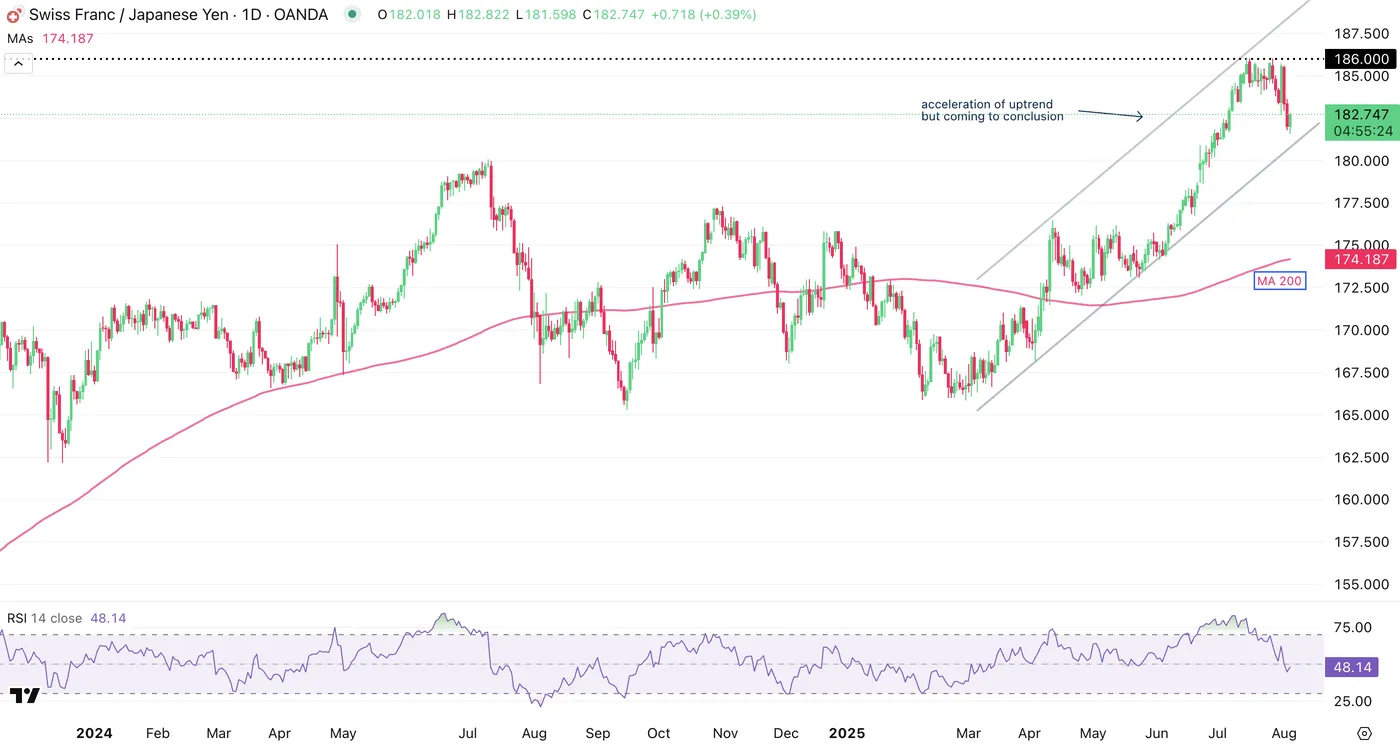
CHF/JPY Daily Chart, August 5, 2025 – Source: TradingView
CHF/JPY has been up-trending since May 2020 (which coincides with lows on Global Yields post-COVID peak fears), and this same trend found some steep acceleration, particularly since Liberation Day.
The pair went from 109.00 lows to the current 186.00 highs.
One aspect to consider when looking at this pair is the Safe-Haven nature of both currencies—the current overperformance of the Franc has marked it as the preferred option for flight-to-safety exposure.
We are now seeing this trend conclude.
The rest is to see if the recent highs mark an intermediate top or more one for the longer-run.
USD/CHF Technical Analysis
USD/CHF Daily Chart
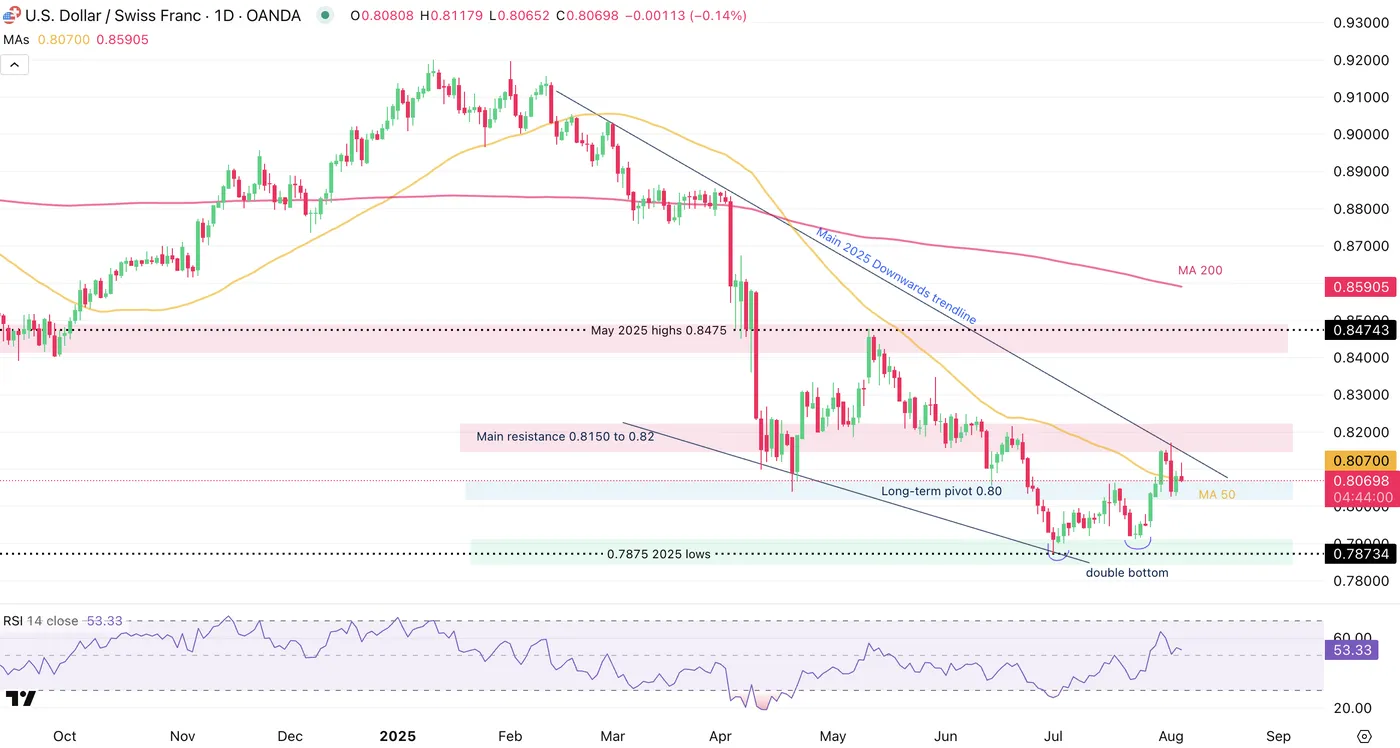
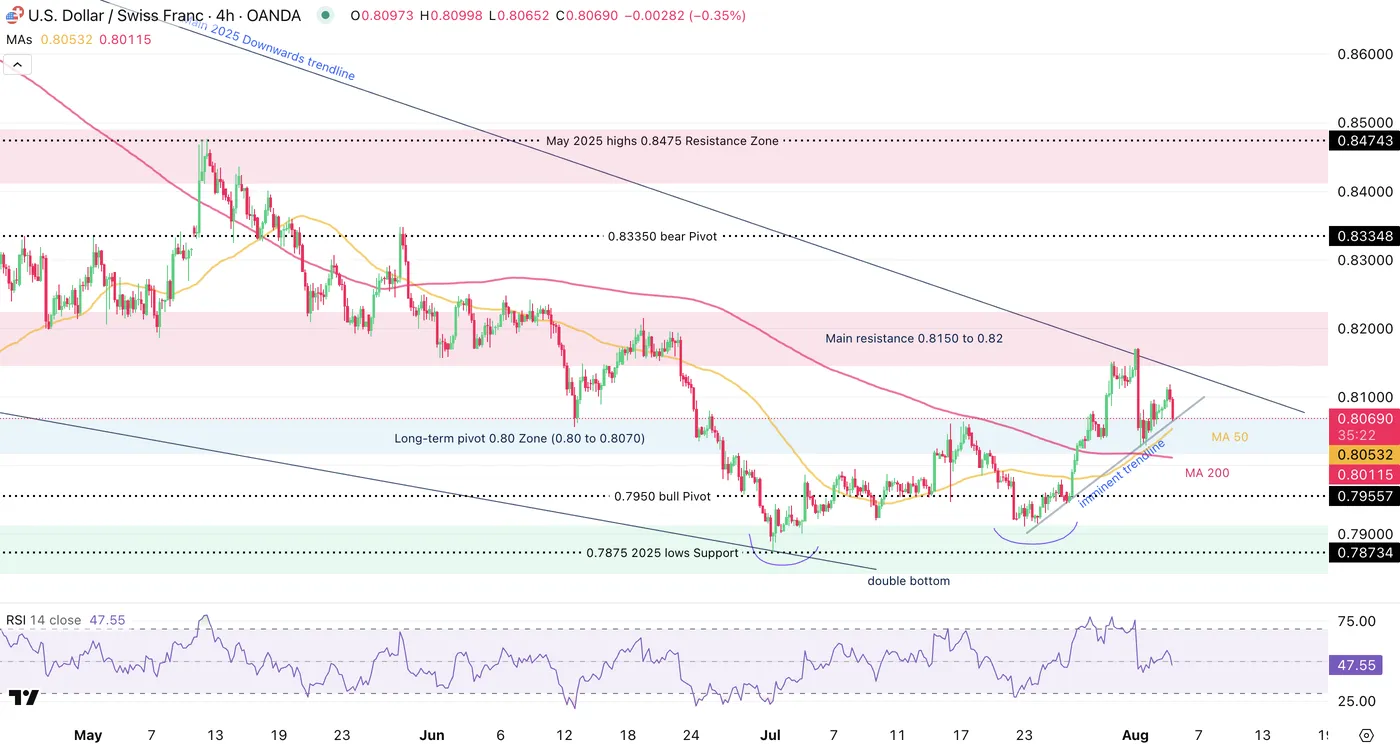
USD/CHF Daily Chart, August 5, 2025 – Source: TradingView
The major pair, which had been in a steep downtrend since the beginning of 2025, has marked a double-bottom on its Daily charts during the month of July after attaining levels unseen since 2011.
Since, the rebound has been consequent but with buyers failing to breach above the 0.8150 to 0.82 Main Resistance, the action is seeing more balance.
Watch the 50-Day MA acting as immediate support to spot if buyers manage to respond to the 2025 Main Descending Trendline, which just acted as a supply zone for USD/CHF Sellers.
The RSI Momentum was rising but is still closer to the neutral level than decisively bullish momentum.
USDCHF 4H Chart
USD/CHF 4H Chart, August 5, 2025 – Source: TradingView
Looking closer, sellers are bringing back the pair into its 0.80 Main Pivot Zone (0.80 to 0.8070), where reactions will be important to monitor.
There are some conflicting signs between the uptrending intermediate trendline formed after the double bottom and the main descending 2025 trend.
Looking at the conflicting price action, there is a high probability of a range forming around the Pivot Zone but it is still far from being confirmed, therefore the pair will have to be watched closely and may move fast depending on risk appetite.
The current price action is currently seller-dominated after this morning's miss in the US Services PMIs.
Levels to watch for the pair:
Daily Resistance Levels
- Main resistance 0.8150 to 0.82 (last highs 0.8165)
- 0.83350 bear Pivot
- May 2025 highs 0.8475 Resistance Zone
Daily Support Levels
- Long-term pivot 0.80 Zone (0.80 to 0.8070) Confluence with Daily and 4H MA 50
- 0.7950 bull Pivot
- 0.7875 2025 lows
Safe Trades!
Gold’s (XAU/USD) Whipsaw Price Action a Sign that Bulls are Back at the Table. $3400/oz Up Next?
Gold prices have seen whipsaw price action today with a $30 drop being wiped away after the US open. Part of this could be down to another poor US data point which will only add to rate cut bets moving forward.
The US ISM Services PMI dropped to 50.1 in July 2025 from 50.8 in June, falling short of the expected 51.5. This shows the services sector barely grew, with seasonal and weather issues affecting business. There was a slowdown in business activity (52.6 vs 54.2), new orders (50.3 vs 51.3), and inventories (51.8 vs 52.7).
Meanwhile, price pressures increased to their highest level since October 2022 (69.9 vs 67.5), with many survey participants highlighting the impact of tariffs, especially on commodities.
Gold prices had already been on a recovery from a daily low around $3349 before the data further boosted the recovery.
Gold Prices Moving Forward - Federal Reserve Policy & Rate Cut Expectations
Golds looked on course for a potential correction last week before the US jobs data. The picture since then has changed dramatically however, and this underscores the age old adage, ‘trade what you see, not what you think’.
The most significant change has come in the form of rate cut expectations from the US Federal Reserve. Ahead of the jobs data on Friday last week, markets were still split around the 50-50 mark on a potential rate cut in September following the Fed meeting on Wednesday.
However, as of this morning the CME FedWatch Tool reflected a high 88% probability of such a cut at the upcoming monetary policy meeting in September.
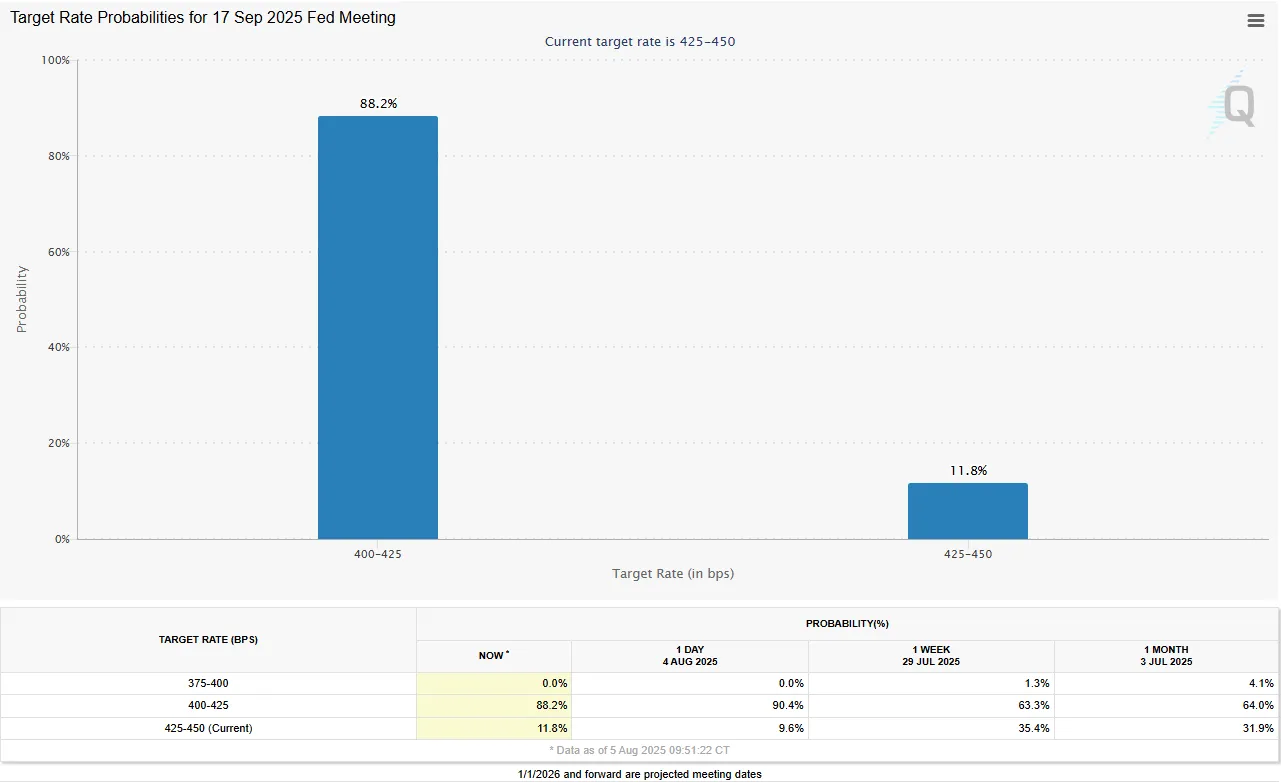
Source: CME FedWatch Tool
The jobs data has raised hopes in the market for two or even three interest rate cuts by the end of the year, with the first expected in September and the second in October.
Even cautious comments from Federal Reserve officials were seen as signs that rate cuts might be coming. San Francisco Fed President Mary Daly urged caution about expecting aggressive rate cuts, saying the job market wasn’t "too weak" and suggesting the Fed could wait a bit longer. However, she also mentioned that the Fed "can’t wait forever" and downplayed the idea that tariffs were causing long-term inflation. Markets took her comments as a sign that the Fed might still cut rates in September.
This strong belief in upcoming rate cuts is helping support gold prices. Lower interest rates make gold more attractive because it doesn’t pay interest, so the cost of holding it becomes less of a concern.
Looking ahead, the next big catalyst which could shape both Fed rate cut expectations and have a material impact on Gold is likely to be the US CPI data. A strong CPI print would likely trigger a significant re-evaluation of its bullish trajectory, whereas other data points might only cause minor fluctuations.
Technical Analysis - Gold (XAU/USD)
From a technical standpoint, Gold monthly candle close for July closed as a massive shooting star which hints at further downside ahead.
This also marked the first bearish monthly close since December 2024 and could be a sing of the shift in momentum between buyers and sellers.
However, price action since Friday has left a potential deeper pullback at risk. On a monthly chart, a candle close above the 3439 handle will be needed to invalidate the setup and for this we will have to wait the rest of the month.
Looking at a more near-term perspective, let us look at the daily timeframe. Here we can see the recent bullish move which is approaching the most recent swing high around 3431.
A daily candle close above this level will invalidate the bearish setup on the daily timeframe and put bulls firmly in control.
Given that tariffs are now largely set and implementation is largely what remains, the chance that we enter a period of consolidation is shrinking.
This hints that a daily candle close above the 3431 may lead to more bullish momentum.
Gold (XAU/USD) Daily Chart, August 5, 2025
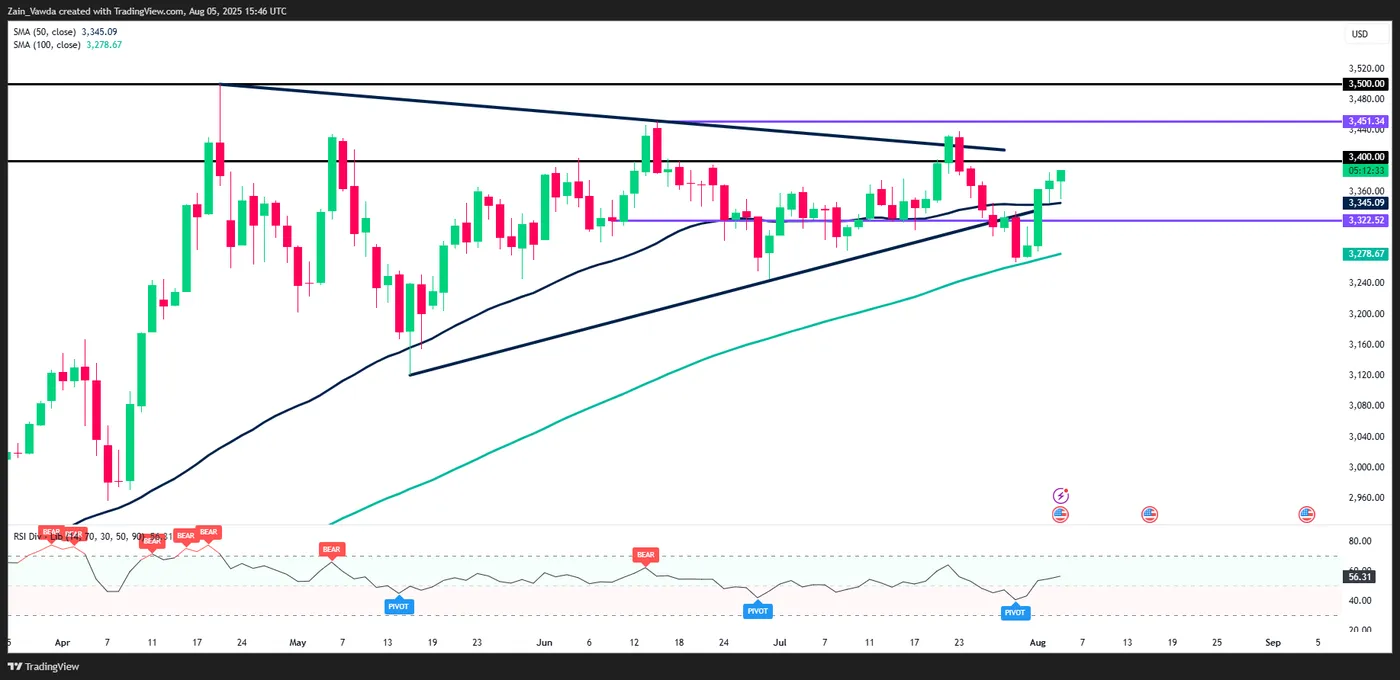
Source: TradingView (click to enlarge)
Client Sentiment Data - XAU/USD
Looking at OANDA client sentiment data and market participants are Long on Gold with 55% of traders net-long. I prefer to take a contrarian view toward crowd sentiment, however with a 55-45 split this is rather too close to draw any conclusions just yet.
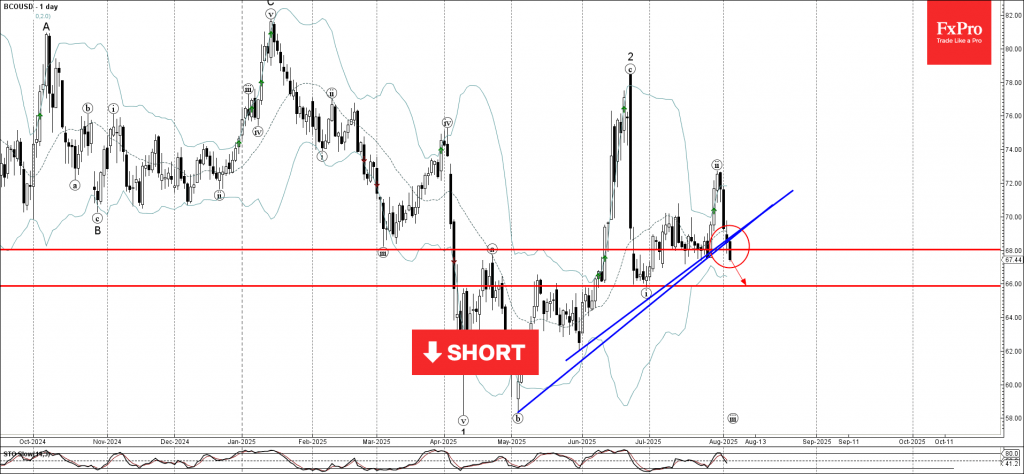
Brent Crude Oil Wave Analysis
Brent Crude Oil: ⬇️ Sell
- Brent Crude Oil broke support zone
- Likely to fall to support level 66.00
Brent Crude Oil recently broke the support zone between the key support level of 68.00 (which reversed the price multiple times in July) and the two support trendlines from May.
The breakout of this support zone accelerated the active impulse wave iii of the higher order impulse wave 3 from the middle of June.
Brent Crude Oil can be expected to fall to the next support level 66.00 (former resistance from May and the low of the earlier impulse wave i).
S&P 500 Shows a Decline After US Services PMI Miss
Markets just received the report for the monthly ISM Services PMI report, and despite a beat on the Global PMI report (55.1 vs 54.6 expected – less Market-moving), the more influent Services data missed by a decent margin.
The data came in at 50.1, just at the brink of contraction territory and with the 51.5 consensus, Equity markets have started to show some signs of retraction.
Reactions also point to some selling in the US Dollar after temporarily breaching the 99.00 handle – The DXY now trades back into the high 98.00 territory.
We'll be taking a look at S&P 500 charts to see what's into play as the US Dollar and US Equity correlation is growing again.
US ISM Services PMI report
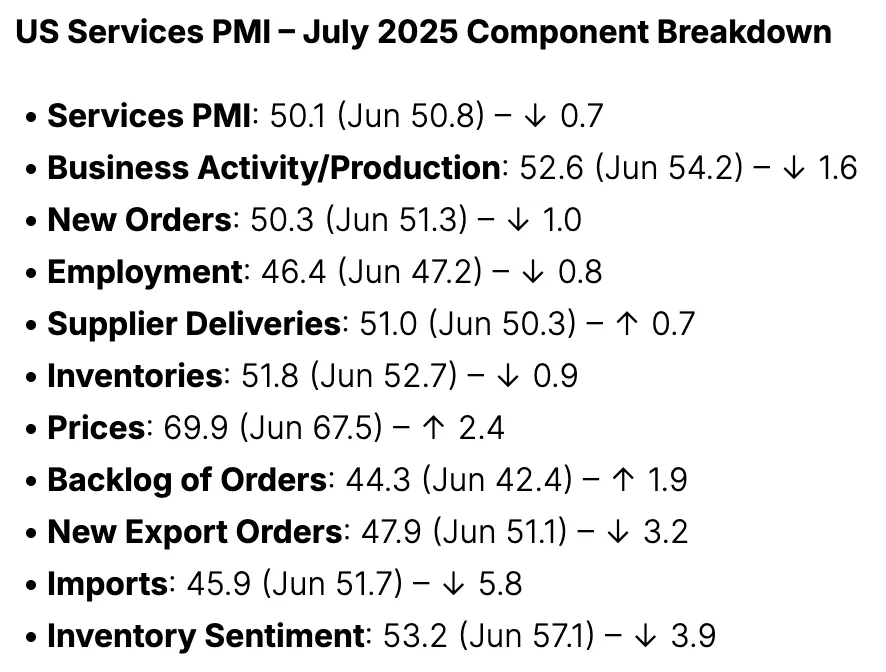
US Services PMI and its components, August 5, 2025 – Source: InvestingLive.com
7 out of the 10 components influencing the main release have fallen in the monthly report, further confirming that Tariffs are starting to have an impact on American activity.
Tariffs have by the way seen quite a few mentions in today's report, on 9 different occasions. Central Banks will be looking mostly at the impact of tariffs on Prices;
Different sectors including Healthcare, Agriculture, education and transporting have mentioned that "Tariffs are now starting to show up in pricing, and we are seeing increases across the board.”
S&P 500 4H Chart
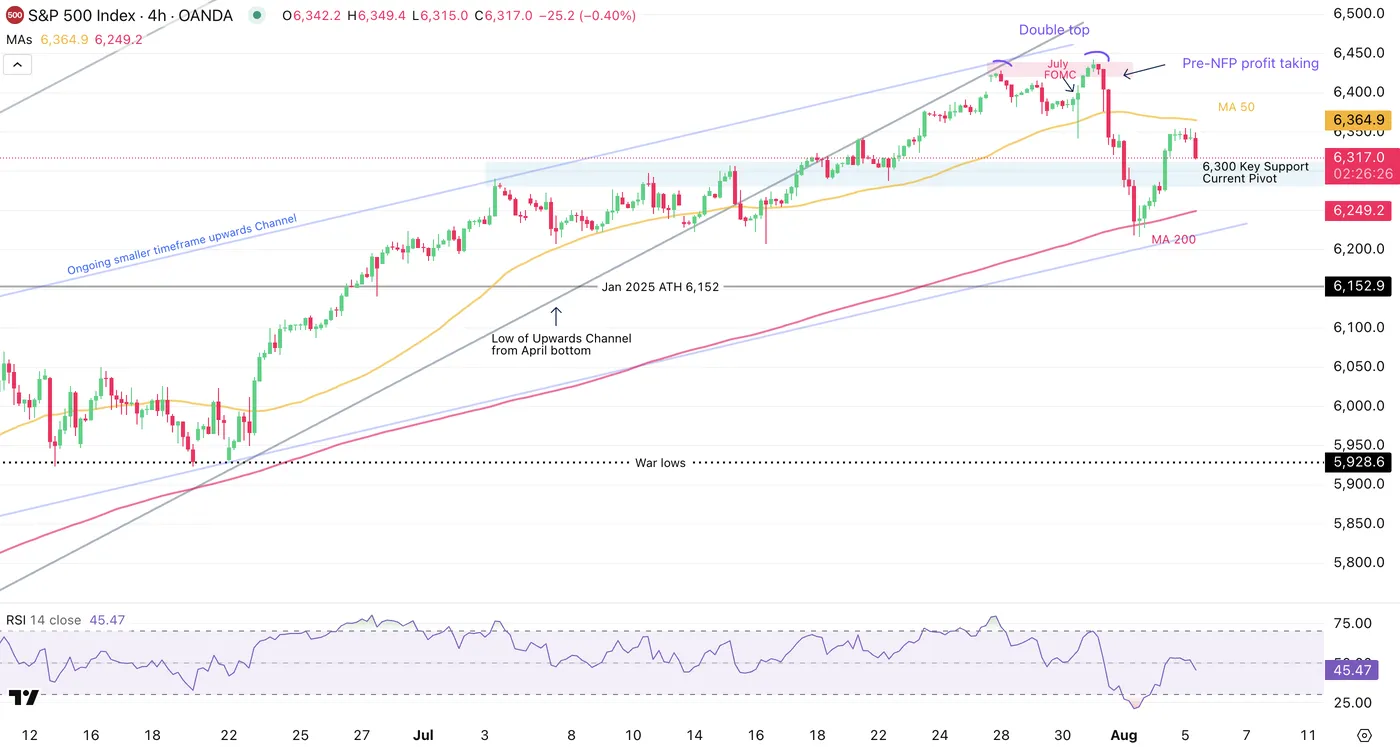
S&P 500 4H Chart, August 5, 2025 – Source: TradingView
Despite showing a strong pullback higher, US Equities are starting to form some lower highs on higher timeframes.
Looking at the bigger picture, the price action had been evolving in two different upward channels:
- The first being the April Liberation Day tariff lows, now broken after forming a double top (see on chart: Lower Bound trendline in black)
- The second (in Blue), still valid, has shown a rebound at the lows of its own lower bound, supported by the 4H MA 200 – The NFP lows are at 6,216 on the S&P CFD.
Sellers are stepping in after the missed PMI report and prices are now entering the key 6,300 Support Zone.
S&P 500 30m Chart
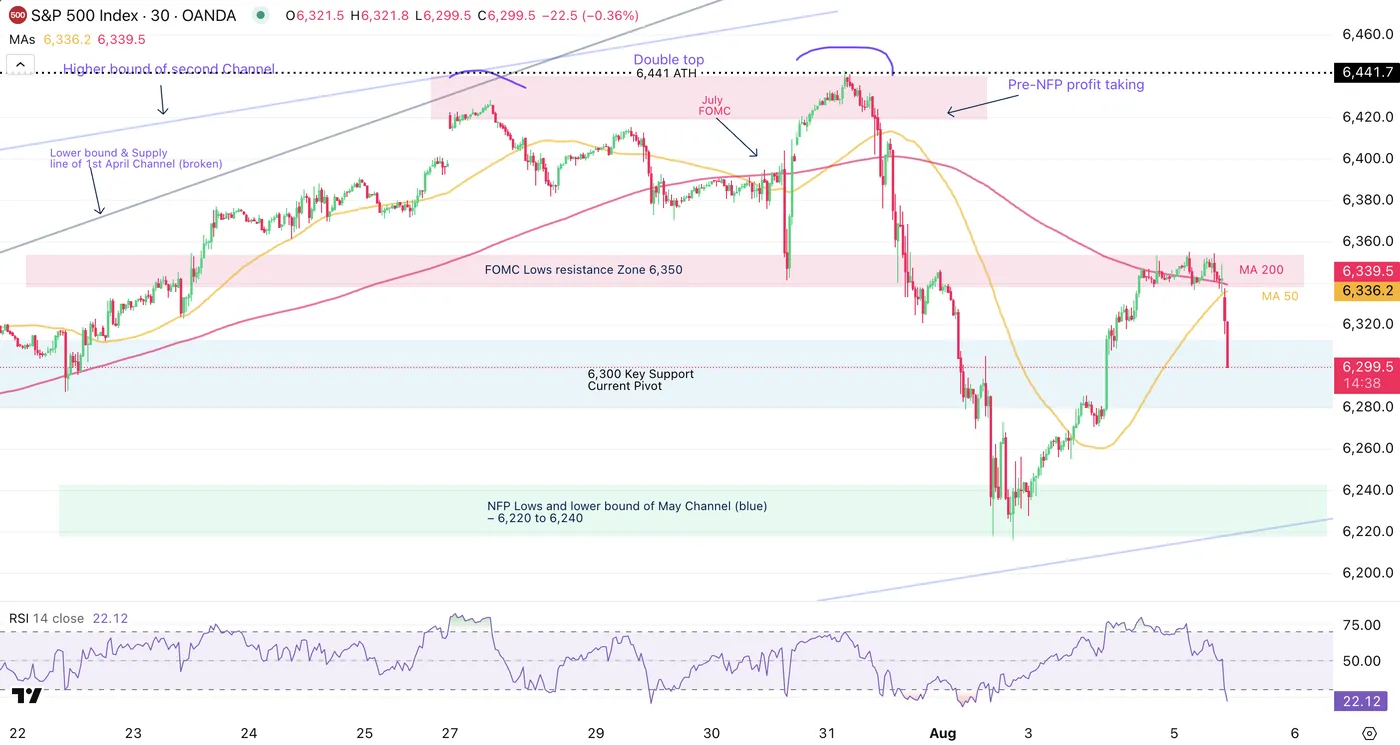
S&P 500 30m Chart, August 5, 2025 – Source: TradingView
Looking closer, the ongoing selling is strong with prices moving below the 50 and 200 MAs.
RSI momentum is getting oversold on lower timeframes, therefore reactions around the 6,300 psychological handle will be essential to monitor – down close to 0.50% on the session, we are currently trading in this region.
Key levels to place on your charts:
- 6,441 ATH on CFD (6,427 on SPX Index)
- FOMC Lows resistance Zone 6,350
- 6,300 Key Support – Current Pivot (+/- 15 points)
- NFP Lows and lower bound of May Channel – 6,220 to 6,240
Safe Trades!
New Zealand Employment Expected to Decline, US ISM Services PMI
The New Zealand dollar has edged lower on Tuesday. In the North American session, NZD/USD is trading at 0.5892, down 0.27% on the day.
New Zealand employment expected at -0.1%
New Zealand releases the employment report for the second quarter on Wednesday, with the markets braced for worsening data for the labor market. Employment change is expected to contract by 0.1%, down from a 0.1% gain in Q1. The unemployment rate, which was unchanged at Q1 at 5.1%, is expected to rise to 5.3% in Q2, which would be the highest rate since Q3 2020.
The New Zealand economy sustained a recession last year and the labor market has softened. Global demand for New Zealand exports has fallen as trade tensions remain high due US trade policy. The softening labor market and weak global conditions have raised the downside risk to inflation, which supports the case for the Reserve Bank of New Zealand to lower rates on Aug. 20.
The Reserve Bank has been aggressive in the current easing cycle, cutting rates by 225 points in just 12 months, to a current cash rate of 3.25%. Bank policymakers will be keeping a close eye on Thursday's inflation expectations, which accelerated to 2.3% in the second quarter. The release shouldn't complicate the RBNZ's plan to cut rates at the next meeting, providing that inflation expectations do not rise significantly.
US ISM Services PMI expected to improve
The ISM services PMI is expected to accelerate to 51.5 in July, compared to 50.8 in June. The services sector is back in expansion territory after a rare contraction (49.9) in May. Services purchase managers pointed to the uncertainty over tariff impacts as their number one concern.
NZD/USD Technical
- NZD/USD is testing support at 0.5894. Below, there is support at 0.5881
- 0.5913 and 0.5926 are the next resistance lines
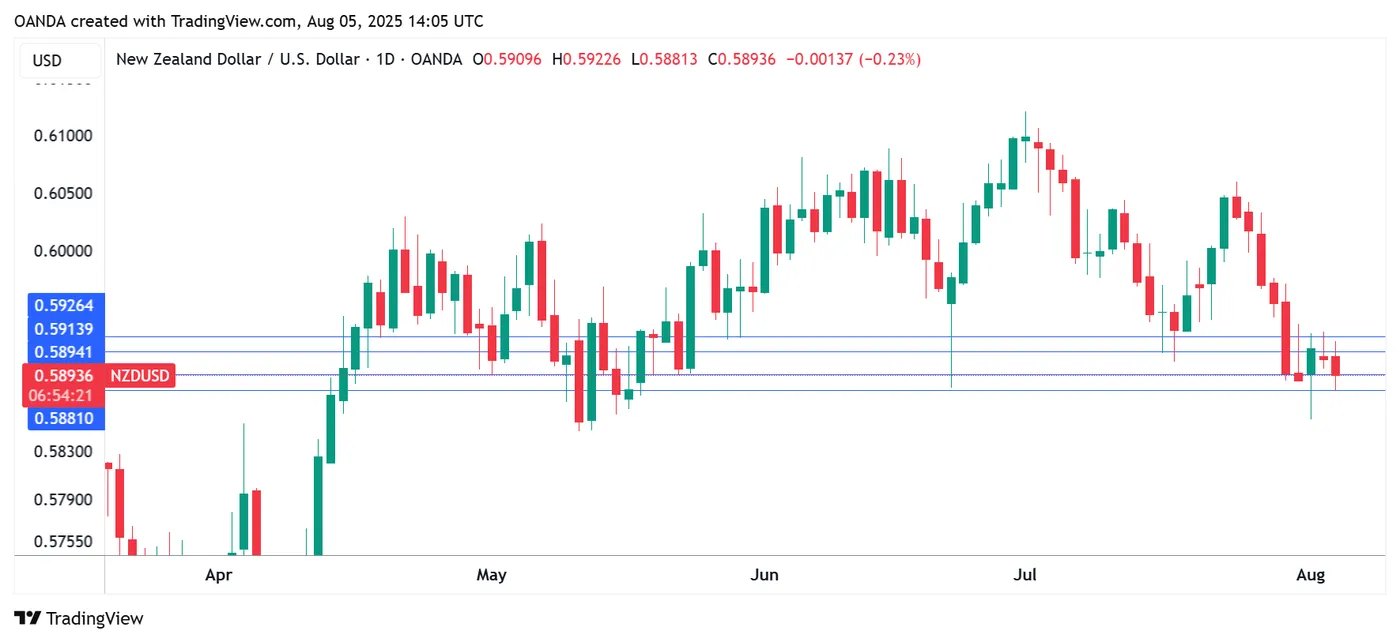
NZDUSD 1-Day Chart, Aug. 4, 2025
US: ISM Services Expansion Softens in July
The ISM Services index gave back much of the previous month's gain, falling 0.7 points to 50.1 in July. This was well below the market consensus forecast for an improvement to 51.5. However, the number of industries reporting growth in July was a tick higher at 11 out of 18, compared to 10 in the previous two months.
Business activity fell 1.6 points to 52.6, while new orders fell by one point to 50.3. The backlog of orders improved but remained in contraction (up 1.9 points to 44.3).
The employment index held in contractionary territory, falling 0.8 points to 46.4 – its lowest level since March.
The supplier deliveries index rose 0.7 points to 51. The July uptick points to a slower supplier delivery performance. The prices paid index also shot up 2.4 points to 69.9 – the highest level since late 2022.
Key Implications
The pullback in the ISM services index suggests that activity in the services sector expanded at a slower clip in July, with the headline index only a hair above the 50-point contractionary threshold. There were additional blemishes in the report, including an increase in the prices paid index to the highest level since late 2022, and the fact that the employment index held in contractionary territory for the second month in a row – a theme that's in tune with a softened overall employment backdrop.
The softer trend in ISM services, coupled with an even worse performance in its manufacturing counterpart, are indicative of slowing U.S. economic activity – a theme that we anticipate will become a more entrenched in the third quarter. While the Fed will have to tread carefully with ongoing signals of an uptick in price pressures ahead, growth-related concerns are likely to dominate and should get the Fed moving when it comes to easing monetary policy, with market odds having increasingly positioned for a September rate cut following the weak July payrolls report.
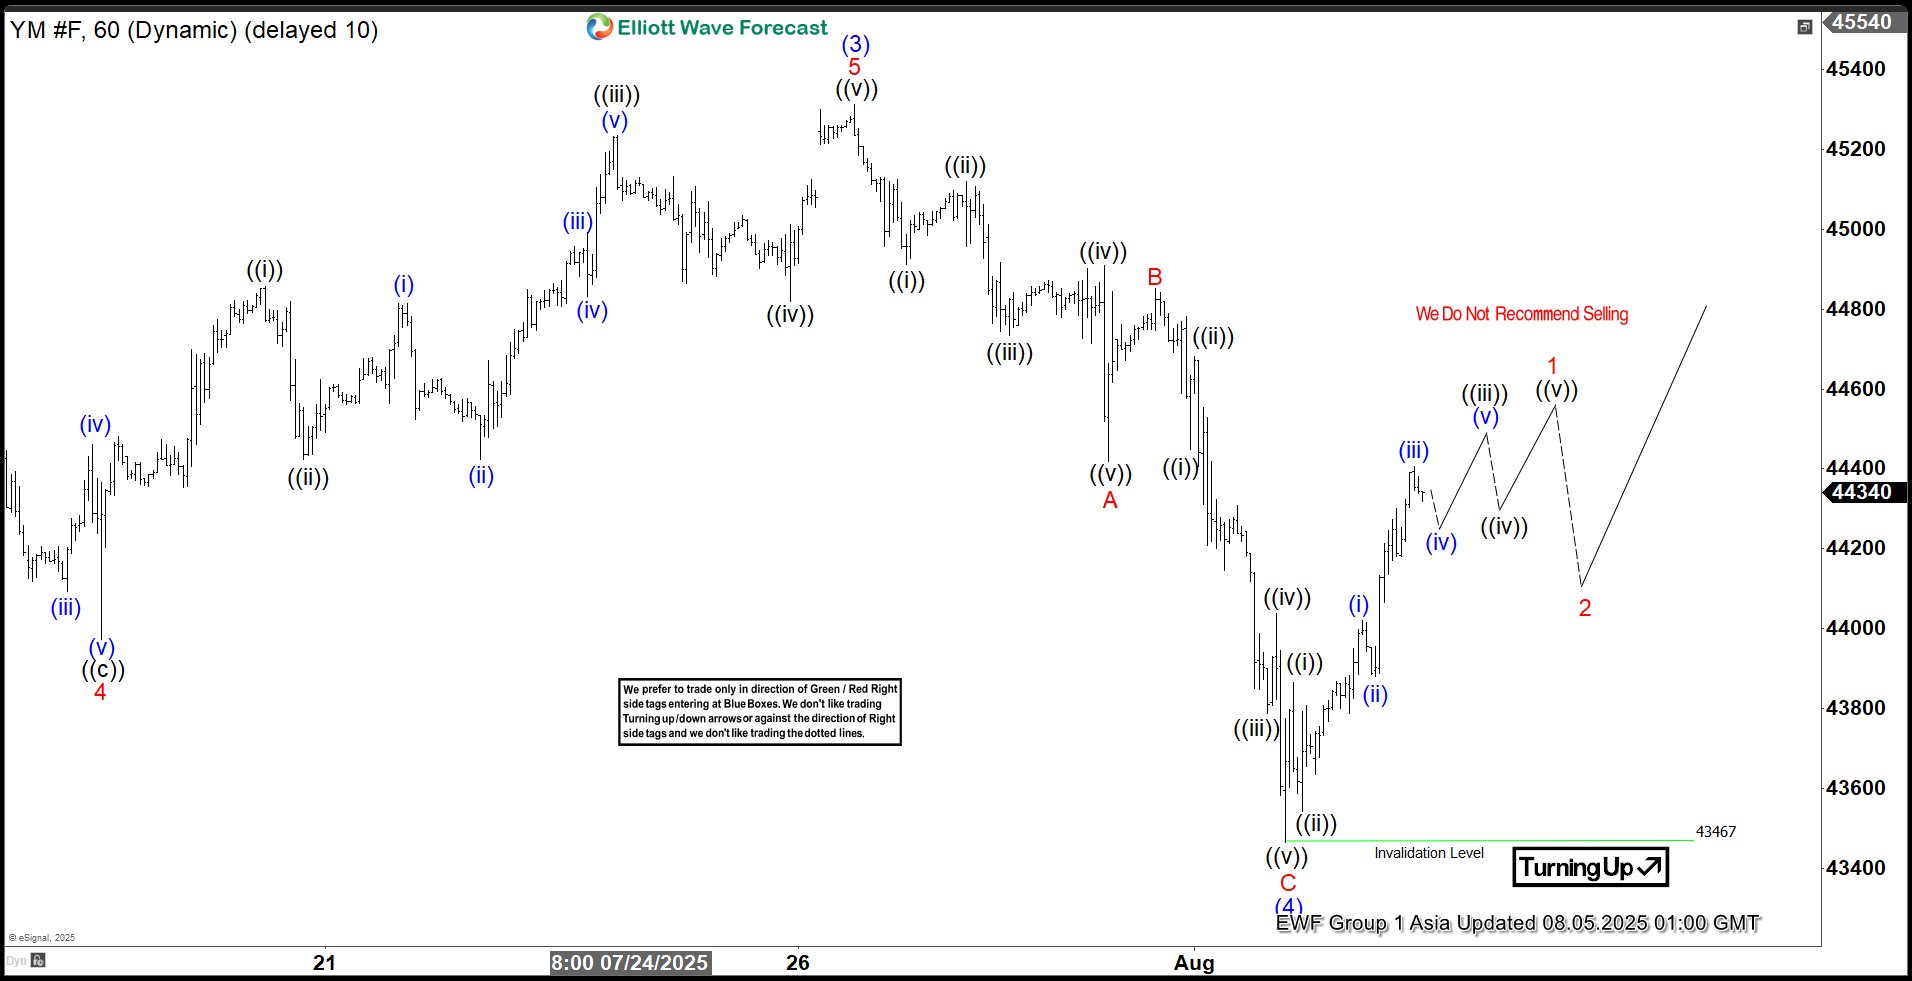
Elliott Wave Perspective: Dow Futures (YM) Nearing Final Push Before Significant Retreat
The Dow Futures (YM) cycle, initiated from the April 2025 low, has reached a mature phase and could conclude soon. We anticipate one final push higher to complete the impulsive cycle from that low. As shown on the one-hour chart, wave (3) of this impulse peaked at 45,312. The subsequent wave (4) pullback concluded at 43,467, forming a zigzag Elliott Wave structure. From wave (3), wave A dropped to 44,418, wave B rallied to 44,852, and wave C fell to 43,467, finalizing wave (4). The Index has since turned upward in wave (5), but it must surpass the wave (3) high of 45,312 to eliminate the possibility of a double correction.
Currently, wave (5) is unfolding as a lower-degree impulse. From wave (4), wave ((i)) reached 43,864, followed by a wave ((ii)) pullback to 43,542. The Index then advanced in wave ((iii)). From wave ((ii)), wave (i) hit 43,997, and wave (ii) corrected to 43,881. We expect a few more highs before wave 1 of (5) completes. A wave 2 pullback should follow, but the Index will likely resume its ascent afterward. As long as the pivot low at 43,467 holds, dips should attract buyers in 3, 7, or 11 swings, supporting further upside in the near term.
Dow Futures (YM) – 60-Minute Elliott Wave Technical Chart:
YM_F – Elliott Wave Technical Video:
https://www.youtube.com/watch?v=Hg0UbRNU6HE
XBR/USD Chart Analysis: Oil Price Declines Towards Key Support
As the XBR/USD chart shows, Brent crude oil has made two significant moves recently:
- Last week’s price increase (A) followed President Donald Trump’s intentions to impose tariffs on India due to its purchases of Russian oil. This could have disrupted established oil supply chains.
- The price decline (B) may have been driven by both the decision of OPEC+ countries to increase production and reports of a weakening US labour market.
Thus, there is reason to believe that the more than 4.5% decline in Brent crude oil prices since the beginning of August reflects market participants’ scepticism about sustained high oil prices:
→ this has a negative impact on the US economy (JP Morgan analysts raised concerns about recession risks this week);
→ increased activity from oil producers may offset supply chain disruption risks.
Technical Analysis of the XBR/USD Chart
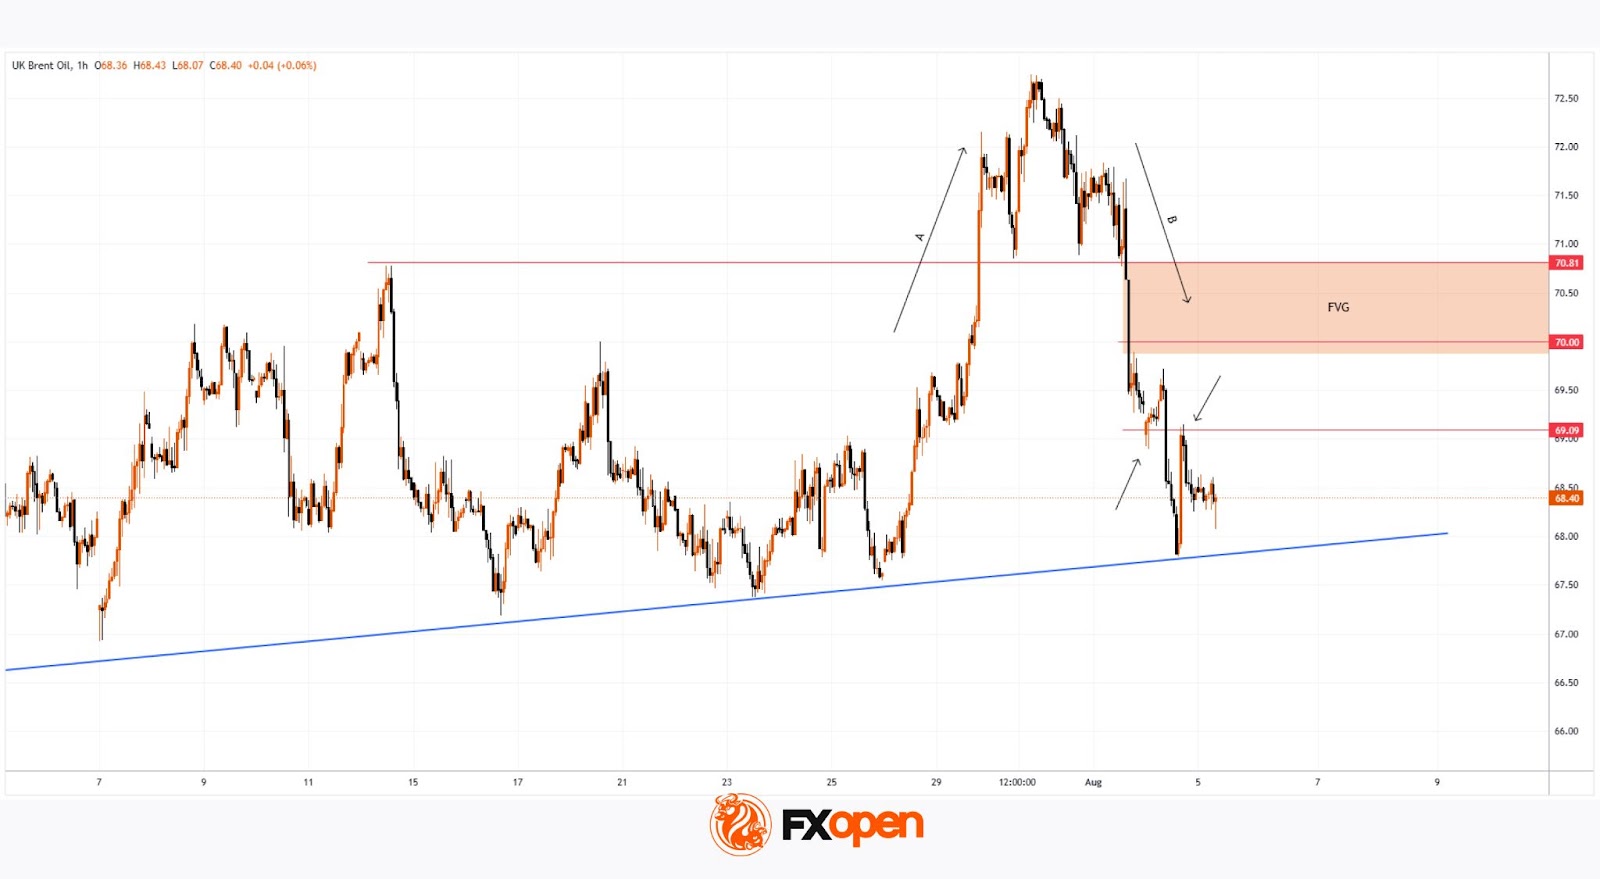
From a technical analysis perspective, Brent crude oil has dropped to a key support level (marked in blue), which was previously active in July. A rebound from this line could happen – in such a case, the price might face resistance at the Fair Value Gap area (marked in orange), formed between:
→ $70.81 – a support level active in late July, which was broken;
→ the psychological level of $70.00.
Attention should also be paid to price behaviour around the $69.00 level (indicated by arrows) – it quickly switched roles from support to resistance, indicating aggressive bearish sentiment. Given this observation, a potential bearish breakout attempt below the blue support line cannot be ruled out.
However, whether this scenario materialises will largely depend on developments in geopolitical risks and tariff agreements.
Start trading commodity CFDs with tight spreads. Open your trading account now or learn more about trading commodity CFDs with FXOpen.
This article represents the opinion of the Companies operating under the FXOpen brand only. It is not to be construed as an offer, solicitation, or recommendation with respect to products and services provided by the Companies operating under the FXOpen brand, nor is it to be considered financial advice.