
Sample Category Title
USD/JPY: Bulls Start to Lose Traction Ahead of Key Barriers But Still Hold Grip
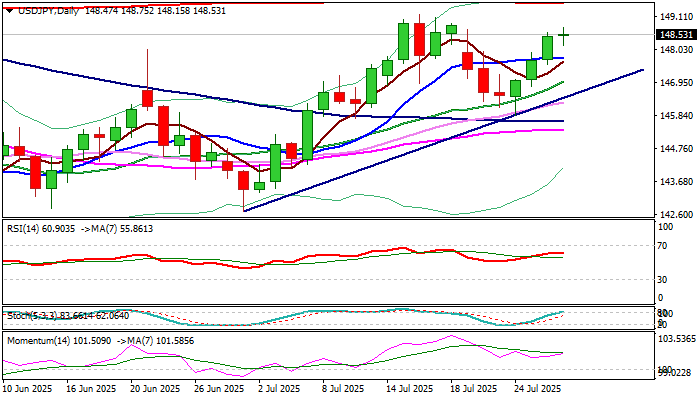
Strong rally in past three days started to run out of steam on Tuesday, as daily action was so far shaped in long-legged Doji candle that signals indecision.
Bulls show signs of fatigue after retracing over 76.4% of 149.18/145.85 bear-leg and hitting recovery high just under key near-term support at 149.18 (July 16 peak), where the rally faced headwinds.
Overbought daily Stochastic contributes to developing negative signals, but overall picture on daily chart remains firmly bullish, suggesting that consolidation or shallow correction may precede fresh push higher, with probe through 149.18 and 149.53 (200DMA) to expose psychological 150 barrier.
Dips should ideally find support at 147.70/50 zone (10DMA / Fibo 38.2% of 145.85/148.75 upleg) to mark a healthy correction and keep bulls intact.
Res: 148.75; 149.18; 149.53; 150.00.
Sup: 148.06; 147.65; 147.50; 147.30.
Pound Falls to 9-Week Low, UK Food Inflation Jumps
The British pound is down for a fourth straight day, as the US dollar is showing strength against most of the majors. The pound has declined 1.5% in the current slide.
In the European session, GBP/USD is trading at 1.3338, down 0.10% on the day. The pound fell as low as 1.3315 earlier, its lowest level since May 19.
UK food inflation rises
UK inflation has been going up, so it was no surprise that the British Retail Consortium (BRC) Shop Price Index jumped 0.7% in July, up sharply from 0.4% in June and above the forecast of 0.2%.
Food inflation rose for a six consecutive month, rising 4.0% y/y in July, up from 3.7% in June. The driver of the increase was a rise in the cost of meat and tea. The increase in food prices helped boost UK inflation, which climbed to 3.6% y/y in June from 3.4% in May.
Consumers are being squeezed by rising inflation and high interest rates and are responding by holding tighter on the purse strings. The Confederation of British Industry (CBI) reported today that retail sales volumes continue to fall sharply, with a reading of -34 in July. This was an improvement from -46 in June but missed the forecast of -28.
Despite the fact that inflation is moving the wrong way, the markets expect that the Bank of England will lower interest rates next month. The central bank wants to trim the current cash rate of 4.25% and boost the economy, but the upward risk of inflation remains a headache for BoE policymakers who don't want to see inflation continue to move away from the Bank's 2% target.
GBP/USD Technical
- GBP/USD is putting pressure on support at 1.3337. This is followed by support at 1.3321
- There is resistance at 1.3359 and 1.3375
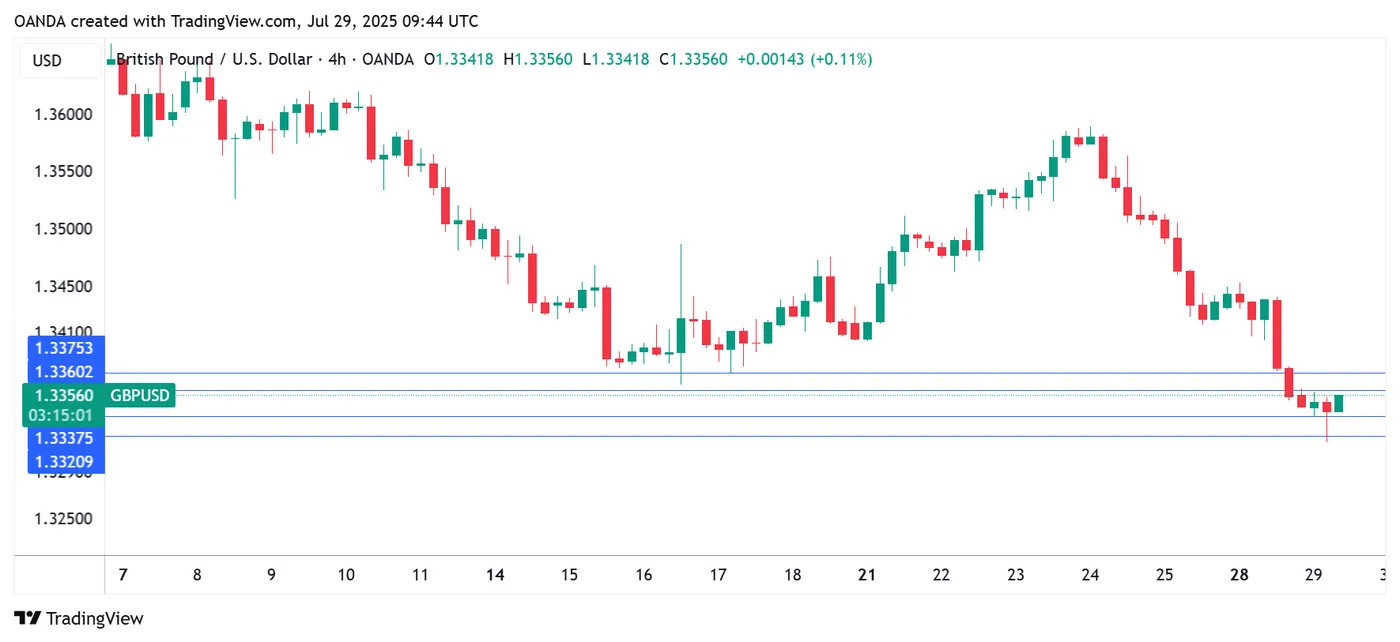
GBPUSD 4-Hour Chart, July 29, 2025
Ethereum continues attempt to climb above $4,000
Market Overview
The crypto market lost 1%, falling back to a capitalisation of $3.9 trillion. This was a natural pullback against the backdrop of the dollar’s impressive strengthening the day before. However, on Tuesday, the bulls were back in charge, bringing the market back to a level above Monday’s opening but not yet reaching its peak.
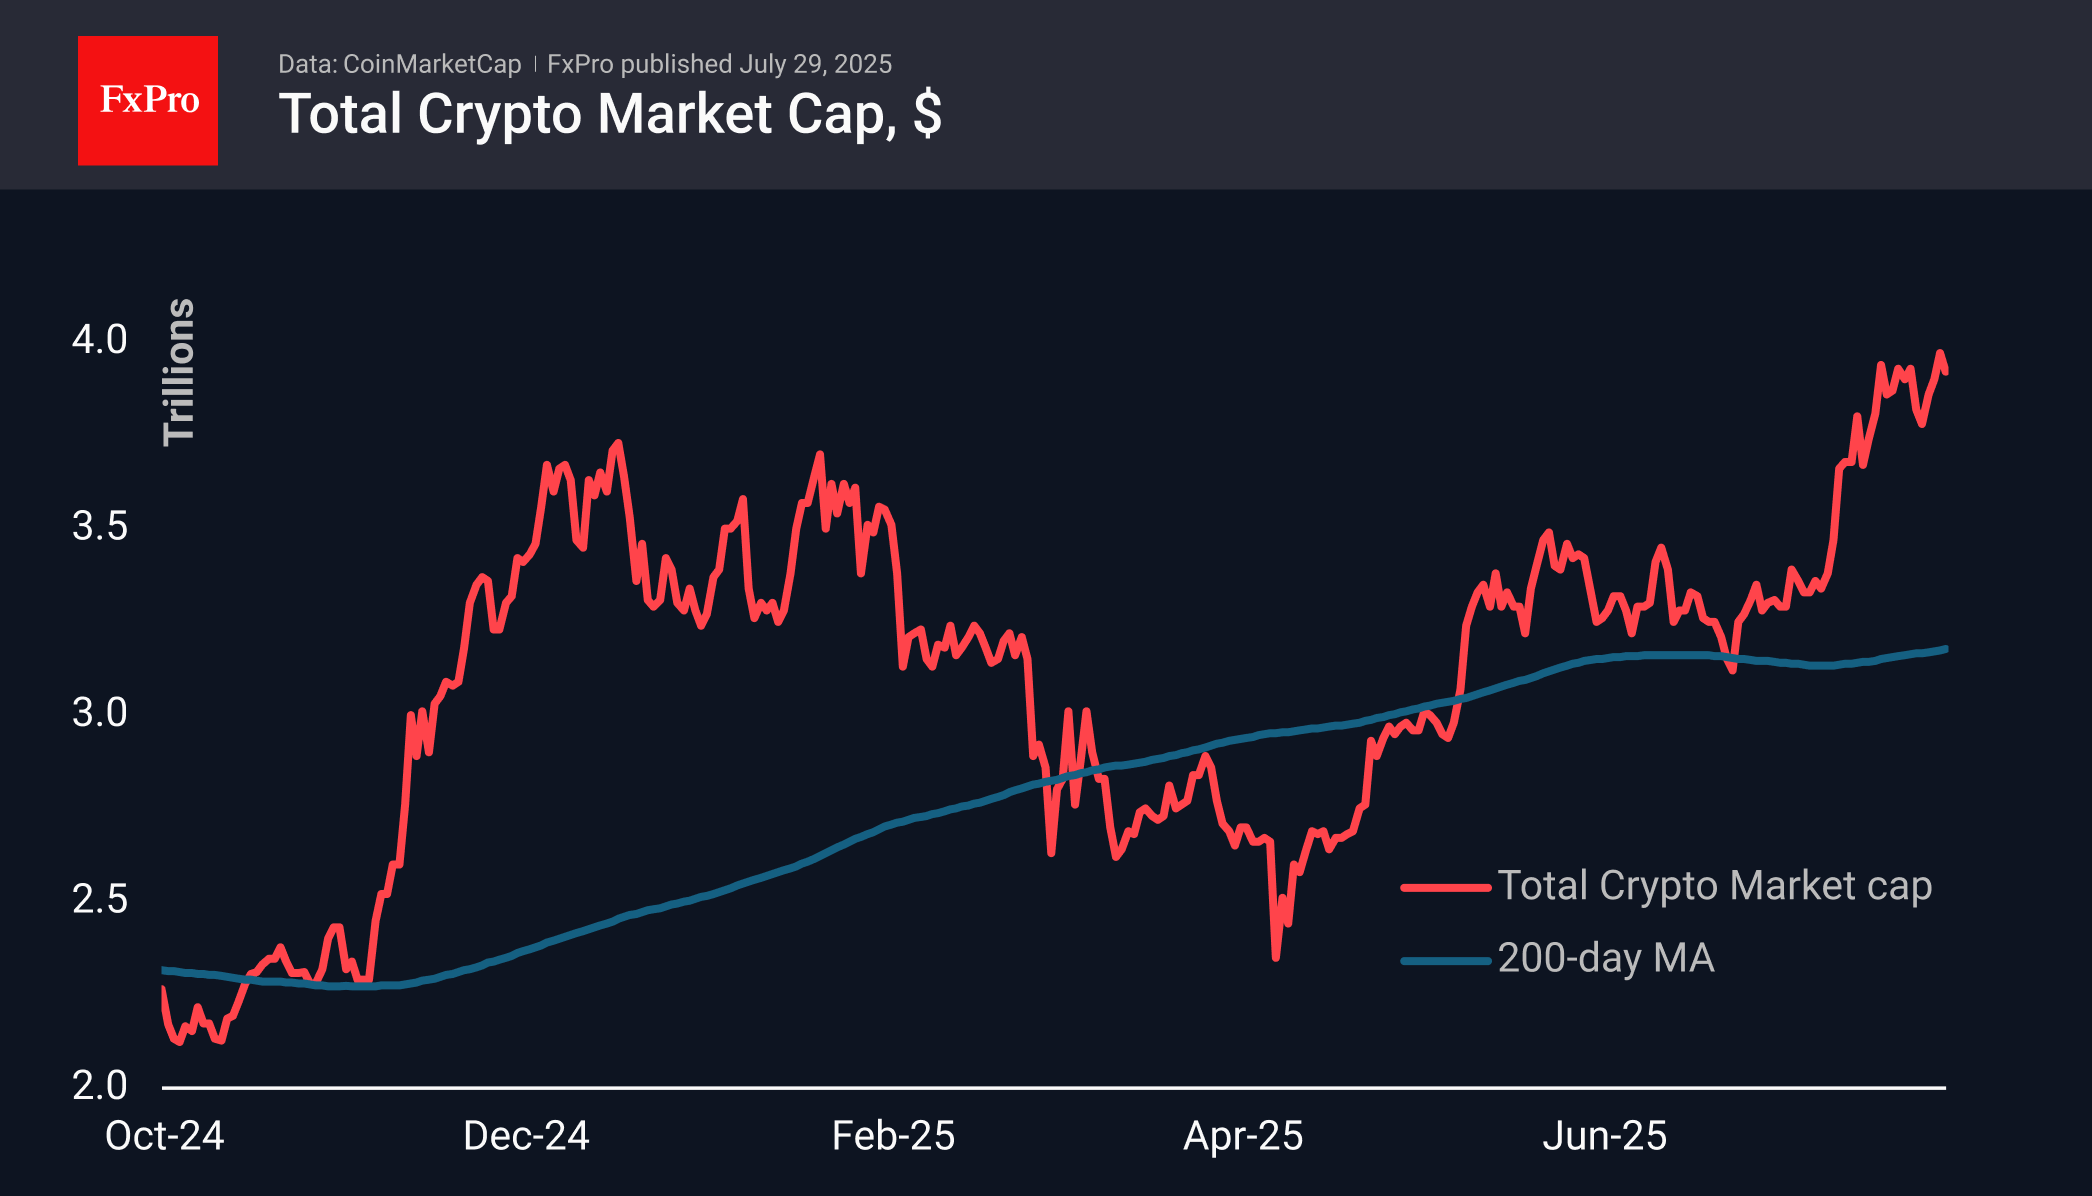
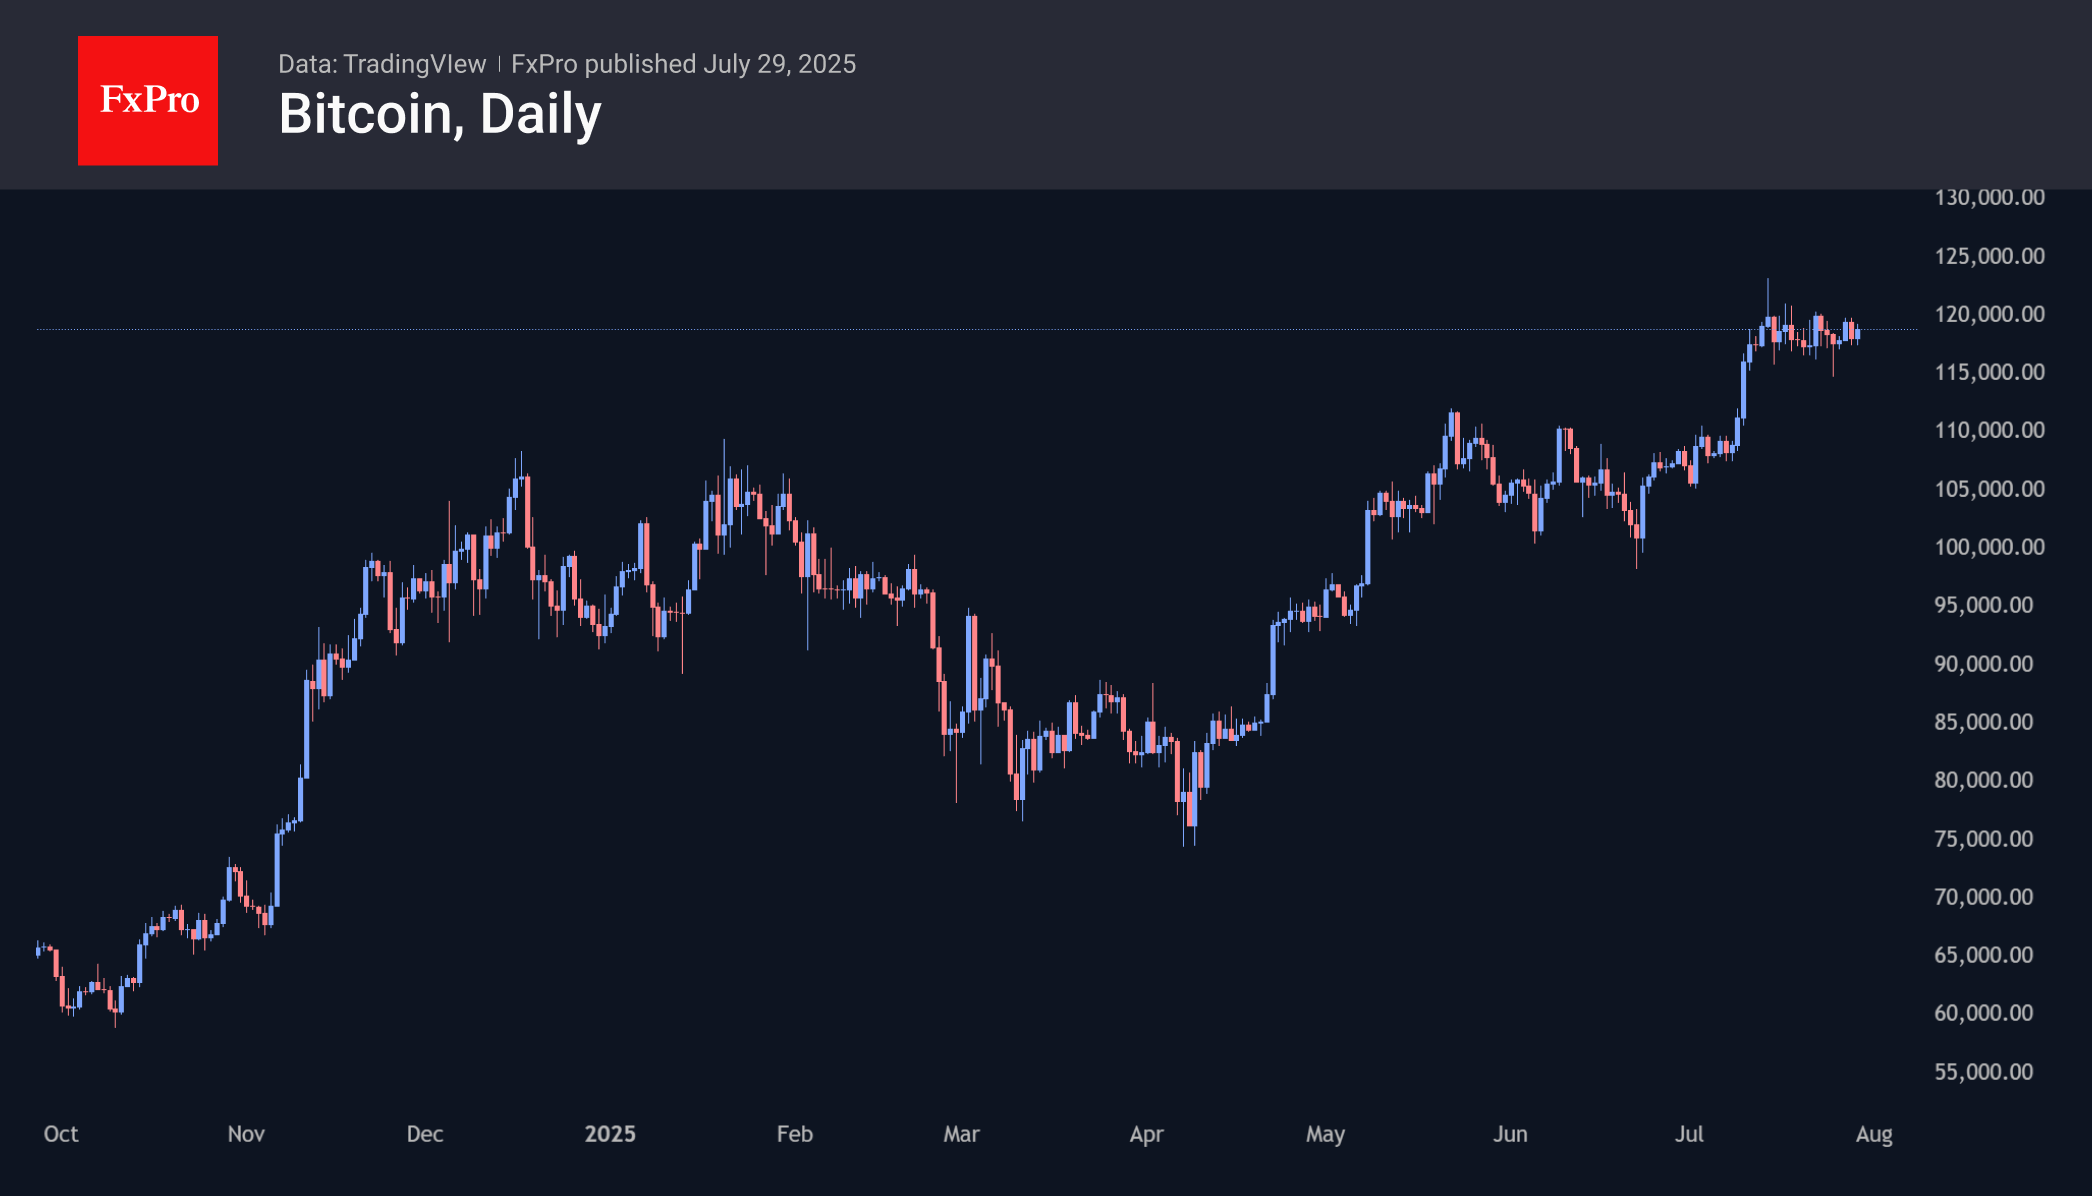
Bitcoin is trading near $118.7K, unable to break through the resistance at $120K. This indecision to break out of the range is likely to continue until the market sees the Fed’s key rate decision on Wednesday evening.
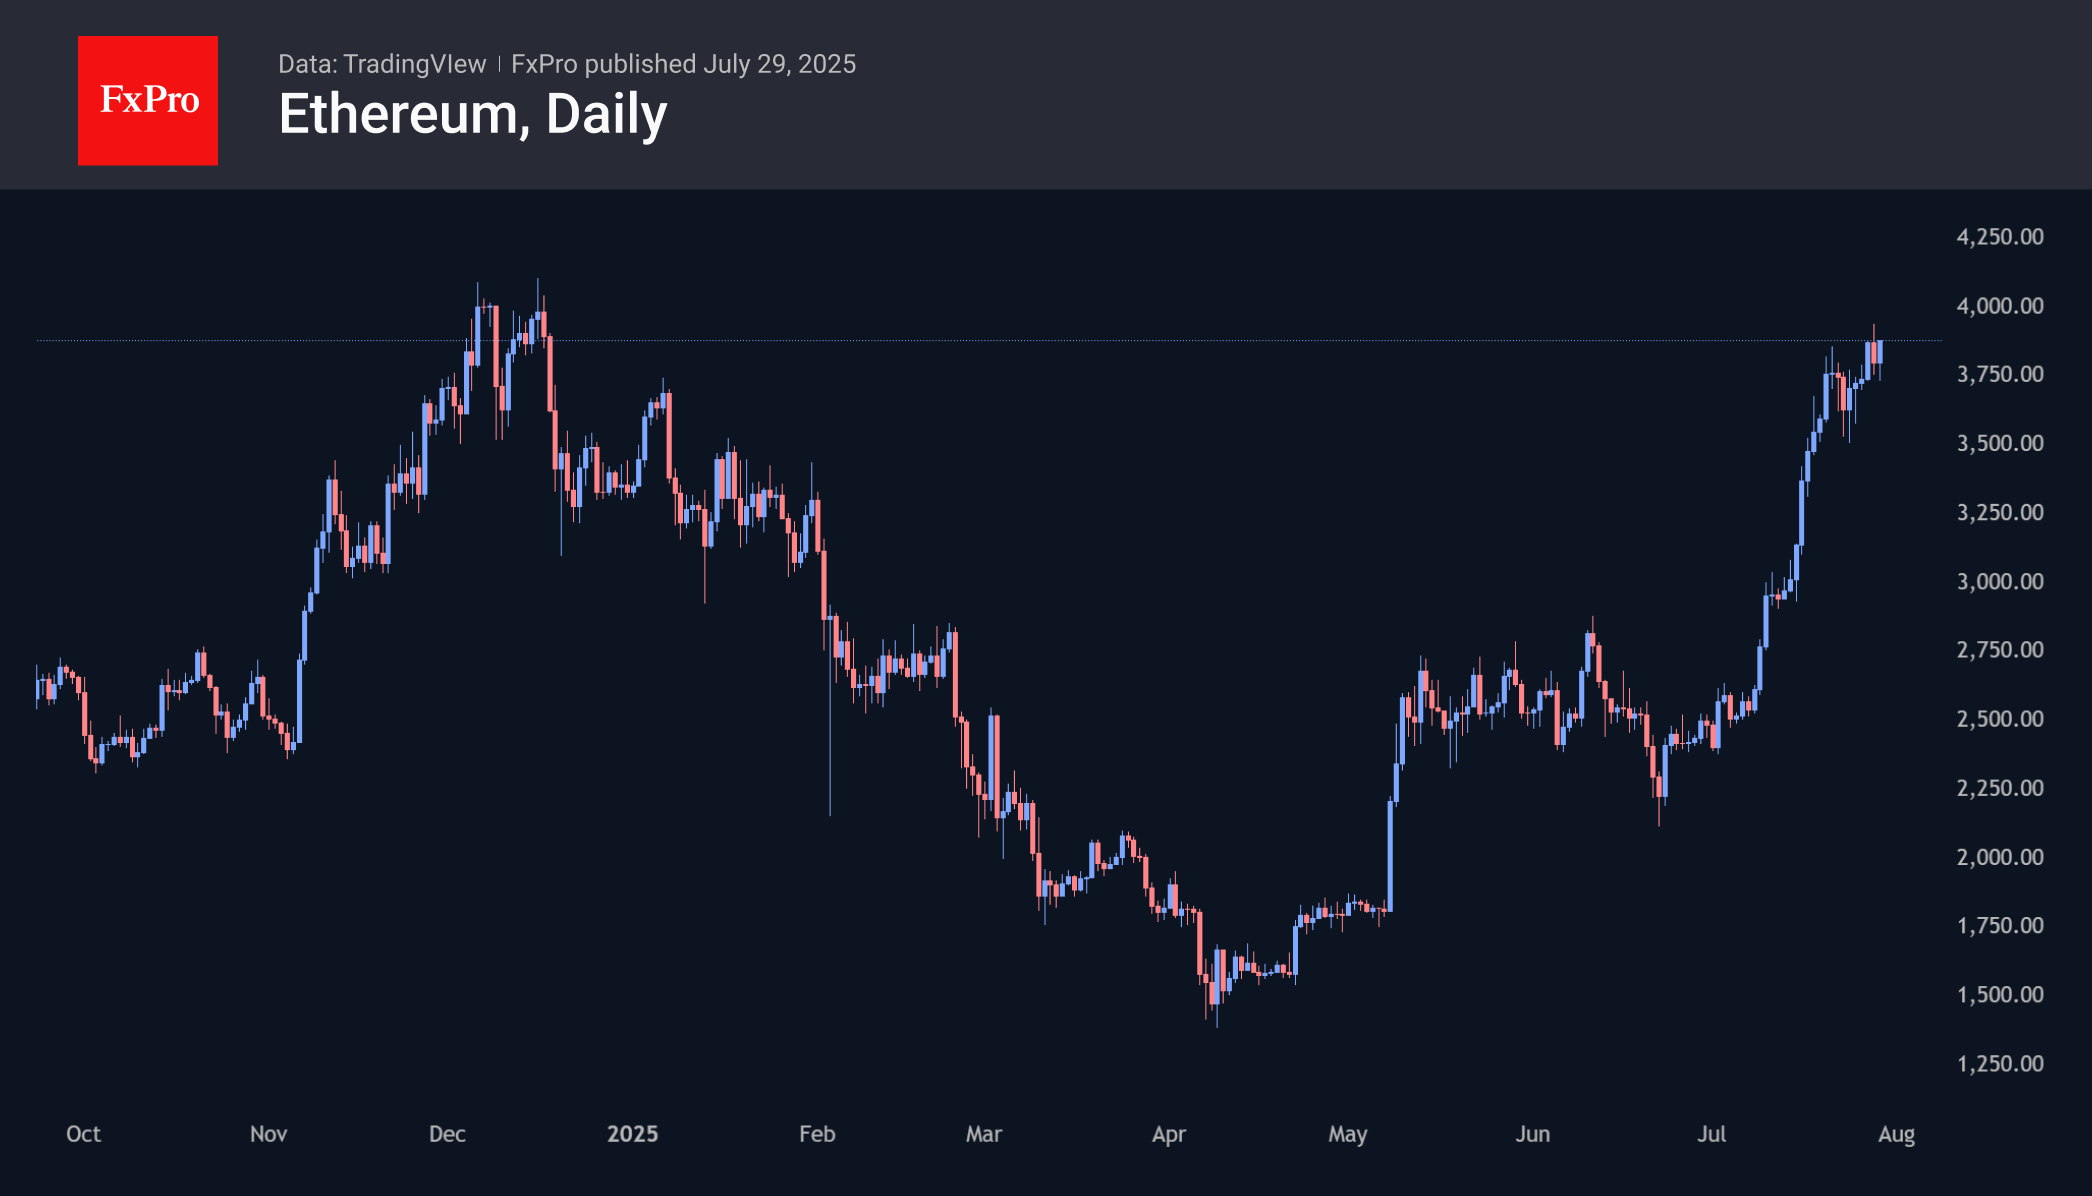
Ethereum rose to $3,930 at the end of the day, fell back to $3,700 on Monday, where it found interest from new buyers and rose to $3,830 at the time of writing. The last seven days have seen a fairly sharp upward trend, and if this trend continues, the price will rise above $4,000 by the end of this week.
News Background
According to CoinShares, global investment inflows into crypto funds last week amounted to $1.908 billion. Investments in Ethereum increased by $1.595 billion, Solana by a significant $312 million, XRP by $190 million, and Sui by $8 million. Investments in Bitcoin decreased by $175 million.
Japan’s Metaplanet announced the acquisition of 780 BTC ($92.5 million) at an average price of $118,600. The company’s total reserves now amount to 17,132 BTC, worth over $2 billion.
According to Blockware, Bitcoin will no longer show ‘parabolic’ rallies or ‘devastating’ bear cycles, as institutional investors have changed the market dynamics and reduced volatility.
According to Strategic ETH Reserve, the volume of the second cryptocurrency on the balance sheets of public companies has reached 2.32 million ETH (~$9.11 billion) — 1.92% of the total Ethereum supply. Bitmine Immersion Tech, associated with Fundstrat founder Tom Lee, pursues the most aggressive strategy. The company has ~566,800 ETH ($2.23 billion) on its balance sheet.
BNB, the fifth-largest cryptocurrency by capitalisation, updated its historical high above $860 on Monday. Against this background, Binance founder Changpeng Zhao’s estimated fortune exceeded $76 billion. According to Forbes, Zhao owns 64% of the BNB supply — about 89.1 million tokens.
US Dollar Index (DXY) Reaches One-Month High
The US Dollar Index (DXY) has risen to its highest level since early July. According to media reports, the bullish sentiment in the market is driven by the following factors:
→ Optimism around US trade agreements. A new trade deal with the EU — which includes a 15% tariff on European goods — is being perceived by the market as favourable for the United States.
→ Confidence in the resilience of the US economy. Strong Q2 corporate earnings have acted as an additional bullish catalyst. Investors may have started covering short positions against the dollar, viewing concerns over a US slowdown as overstated.
→ Expectations that the Federal Reserve will keep interest rates on hold.
From a technical standpoint, today’s DXY chart reflects strengthening bullish momentum.
Technical Analysis of the DXY Chart
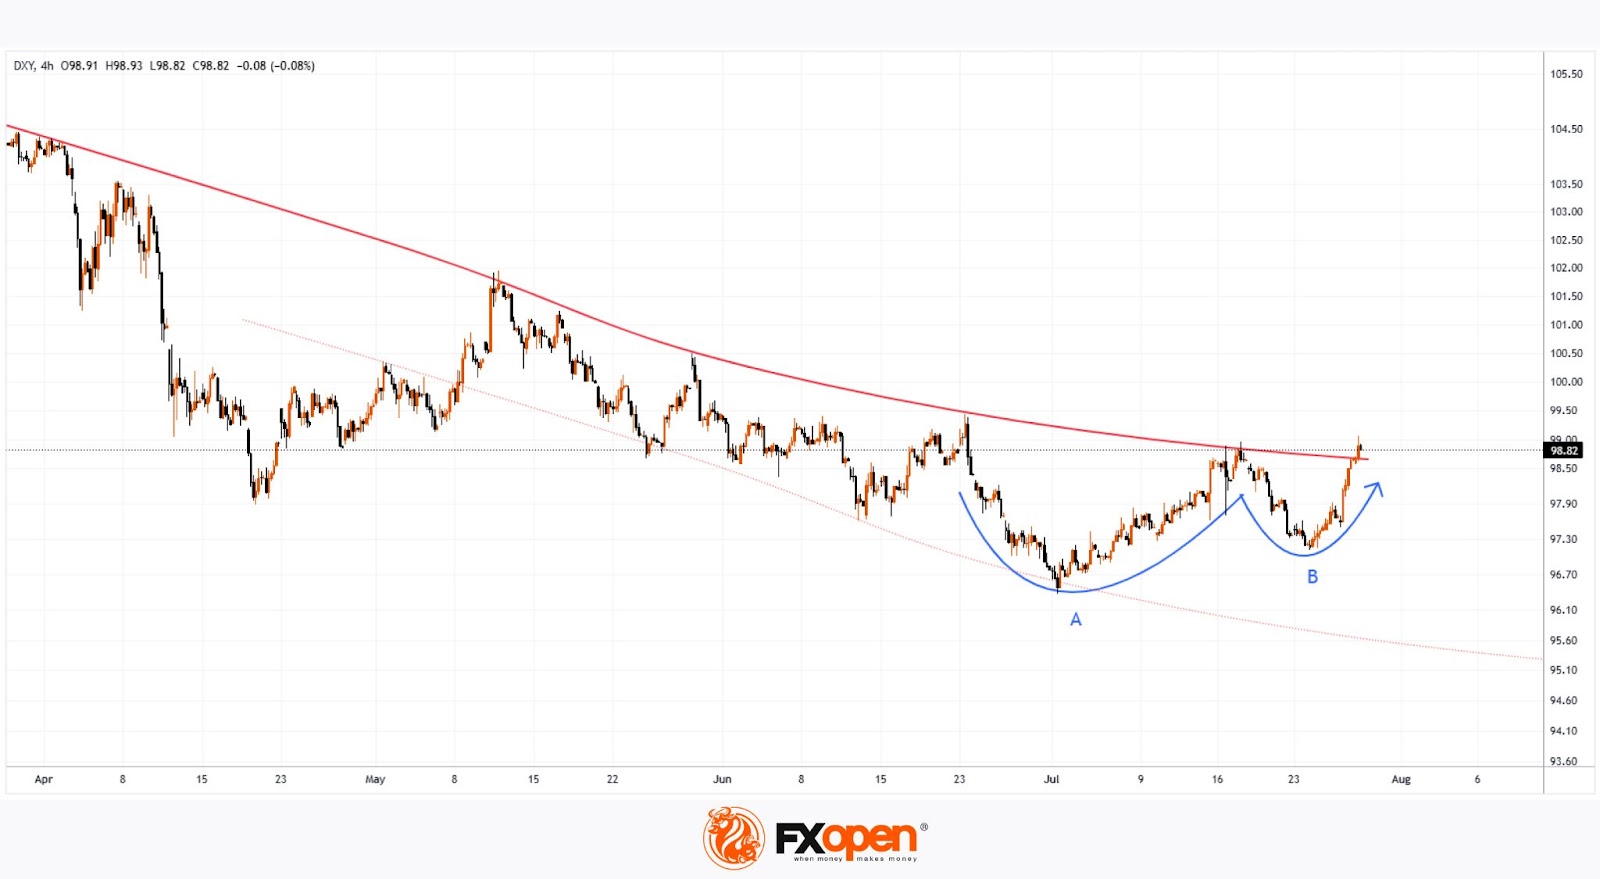
Two U-shaped formations (A and B) that developed over the summer have created a bullish сup and рandle pattern — a formation that suggests waning bearish pressure, as evidenced by the shallower second dip.
This setup points to the potential for a bullish breakout above the trendline (marked in red) that has defined the downward movement in the DXY throughout the first half of 2025.
As previously analysed, there are signs that the dollar index may have found a base following a period of decline. This could indicate a shift in market sentiment and the possible end of the recent bearish phase.
Trade global index CFDs with zero commission and tight spreads. Open your FXOpen account now or learn more about trading index CFDs with FXOpen.
This article represents the opinion of the Companies operating under the FXOpen brand only. It is not to be construed as an offer, solicitation, or recommendation with respect to products and services provided by the Companies operating under the FXOpen brand, nor is it to be considered financial advice.
EUR/USD Under Seller Control: The Deal’s Consequences Could Be Severe
The EUR/USD pair tumbled to 1.1579 by Tuesday, marking its sharpest intraday decline since 6 November last year.
The euro’s plunge followed the announcement of a new trade agreement between the US and the European Union, which imposes a 15% tariff on most European goods – a move set to significantly benefit the American economy.
European leaders reacted fiercely. France condemned the deal as one-sided, while German Chancellor Merz warned of serious risks to domestic industry. In response, Donald Trump reiterated that countries unwilling to negotiate bilateral agreements could face tariffs of 15–20%, up from the 10% rate in April.
Attention now turns to the US Federal Reserve’s July meeting, which concludes on Wednesday evening. While no rate change is expected, traders will scrutinise signals of a potential September cut, especially amid mounting White House pressure and trade-related uncertainties.
Key US economic data due this week – including the Core PCE Price Index and Nonfarm Payrolls report – will offer further clues on inflation and the Fed’s policy trajectory.
Technical Analysis: EUR/USD
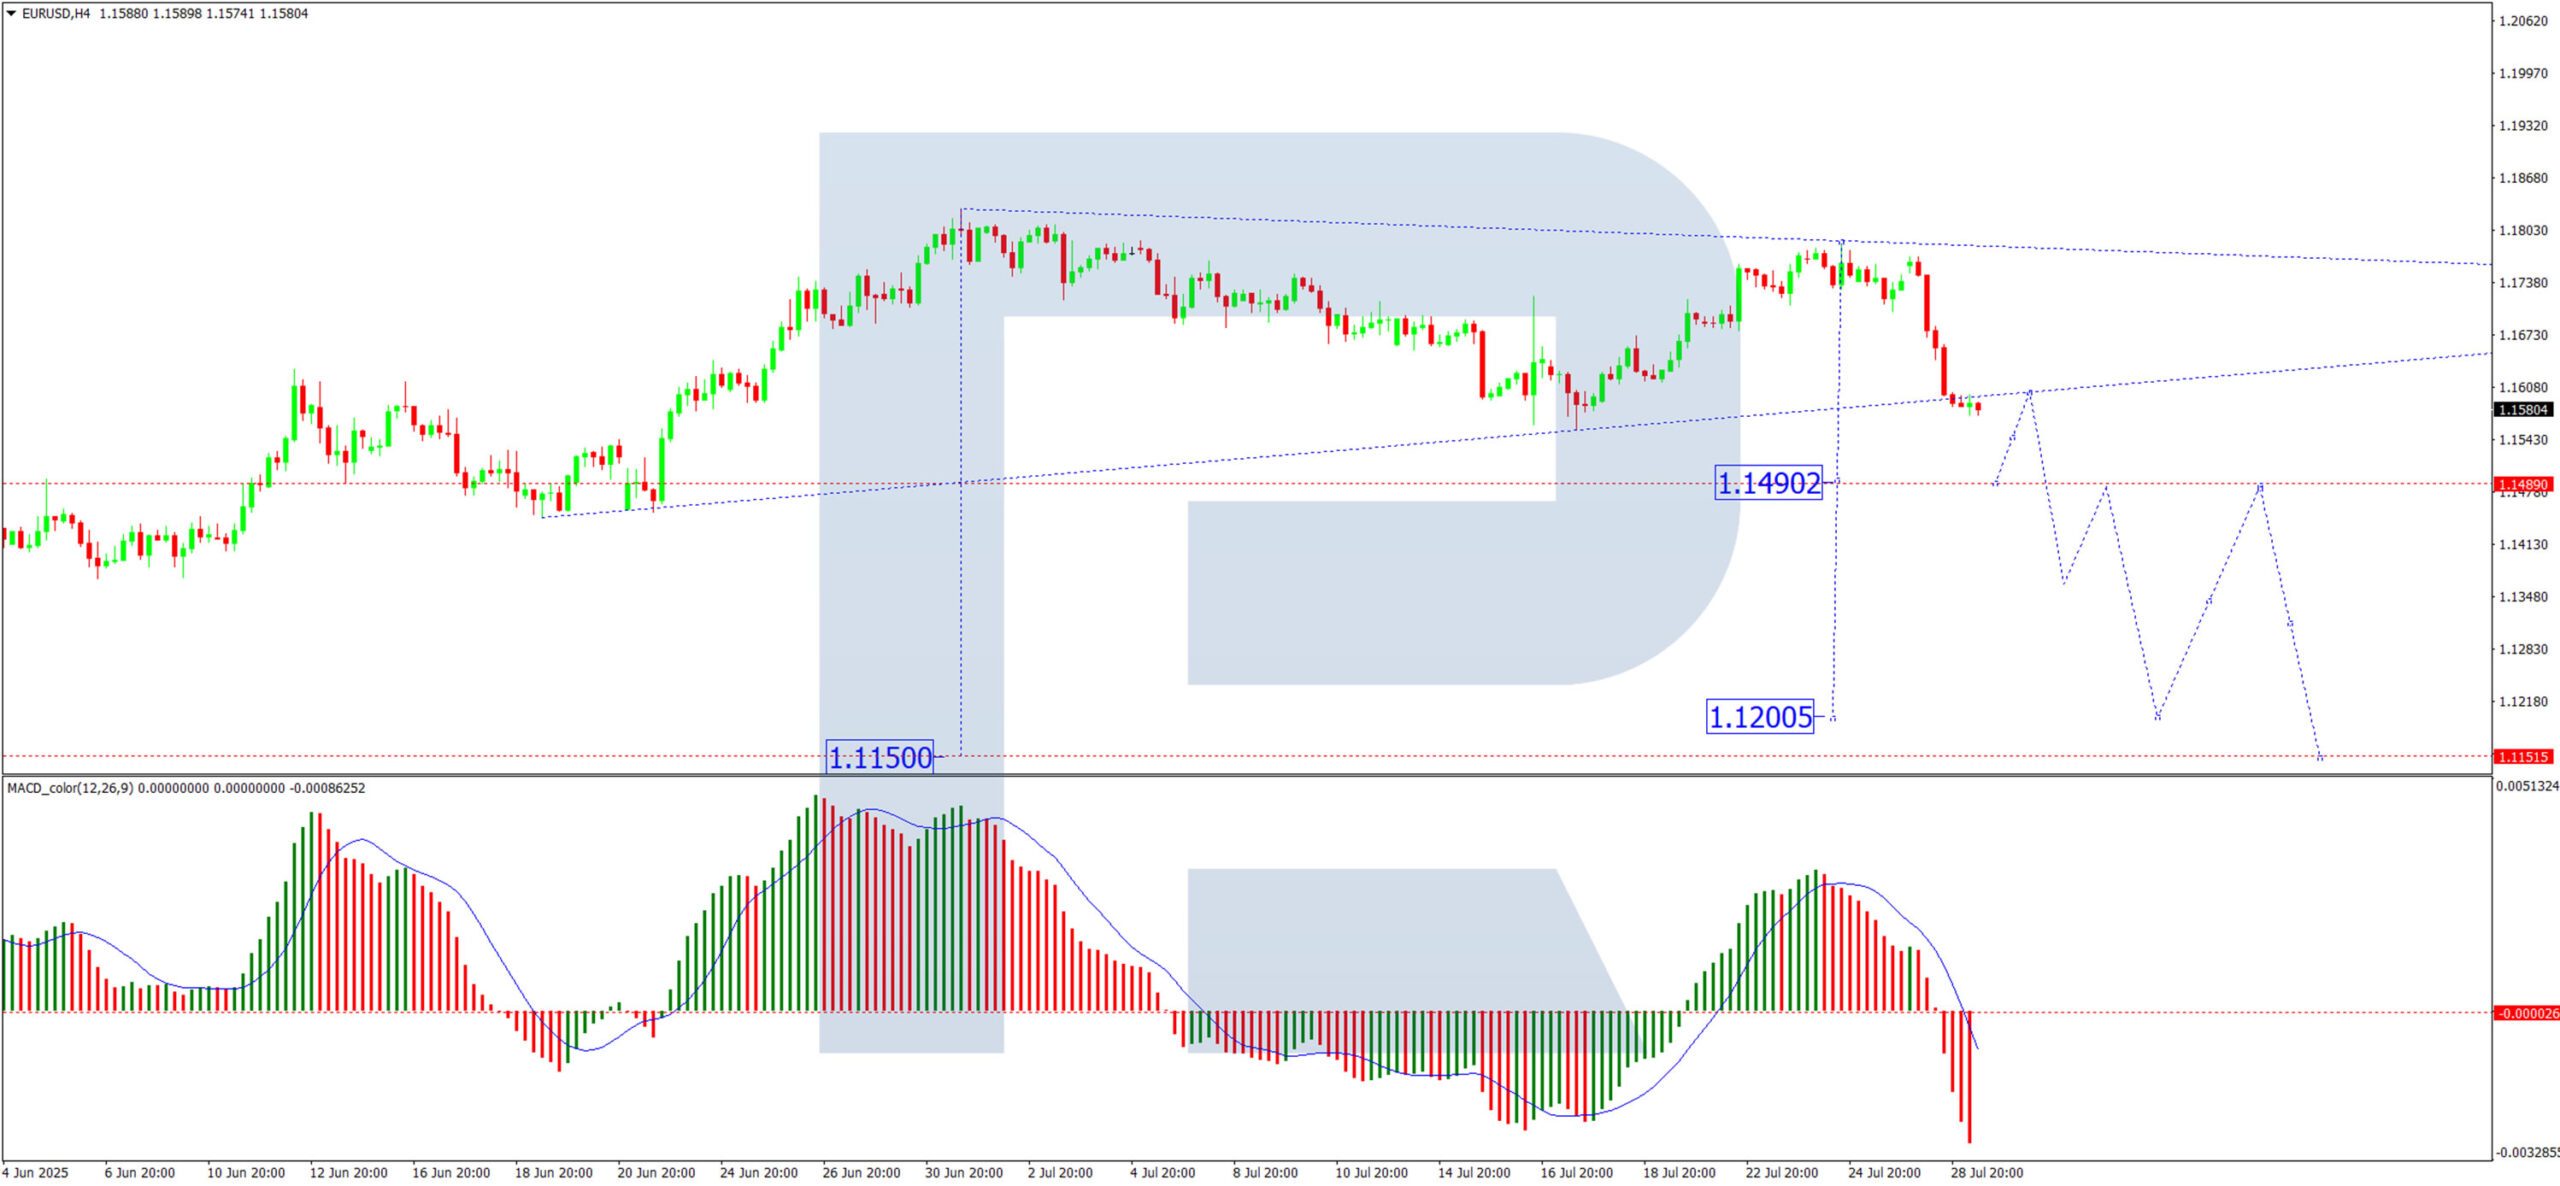
H4 Chart:
The EUR/USD pair has been consolidating within a symmetrical triangle pattern, typically a reversal formation. The price has now broken below the 1.1590 support, approaching the pattern’s lower boundary. A confirmed breakdown could lead to a decline towards 1.1490, with 1.1200 as a potential medium-term target.
The MACD indicator reinforces this bearish outlook, with its signal line below zero and pointing sharply downward, suggesting sustained selling pressure.
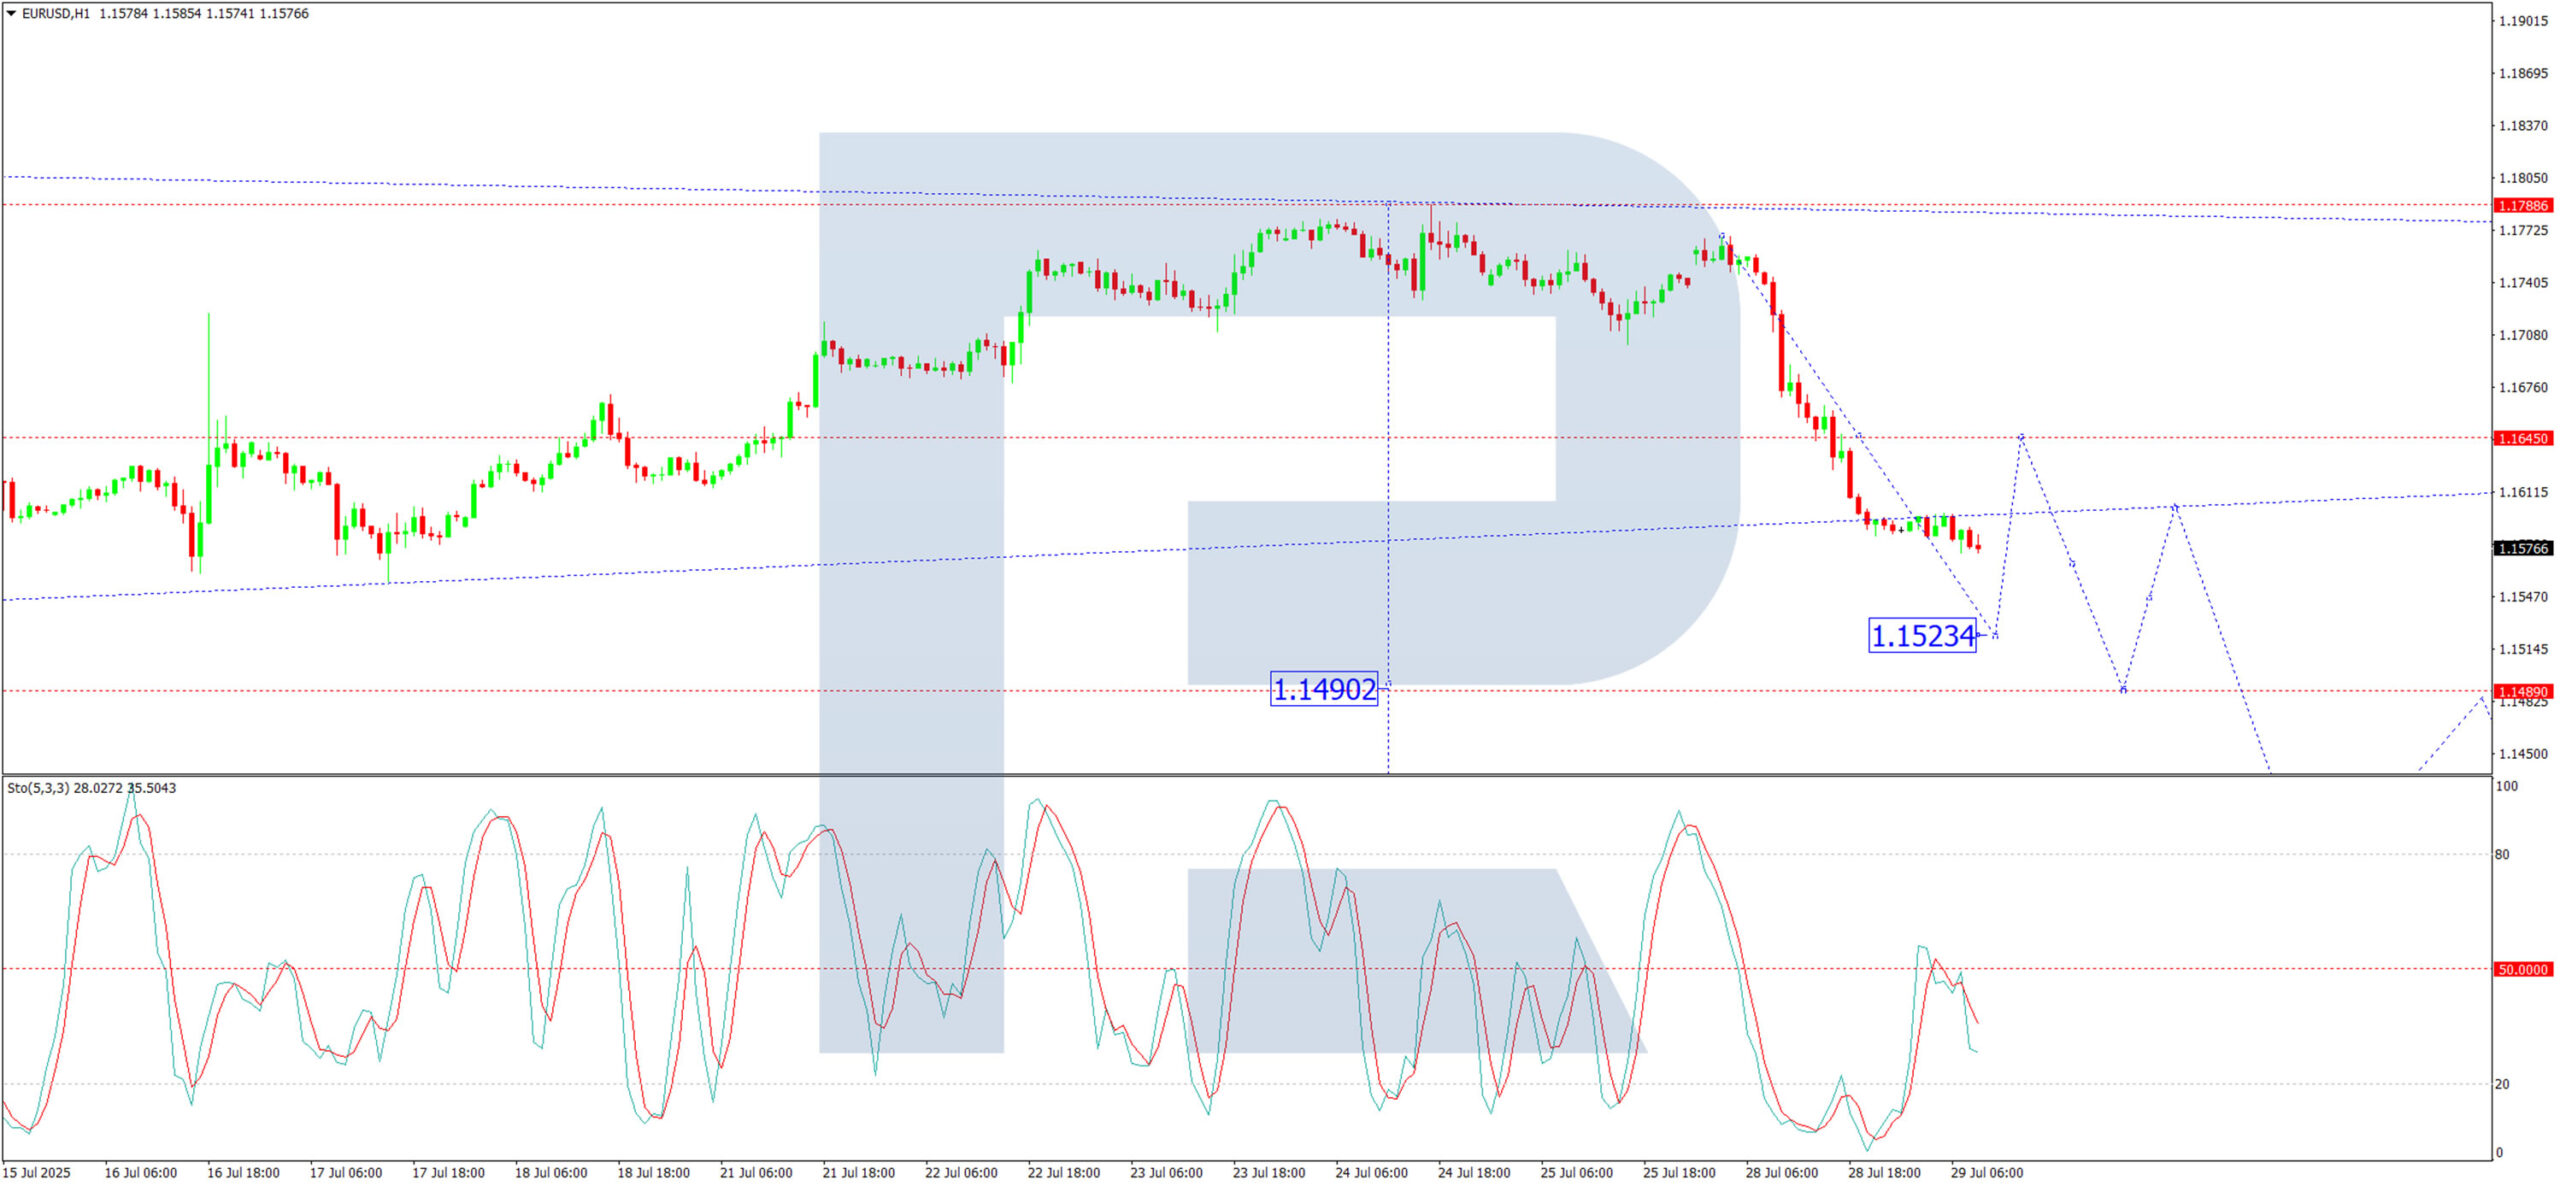
H1 Chart:
On the hourly chart, the pair had been range-bound near 1.1645 before breaking lower, extending its downward move towards 1.1523. A pullback to retest 1.1645 (now as resistance) remains possible before any further downside.
Beyond that, the bearish trend is likely to resume, with 1.1490 acting as the next key support. The Stochastic oscillator aligns with this scenario, as its signal line is below 50 and is trending downward towards 20, indicating strengthening bearish momentum.
Conclusion
Sellers remain firmly in control, with fundamental and technical factors both favouring further downside. A break below 1.1590 could accelerate losses, while key US data and Fed rhetoric this week may dictate near-term volatility.
Nasdaq 100 Index Hits New Highs Ahead of Big Tech Earnings
Earlier, we noted signs of optimism in the Nasdaq 100 index (US Tech 100 mini on FXOpen) as the market anticipated earnings reports from major tech firms.
Now, companies such as Alphabet (GOOGL) and Tesla (TSLA) have already released their results (we previously covered their charts → here and here). Up next are the most highly anticipated earnings reports: this week, tech giants including Microsoft (MSFT), Amazon (AMZN), Meta Platforms (META), and Apple (AAPL) are set to publish their results. The combined market capitalisation of these four companies exceeds $11 trillion, and their reports could have a significant impact on a stock market that is already showing strong bullish sentiment:
→ The Nasdaq 100 index (US Tech 100 mini on FXOpen) has climbed to an all-time high, surpassing the 23,400 mark.
→ The signing of trade agreements between the US and Europe (and earlier, Japan) has eased concerns about the negative impact of tariff barriers.
Technical Analysis of Nasdaq 100 (US Tech 100 mini on FXOpen)
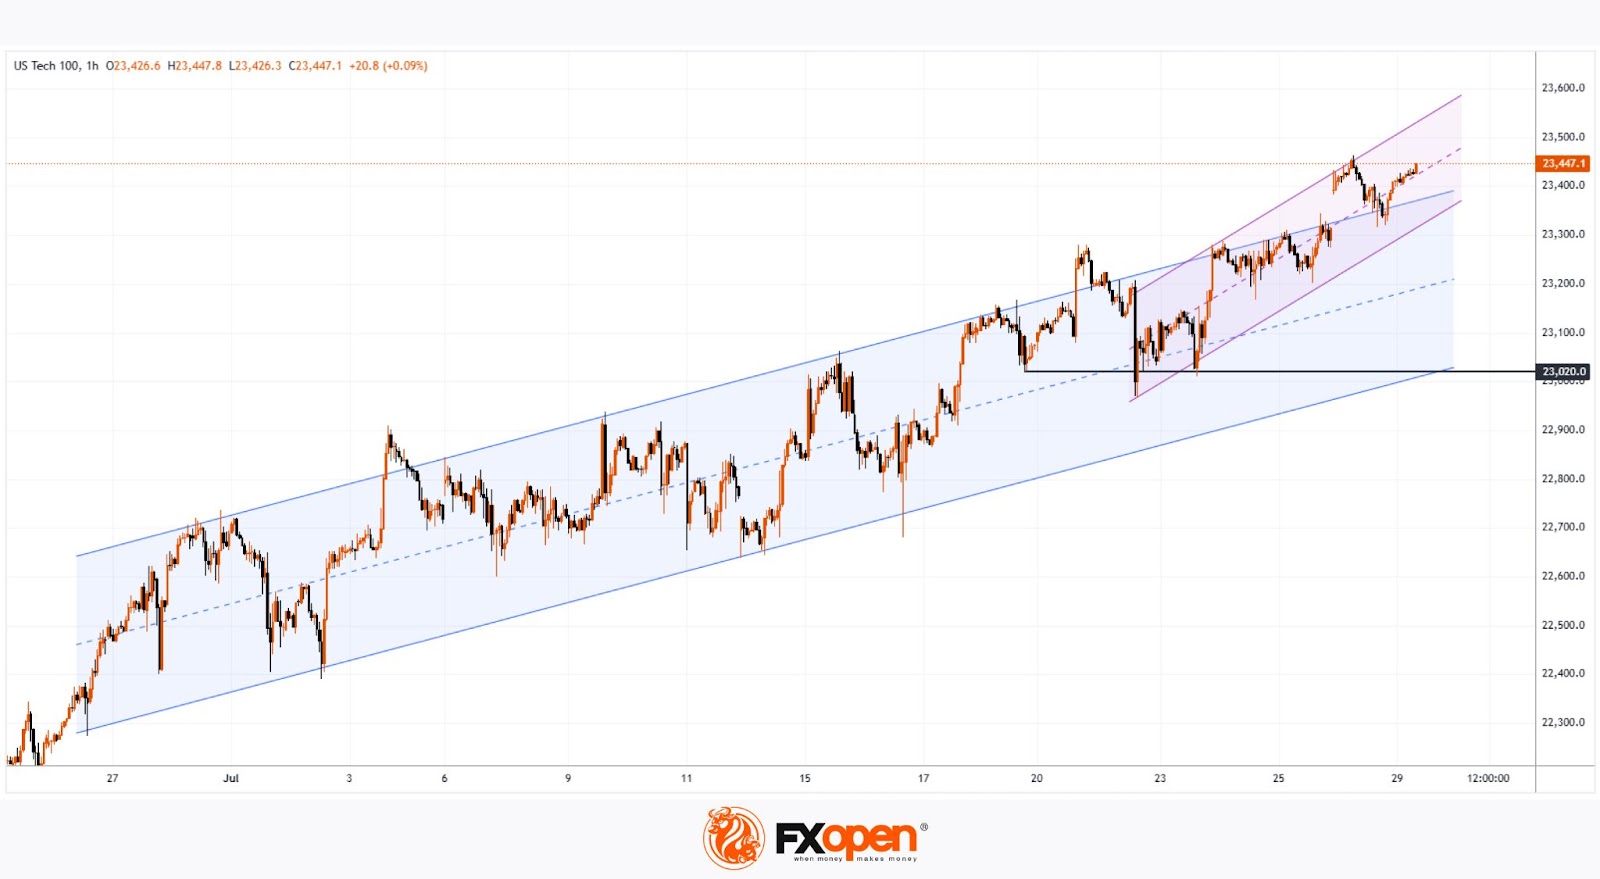
The chart supports growing signs of optimism: earlier in July, the price remained within a rising channel (marked in blue). However, towards the end of the month, price action has begun to follow a steeper upward trajectory (marked in purple).
What could happen next? Much will depend on the earnings results and forward guidance from these tech giants.
On the one hand, continued enthusiasm around AI adoption could accelerate further growth. The stronger the optimism, the more fuel it may add to discussions around a potential bubble — with some analysts already drawing parallels to the dot-com era of the early 2000s.
On the other hand, earnings could temper market excitement and prompt a correction. For example, the index may retreat to the support level around 23,020, which is reinforced by the lower boundary of the blue trend channel.
Trade global index CFDs with zero commission and tight spreads. Open your FXOpen account now or learn more about trading index CFDs with FXOpen.
This article represents the opinion of the Companies operating under the FXOpen brand only. It is not to be construed as an offer, solicitation, or recommendation with respect to products and services provided by the Companies operating under the FXOpen brand, nor is it to be considered financial advice.
EUR/USD Bulls Take a Back Seat
- EURUSD uptrend shows cracks; bears push for a lower low.
- Technical signals point to further weakness; close below 1.1550 needed.
EURUSD drifted lower on Monday as investors reacted to the US-EU trade deal and growing concerns that the agreement may be less beneficial for the Eurozone economy.
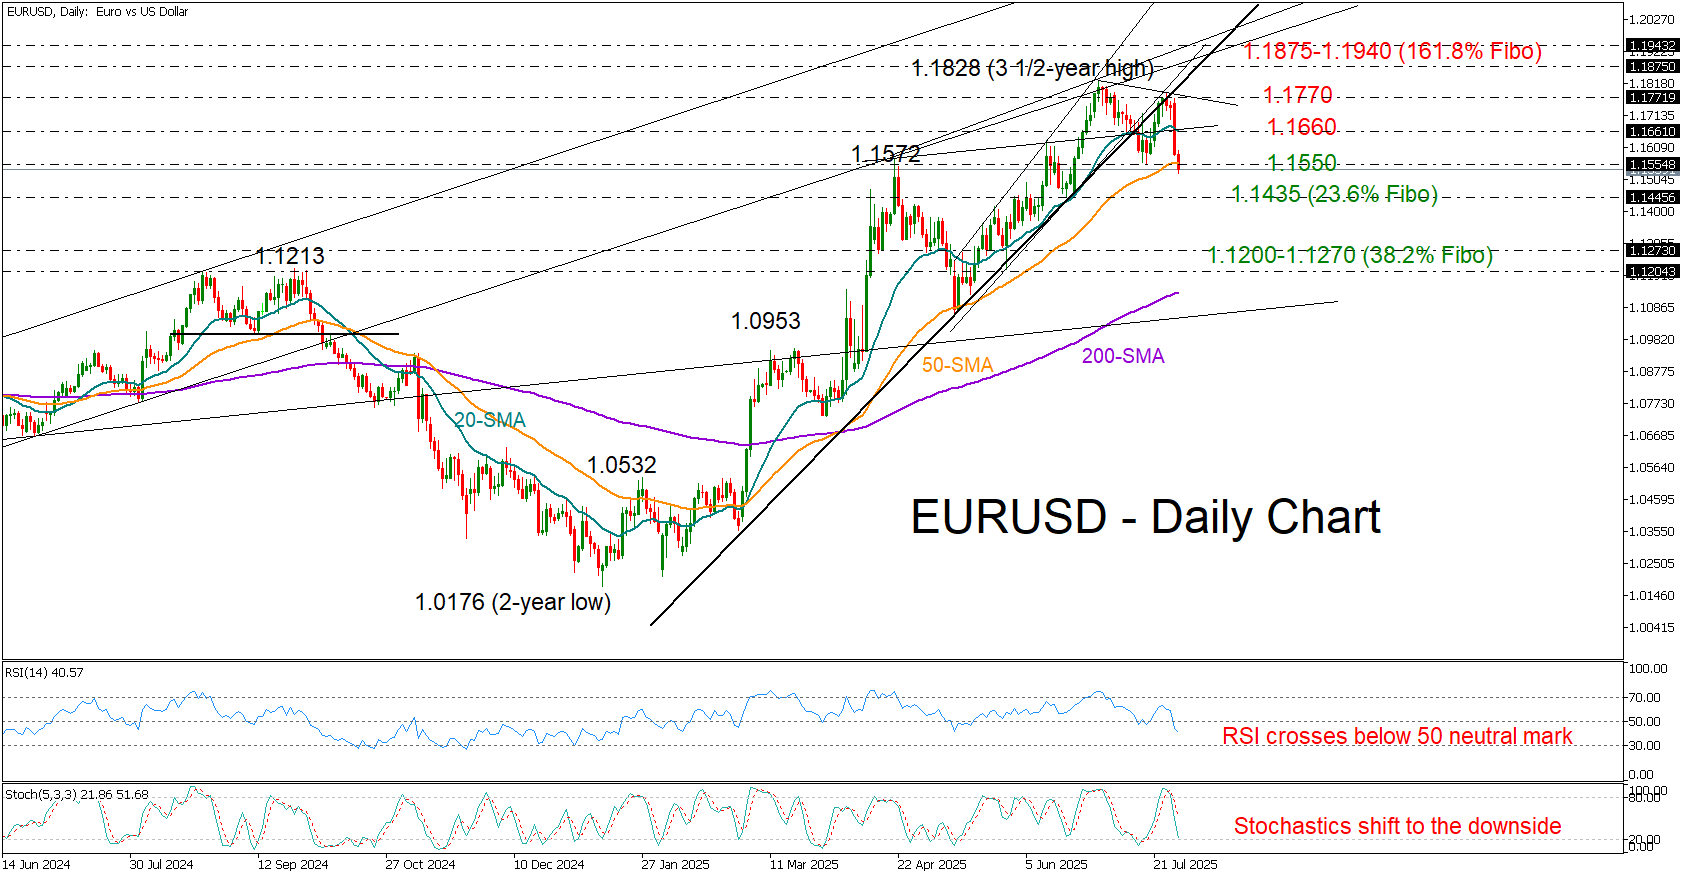
The sharp decline confirmed a lower high near the 1.1770 area, and a lower low could be next, as persistent negative pressure appears to be aiming for a close below the previous trough at 1.1550 and the 50-day simple moving average (SMA). Notably, the four-hour chart shows that the price has completed a bearish head and shoulders pattern.
In momentum indicators, both the RSI and the stochastic oscillator have just entered bearish territory and remain comfortably above their oversold levels, suggesting that the decline may have only just begun. If this is the case, the price could test the 23.6% Fibonacci retracement level of the six-month uptrend at 1.1435. A break below that base may see the bears drive the pair aggressively toward the 1.1200–1.1273 area, where the 200-day SMA is converging.
Should the price avoid a drop below the 50-day SMA – as it did in May – the bulls may attempt a rebound above 1.1670, with potential to retest the 1.1770 barrier. Further gains could then target the 1.1865–1.1940 resistance zone.
All in all, EURUSD is currently facing a bearish outlook, with traders eyeing a decisive break below the 1.1550 area to open the door to lower levels.
ECB survey shows inflation fears recede, growth pessimism softens
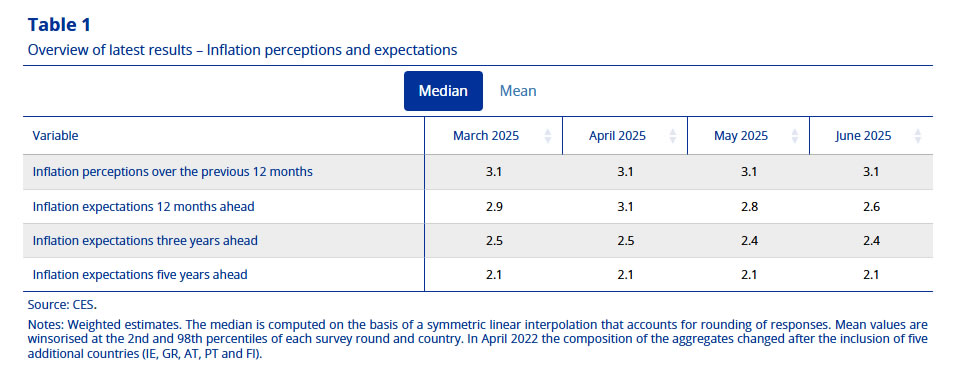
Eurozone consumers are dialing back their inflation expectations, according to the ECB's latest Consumer Expectations Survey for June. Median one-year inflation expectations fell from 2.8% to 2.6%, fully reversing the uptick seen in March and April. Longer-term expectations remained anchored, with three-year and five-year outlooks steady at 2.4% and 2.1% respectively, the latter unchanged for seven consecutive months.
Household sentiment on spending also weakened. Expected nominal spending growth dropped to 3.2% in June, down from 3.5% in May and 3.7% in April. The continued decline suggests rising caution among consumers, likely driven by lingering geopolitical uncertainty, uneven wage growth, and lower perceived price pressures ahead.
On growth, expectations became slightly less negative. Median expectations for economic growth over the next 12 months improved to -1.0% from -1.1% in May and -1.9% in April. Still, households broadly expect economic contraction, reflecting the Eurozone’s fragile recovery and ongoing concerns around trade, manufacturing, and domestic demand.
Nasdaq 100 Outperformed, Nikkei 225 Pull-Back Hit Key Support
Monday, 29 July’s standout move came from the FX market, where the US dollar surged to near a two-month high. The greenback’s strength followed initial optimism over the newly announced US-EU trade deal, which triggered a brief intraday spike of 0.3% in the euro during the early hours of Monday’s Asian session.
However, that euro rally quickly faded. By the close of the US session, the euro had tumbled 1.3%, its steepest daily drop since 12 May 2025, making it the worst-performing major currency. The US Dollar Index climbed 1% on the day, bringing its July-to-date gain to 2%, its strongest monthly performance of 2025.
Trade terms favour the US, stir EU criticism
The reversal in euro sentiment was driven by criticism over the deal's perceived imbalance. Under the agreement, the EU will apply a 15% tariff on most exports to the US, while its own tariffs on US goods will fall below 1%. Additionally, the EU has pledged to buy US$750 billion worth of American energy and invest another US$600 billion in the US economy.
German officials and industry leaders voiced concern that the deal disproportionately benefits the US, potentially harming the competitiveness of European manufacturers. Reflecting this unease, Germany’s DAX fell 1%, the worst performer among major European indices.
US tech rally continues, led by Nvidia
In contrast, US equities extended their bullish momentum. Nvidia surged 1.9% intraday on Monday to close at another record high, fueling further gains in the Nasdaq 100, which rose 0.4% to a fresh all-time closing high of 23,356. The S&P 500 and Nasdaq 100 E-mini futures continued the rally in today’s Asia session, gaining 0.1% and 0.2%, respectively.
Asian equities pull back amid stronger dollar
Despite the bullish tone in US markets, most Asia-Pacific indices slipped in today’s session, weighed down by the firmer dollar. Hong Kong’s Hang Seng Index dropped 1% to a five-day low, even as markets anticipate a 90-day extension of the US-China tariff truce beyond the 12 August deadline.
Japan’s Nikkei 225 also fell 1% to 40,590, marking its third straight daily loss. The index is now nearing its 20-day moving average at around 40,130, which may act as intermediate support.
USD/JPY nears key resistance as yen rebounds
In the currency markets, the dollar’s rally paused. The Japanese yen emerged as the best-performing major currency today, up 0.2% against the greenback. The USD/JPY pair hit an intraday high of 148.71 and is now testing a critical resistance zone between 149.00 and 149.60, which has capped gains since mid-May.
Gold finds support as dollar eases
Gold (XAU/USD) managed to halt its four-day losing streak, gaining 0.1% intraday. The yellow metal found support around the US$3,300 level, a key medium-term technical floor, benefiting from the dollar’s subdued intraday performance.
Economic data releases
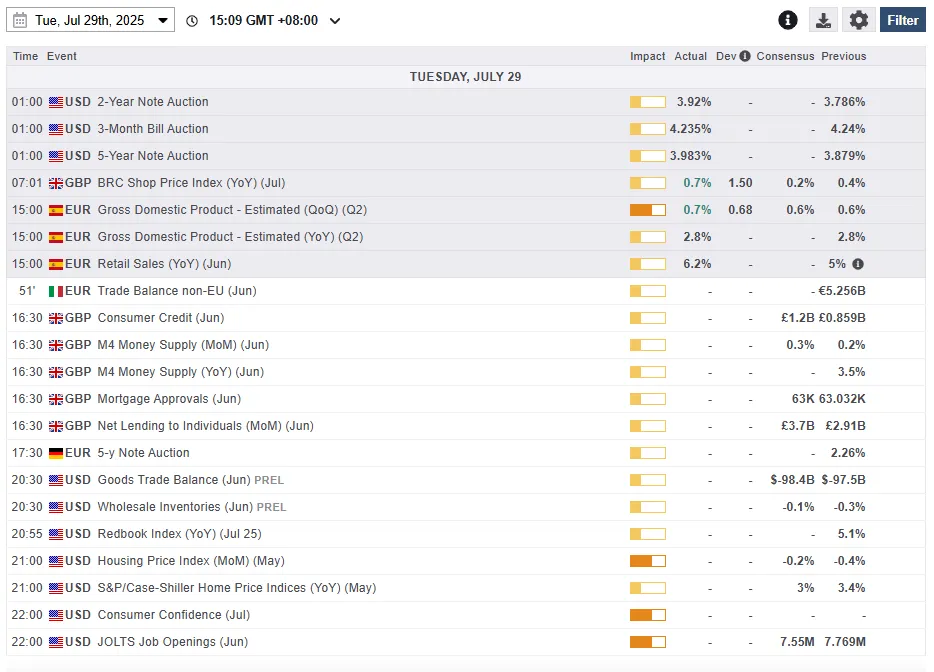
Fig 1: Key data for today’s Asia mid-session (Source: MarketPulse)
Chart of the day – Nikkei 225’s corrective pull-back may have ended
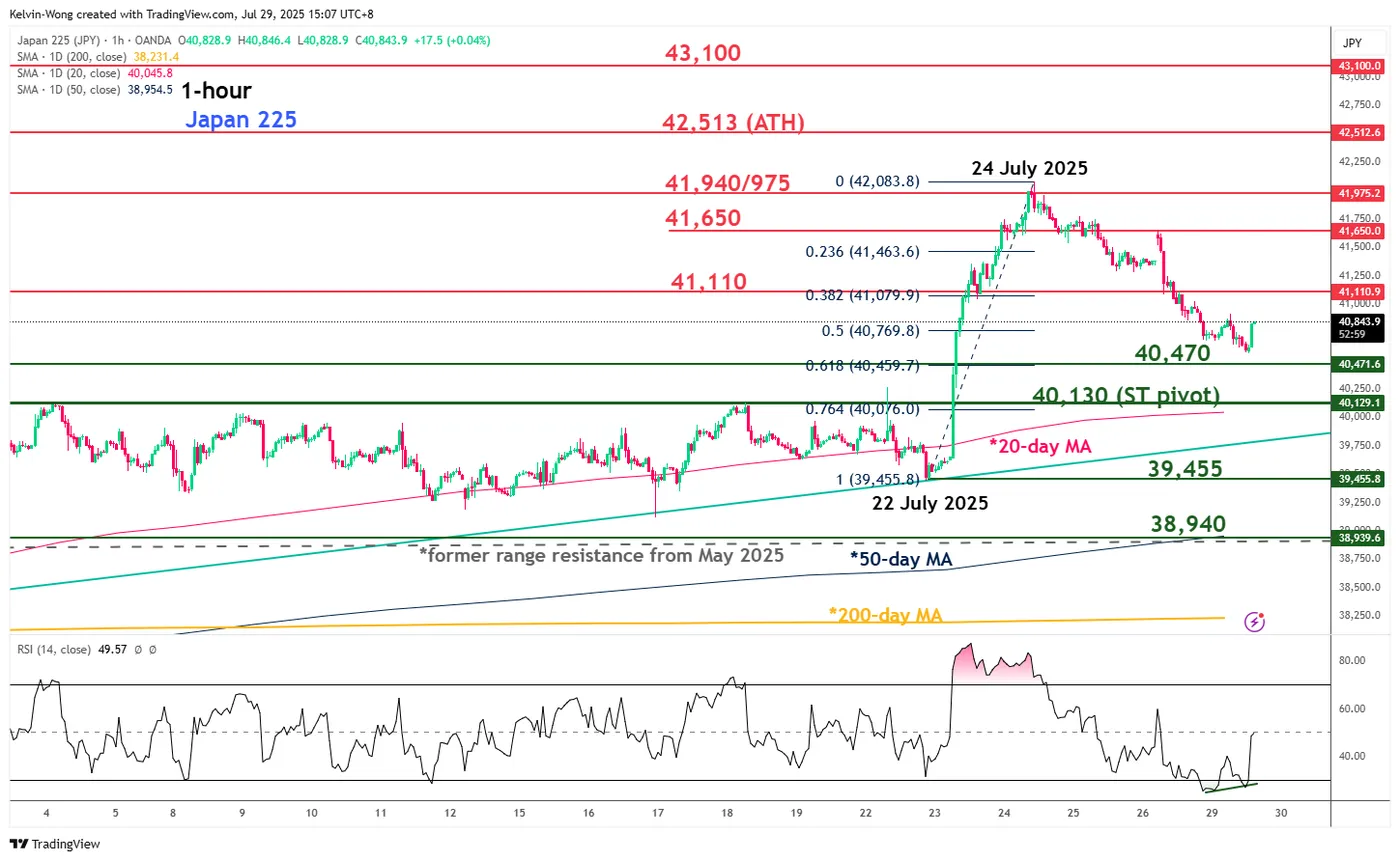
Fig 2: Japan 225 CFD Index minor trend as of 29 July 2025 (Source: TradingView)
After hitting its current 52-week high of 42,084 on last Thursday, 24 July (just a whisker below its current all-time high of 42,513 printed in July 2024), the price actions of the Japan 225 CFD Index (a proxy of the Nikkei 225 futures) have staged a minor corrective pull-back of -3.6%.
The three-day minor corrective decline sequence has reached a potential key inflection zone of 40,470/40,130 defined by a confluence of elements (the rising 20-day moving average, the 61.8%/76.4% Fibonacci retracement of the prior sharp rally from 22 July low to 24 July high) (see Fig 2).
In addition, the hourly RSI momentum indicator has just flashed out a bullish divergence condition at its oversold region, which suggests that the downside momentum of the three-day corrective decline has eased.
The odds now are in favour of the bulls for a continuation of another potential round of impulsive up-move sequence within its medium-term uptrend phase.
Watch the 40,130 key short-term pivotal support, and a clearance above 41,110 sees the next intermediate resistances coming in at 41,650, 41,940/975, and 42,513 in the first step.
On the other hand, failure to hold at 40,130 invalidates the recovery scenario for a round of corrective decline extension to expose the next intermediate supports at 39,455, and 38,940 (also the 50-day moving average).
After Trade Agreement with Japan and EU, August 1 Deadline Becomes Increasingly Irrelevant
Markets
European stocks initially welcomed the US-EU 15% trade deal but enthusiasm died out gradually through the session. While avoiding a worst-case no-deal scenario and offering companies something concrete to deal with (ie less uncertainty), extensive talk of a “lopsided” agreement favouring the US began to weigh on sentiment. The French PM Bayrou said it was an act of submission. German’s chancellor Merz welcomed the deal with the US first, mainly because it offers some clarity in a foggy situation first. He dialed back cautiously optimistic tone later and said that the tariffs represent a significant burden on the economy. Germany’s Kiel Institute for the World Economy puts the short-term price tag of the trade deal for the German economy at 0.1%. A pre-deal impact analysis by thinktank Bruegel showed a hit of around 0.3% on European GDP in various scenarios where tariffs ranged between 10-25% for all US trading partners. That’s something but it’s no reason for panic. It’s against this backdrop that we view EUR/USD’s 1.3% slide yesterday to sub 1.16 at least partially driven by thinner liquidity circumstances in a technical buy-the-rumour, sell-the-fact episode. Support at 1.1573 is being tested right now. This neckline of a double top formation could in case of a break pave the way for a return back to the 1.1431 area (23.6% USD recovery on the 2025 decline). The trade-weighted dollar index rebounded to back north of 98 with eyes set on the July high of 98.95. EUR/GBP’s failed test of the November 2023 high around 0.877 triggered impressive intraday return action, mostly EUR-inspired. The couple finished in the 0.867 area. Bunds outperformed Treasuries, forfeiting between 1.1-3.1 bps in a bull steepening move. US rates eked out up to 3 bps at the long end of the curve. A combined $69bn 2-yr and $70bn 5-yr auction went smooth and without any intraday movement.
After the trade agreement with Japan and the EU, this Friday’s August 1 deadline becomes increasingly irrelevant. US-Sino talks are expected to hit extratime beyond the August 12 date. It means the trade narrative – even though a lot of details still need to be hammered out – could move a bit to the background while the eco calendar starts heating up today with the June JOLTS report and July Conference Board consumer confidence. The US also auctions $44bn 7-year bonds. Strong data could trigger some UST underperformance and a further unwinding of dollar shorts, especially against the euro that lost some momentum short-term. But we expect the largest investor attention and therefore market reaction to be saved for tomorrow’s FOMC meeting (coinciding with Q2 GDP numbers) and Friday’s payrolls report. The first European national growth figures are scheduled for release, including in Belgium and Spain.
News & Views
The British Retail Consortium’s shop price inflation measure quickened to 0.7% y/y from 0.4% in June, well beyond the 0.3% expected. Renewed price pressures were most visible in the foods category, which added 0.4% m/m to be up 4% on a yearly basis. That’s the fastest pace in 17 months which retailers blame to the Labour government’s tax-increasing October budget. “Tighter global supplies” for some specific products including tea and meat added to the upward price pressures, BRC said. Non-food inflation rose by 0.1% m/m, the same pace as the previous two months, thereby reducing the deflationary y/y trend to -1% from -1.2%. That’s the highest tempo in a year and confirms a bottoming out trend in place since the start of the year.
The US Treasury Department yesterday announced its net marketable borrowing estimates for the July-September 2025 and October-December 2025 quarter. It anticipates to borrow roughly $1tn in net debt, assuming an end-of-September cash balance of $850bn. This is $453 bn higher than announced in April 2025, primarily due to the lower beginning-of-quarter cash balance and projected lower net cash flows. Excluding the lower than assumed beginning-of-quarter cash balance, the current quarter borrowing estimate is $60 bn higher than announced in April. During the October – December 2025 quarter, Treasury expects to borrow $590 bn in net debt, assuming an end-of-December cash balance of $850 bn. Additional details (including the tenor distribution) will be released later today.