Sample Category Title
EUR/AUD Daily Outlook
Daily Pivots: (S1) 1.7694; (P) 1.7746; (R1) 1.7787; More...
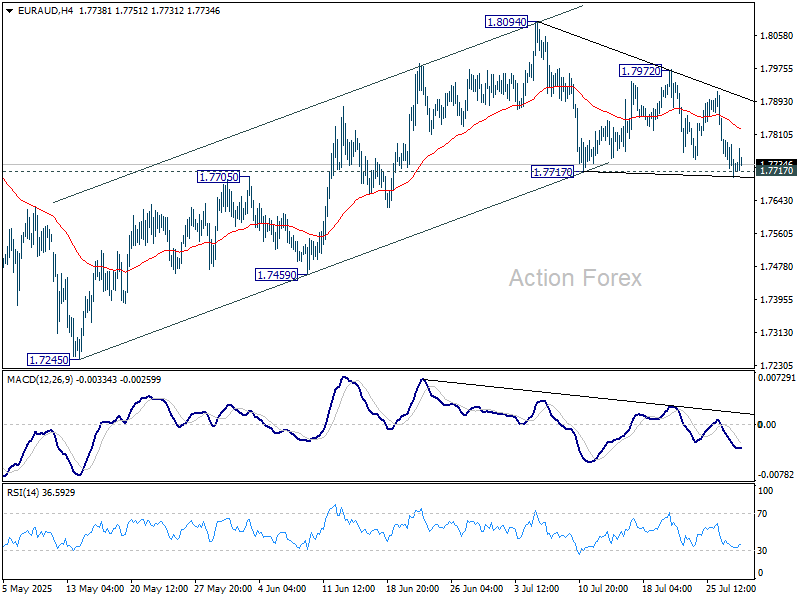
EUR/AUD recovered after hitting 1.7717 support and intraday bias stays neutral. On the downside, decisive break of 1.7717 will revive the case that rise from 1.7245 has completed. Corrective pattern from 1.8554 should have then started the third leg. Deeper decline should be seen to 1.7459 support first. Nevertheless, strong bounce from current level, followed by break of 1.7972 resistance, will resume the rise from 1.7245 through 1.8094.
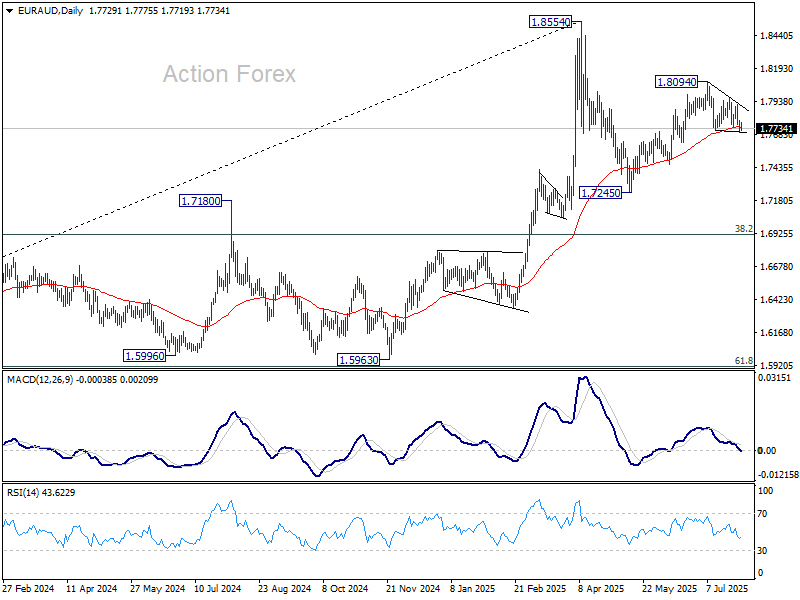
In the bigger picture, price actions from 1.8554 medium term top are seen as a corrective pattern. While deeper pullback might be seen, downside should be contained by 38.2% retracement of 1.4281 (2022 low) to 1.8554 at 1.6922 to bring rebound. Up trend from 1.4281 is expected to resume at a later stage.
Soft Inflation Clears Path for RBA Cut, BoC and Fed Next
Aussie weakened broadly on Asian session after Australia's Q2 CPI data cemented expectations for another RBA rate cut in August. However, the decline in Aussie lacks strong momentum so far. The softness in both headline and core inflation readings has effectively given the central bank the green light to proceed with its cautious easing cycle. But the absence of more significant economic weakness—especially in labor markets—means there’s little pressure to accelerate easing. Governor Michele Bullock’s recent dismissal of June’s uptick in unemployment supports the case for steady, quarterly rate reductions.
Elsewhere in the currency markets, Yen is leading gains as traders brace for Thursday’s BoJ meeting, with speculations of a hawkish tilt in tone or projections. Kiwi and Euro are also firm. Aussie is sitting at the bottom, followed by Sterling and Dollar. Loonie and Swiss Franc are largely in the middle of the pack.
Markets are facing a busy schedule ahead, with Eurozone GDP, US ADP employment, and US Q2 GDP advance release coming in quick succession. These will be followed by the BoC and FOMC rate decisions. The combination of macro data and central bank signals could drive sharp intraday moves across currencies and yields.
On trade, US-China negotiations in Stockholm ended without breakthrough. Officials indicated it’s now up to US President Donald Trump to determine whether to extend the current tariff truce past the August 12 deadline. A failure to do so could see tariff rates snap back to triple-digit levels.
US Treasury Secretary Scott Bessent stressed that only Trump can finalize any extension. He hinted at another round of discussions in about 90 days and noted “good personal interaction” with Chinese Vice Premier He Lifeng. Talks reportedly made progress on technical matters like rare earth exports.
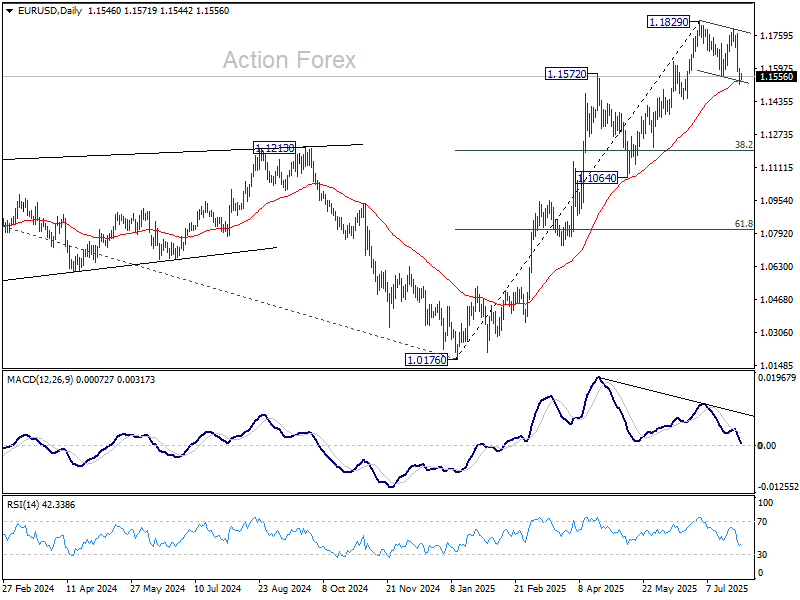
Technically, EUR/USD is hovering near its 55-day EMA. Bulls will want to see support hold to maintain the view that the pullback from 1.1829 is corrective. A sustained break below, however, would open up deeper losses toward 1.1198, the 38.2% retracement of the 1.0176 to 1.1829 advance.
In Asia, at the time of writing, Nikkei is down -0.16%. Hong Kong HSI is down -0.77%. China Shanghai SSE is up 0.52%. Singapore Strait Times is down -0.38%. Japan 10-year JGB yield is down -0.015 at 1.560. Overnight, DOW fell -0.46%. S&P 500 fell -0.30%. NASDAQ fell -0.38%. 10-year yield fell -0.090 to 4.330.
Dollar loses momentum ahead of Fed's potential dovish tilt
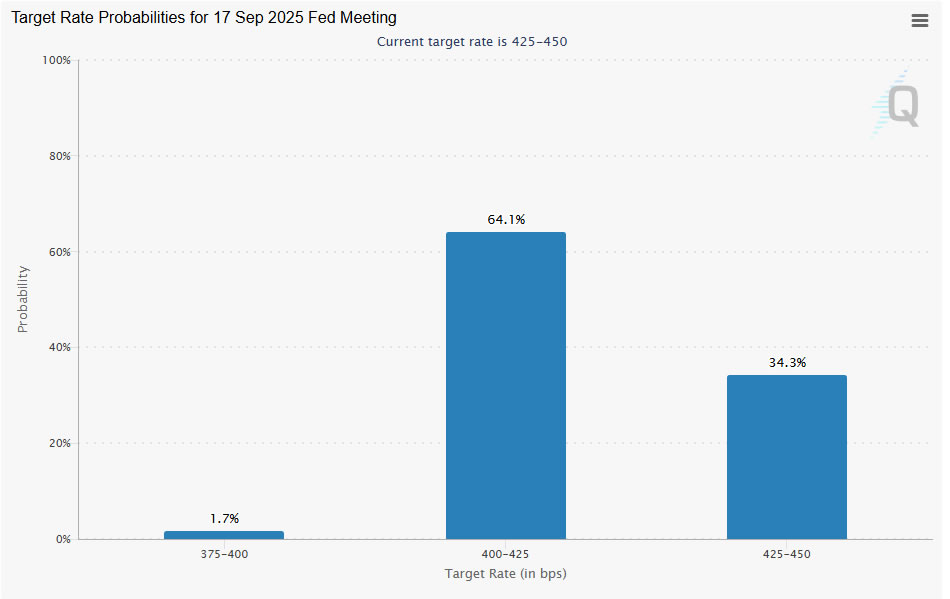
Fed is widely expected to keep interest rates unchanged 4.25–4.50%. Markets have priced in over a 97% chance of a hold, making the decision a foregone conclusion. However, the markets would watch out for any dovish signals from the Fed, which could put pressure on the Dollar, particularly if policy language starts to point more clearly toward a September cut.
Key to the announcement will be whether dovish members like Governors Christopher Waller and Michelle Bowman begin to shift their rhetoric into formal dissent— casting votes for an immediate cut. If additional policymakers join them, markets will likely interpret it as confirmation that a policy pivot is nearing. Fed Chair Jerome Powell’s tone in the post-meeting press conference will also be crucial in guiding expectations into the fall.
Currently, futures markets see a roughly 65% chance of a rate cut in September. Any softening in Powell’s stance or language around tariff uncertainty and inflation could raise those odds.
Economic data released ahead of the Fed will help set the stage. A 2.4% annualized Q2 GDP print is expected, following Q1’s surprising -0.5% contraction. However, this strength is largely technical, driven by a reversal in imports following tariff-related stockpiling in Q1, rather than an underlying surge in domestic activity.
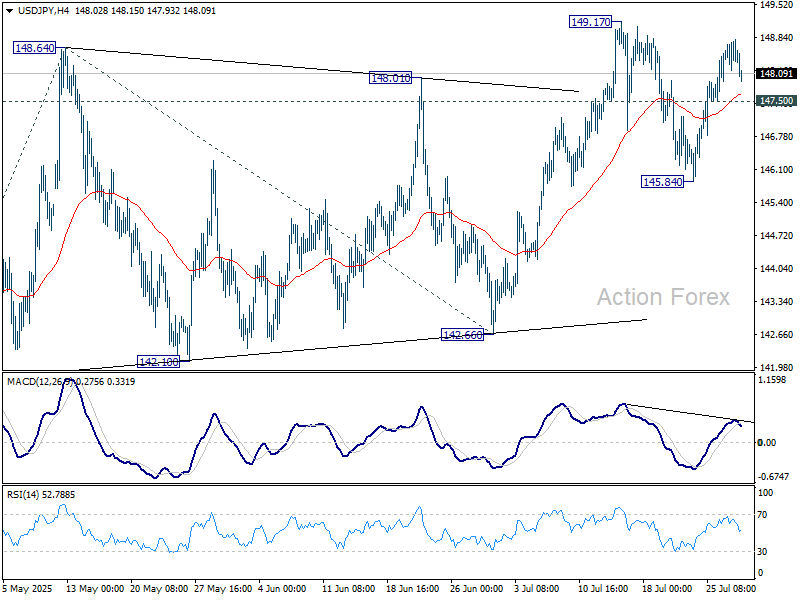
Technically, USD/JPY's rebound from 145.84 lost momentum ahead of 149.17 resistance. Intraday bias is turned neutral first. On the upside, firm break of 149.17 will resume whole rally from 139.87 and target 100% projection of 139.87 to 148.64 from 142.66 at 151.43, which is close to 151.22 fibonacci level. Nevertheless, break of 147.50 minor support will extend the corrective pattern from 149.17 with another falling leg towards 145.84 first.
BoC to hold fire again, September cut still in play
BoC is widely expected to hold its overnight rate steady at 2.75% today, marking a third consecutive pause in its rate-cut cycle. The slight improvement in the labor market, with unemployment edging back down to 6.9% in June, gives the central bank breathing space to maintain its current stance. However, core inflation pressures remain stubborn, with CPI common stuck at 2.6%, far from the bank’s comfort zone.
With policy already sitting in the neutral range, the BoC is likely opting for a wait-and-see approach, especially given ongoing trade uncertainties and the potential for delayed tariff pass-throughs to consumer prices later in the year. While underlying growth concerns persist, there’s a case for keeping policy steady until inflation dynamics become clearer.
Markets continue to expect further easing this year. A Reuters poll shows that nearly two-thirds of economists forecast a 25 basis point cut in September, followed by another by year-end. That would bring the policy rate down to 2.25%, aligning with weakening demand and persistent disinflation pressures if they materialize.
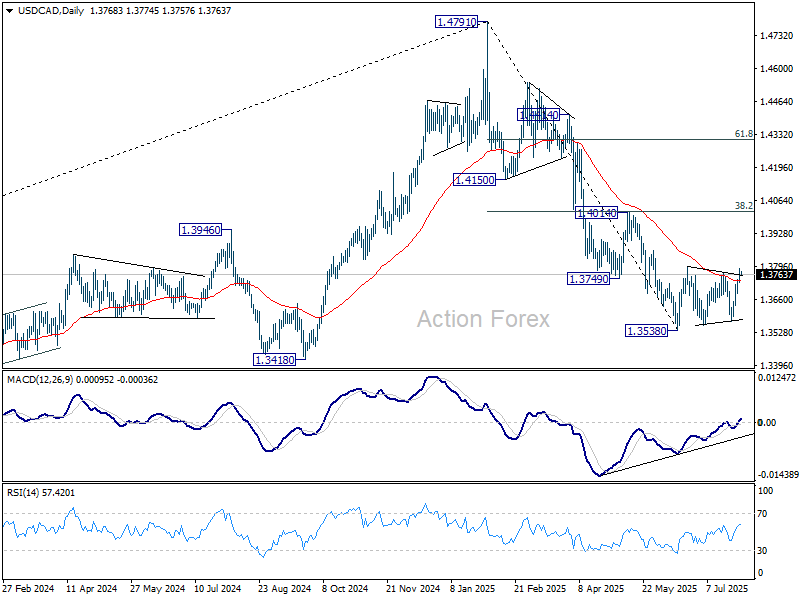
Technically, considering bullish convergence condition in D MACD, USD/CAD's break of 55 D EMA this week suggests that it might already be correcting the whole fall from 1.4791. Further rebound is likely in the near term. Though, strong resistance should emerge below 1.4014 (38.2% retracement of 1.4791 to 1.3538 at 1.4017 to limit upside.
Australia CPI cools to 2.1% in Q2, June reading undershoots
Australia’s inflation pressures continued to ease in Q2, reinforcing expectations for further policy easing from the RBA.
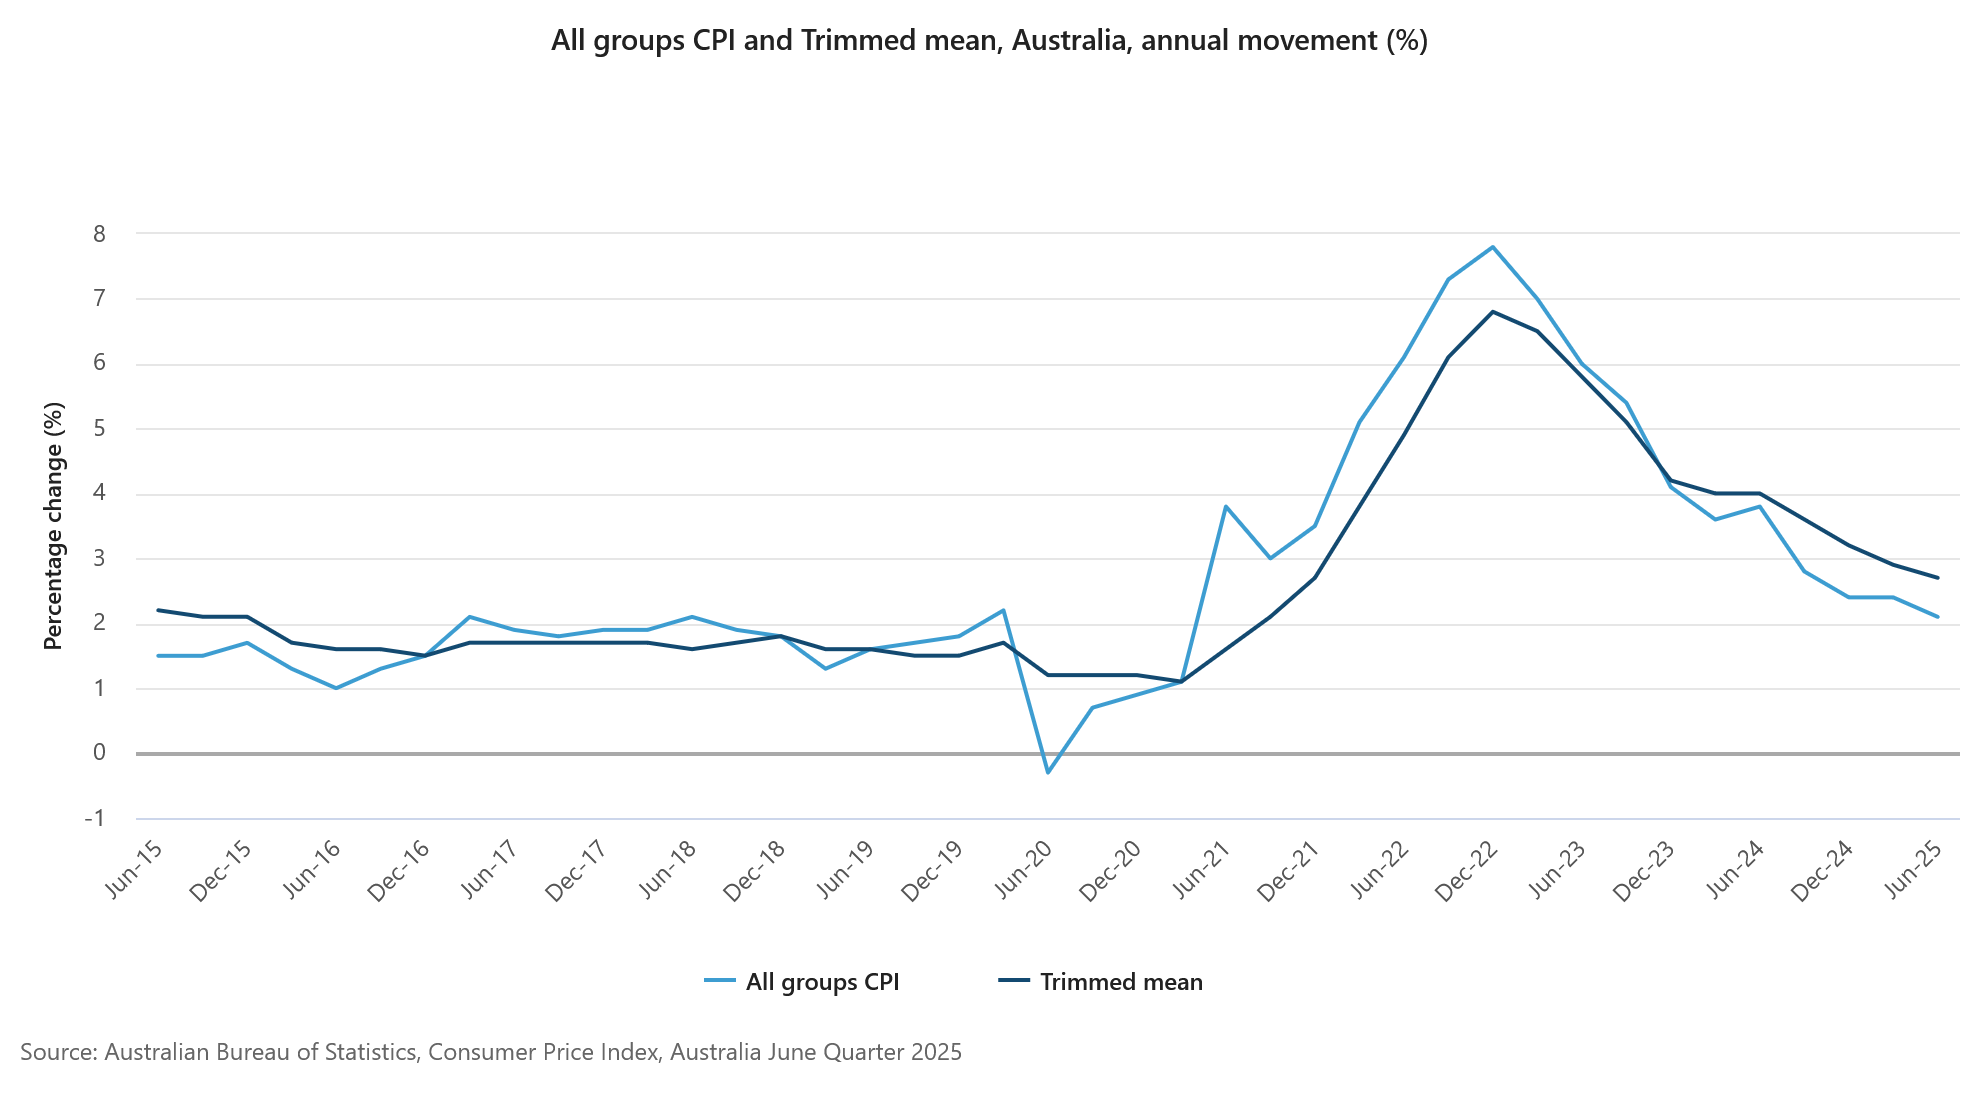
Headline CPI rose 0.7% qoq, down from Q1’s 0.9% qoq and under the 0.8% qoq consensus. On an annual basis, CPI slowed from 2.4% yoy to 2.1% yoy, the lowest since early 2021, and below expectation of 2.2% yoy.
Trimmed mean inflation, the RBA’s preferred gauge, also moderated from 0.7% qoq to 0.6% qoq. Annual rate fell from 2.9% to 2.7% yoy, matched expectations, and marking the lowest since Q4 2021.
Underlying disinflation is broadening too. Annual services inflation cooled from 3.7% yoy to 3.3% yoy, the weakest since Q2 2022. Goods inflation dipped back to 1.1% yoy after a brief uptick from Q4's 0.8% yoy to Q1's 1.3% yoy.
The June monthly CPI dropped from 2.1% yoy to 1.9% yoy, also below expectations of 2.1% yoy, and undershoots RBA's 2-3% target band.
NZ ANZ business confidence ticks up to 47.8, easing inflation signals more RBNZ cuts ahead
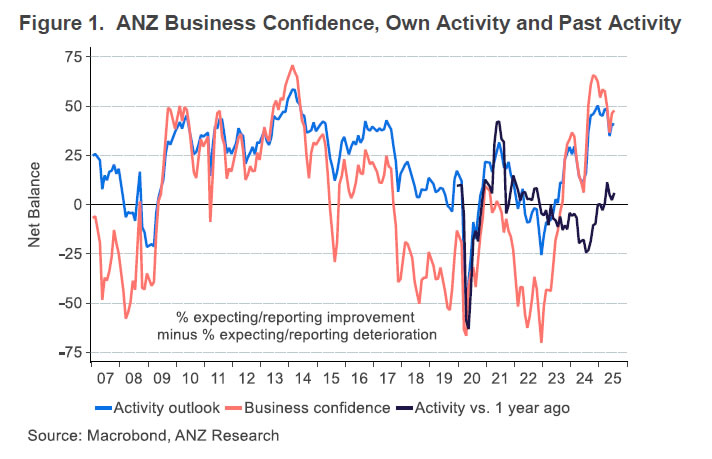
New Zealand’s ANZ Business Confidence ticked higher in July, rising from 46.3 to 47.8. Own Activity Outlook edged down slightly from 40.9 to 40.6. The share of firms expecting to raise prices over the next three months dropped to 43.5%—the lowest since December 2024. Inflation expectations also dipped from 2.71% to 2.68%.
ANZ described the inflation signals as “benign,” noting declines across both cost and pricing expectations. The bank suggested that RBNZ may soon shift from worrying about inflation staying too high to concerns about it falling too low, implying a greater likelihood of deeper monetary easing than currently priced in by markets or flagged by the RBNZ itself.
EUR/AUD Daily Outlook
Daily Pivots: (S1) 1.7694; (P) 1.7746; (R1) 1.7787; More...
EUR/AUD recovered after hitting 1.7717 support and intraday bias stays neutral. On the downside, decisive break of 1.7717 will revive the case that rise from 1.7245 has completed. Corrective pattern from 1.8554 should have then started the third leg. Deeper decline should be seen to 1.7459 support first. Nevertheless, strong bounce from current level, followed by break of 1.7972 resistance, will resume the rise from 1.7245 through 1.8094.
In the bigger picture, price actions from 1.8554 medium term top are seen as a corrective pattern. While deeper pullback might be seen, downside should be contained by 38.2% retracement of 1.4281 (2022 low) to 1.8554 at 1.6922 to bring rebound. Up trend from 1.4281 is expected to resume at a later stage.
GBP/USD Turns Red – Dollar Strength Builds Ahead of Fed, GDP Print
Key Highlights
- GBP/USD gained bearish momentum below the 1.3500 support.
- It traded below a bullish trend line with support at 1.3450 on the 4-hour chart.
- EUR/USD tumbled below the 1.1660 and 1.1620 support levels.
- The US Gross Domestic Product could grow by 2.4% in Q2 2025 (Preliminary).
GBP/USD Technical Analysis
The British Pound turned red below 1.3500 against the US Dollar. GBP/USD gained bearish momentum and traded below the 1.3420 support zone.
Looking at the 4-hour chart, the pair traded below a bullish trend line with support at 1.3450. It even settled below the 1.3400 level, the 100 simple moving average (red, 4-hour), and the 200 simple moving average (green, 4-hour).
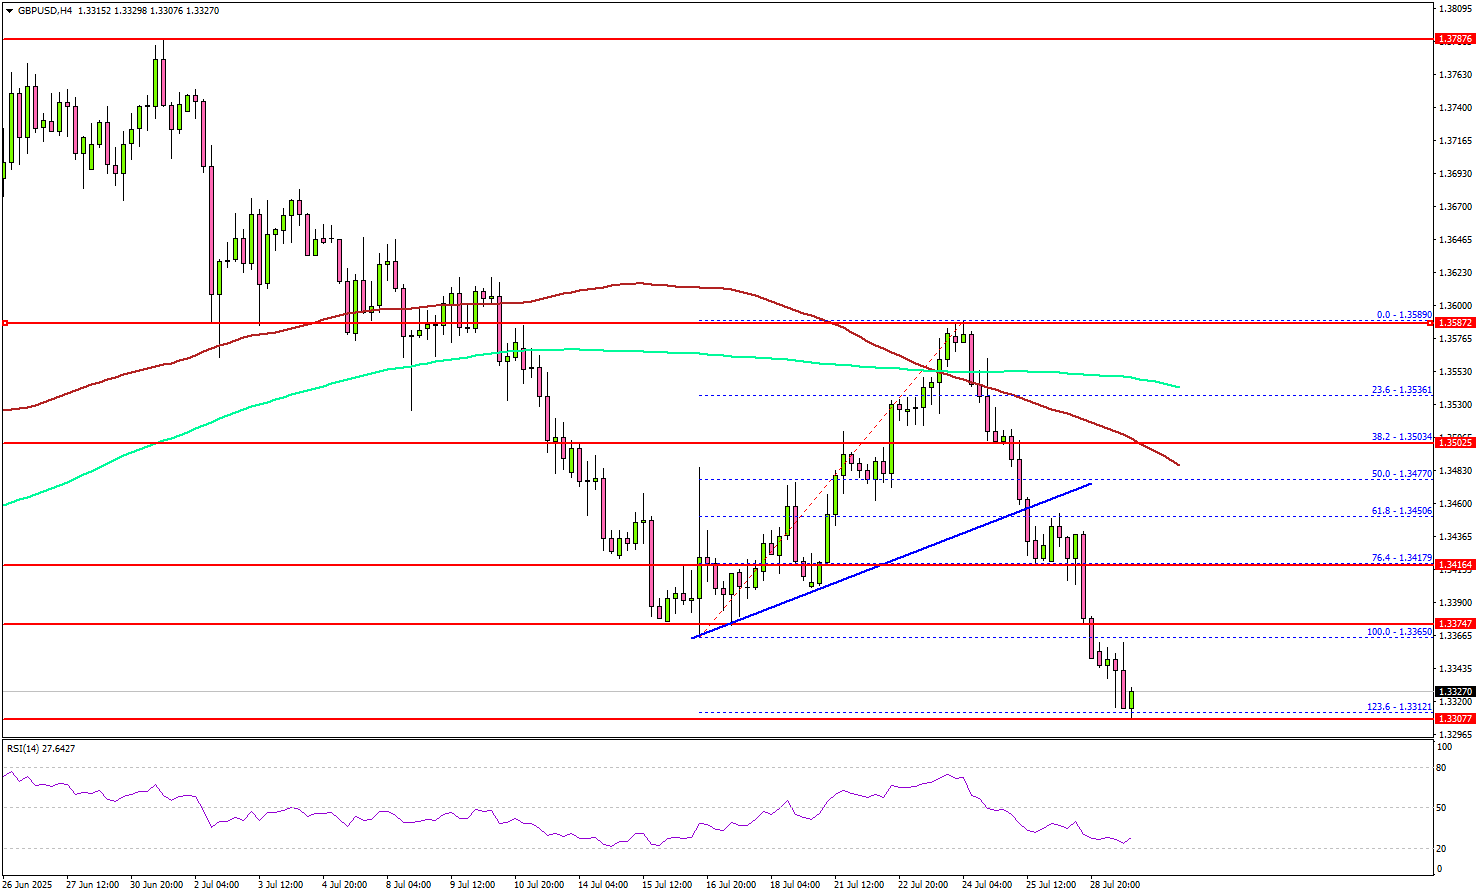
The decline was such that the pair tested the 1.236 Fib extension level of the upward move from the 1.3365 swing low to the 1.3589 high. On the downside, immediate support is near the 1.3310 level.
The next key support sits near 1.3280. Any more losses could send the pair toward the 1.3220 support zone. On the upside, the pair now faces resistance near the 1.3375 level. The next key resistance sits near the 1.3420 level.
A close above the 1.3420 level could set the pace for another increase. In the stated case, the pair could rise toward the 1.3500 resistance. The next major stop for the bulls could be near the 1.3550 resistance.
Looking at GBP/USD, the pair is showing bearish signs and might decline below the 1.1500 support zone.
Upcoming Economic Events:
- US Gross Domestic Product for Q2 2025 (Preliminary) – Forecast 2.4% versus previous -0.5%.
- Fed Interest Rate Decision - Forecast 4.5%, versus 4.5% previous.
BoC to hold fire again, September cut still in play
BoC is widely expected to hold its overnight rate steady at 2.75% today, marking a third consecutive pause in its rate-cut cycle. The slight improvement in the labor market, with unemployment edging back down to 6.9% in June, gives the central bank breathing space to maintain its current stance. However, core inflation pressures remain stubborn, with CPI common stuck at 2.6%, far from the bank’s comfort zone.
With policy already sitting in the neutral range, the BoC is likely opting for a wait-and-see approach, especially given ongoing trade uncertainties and the potential for delayed tariff pass-throughs to consumer prices later in the year. While underlying growth concerns persist, there’s a case for keeping policy steady until inflation dynamics become clearer.
Markets continue to expect further easing this year. A Reuters poll shows that nearly two-thirds of economists forecast a 25 basis point cut in September, followed by another by year-end. That would bring the policy rate down to 2.25%, aligning with weakening demand and persistent disinflation pressures if they materialize.
Technically, considering bullish convergence condition in D MACD, USD/CAD's break of 55 D EMA this week suggests that it might already be correcting the whole fall from 1.4791. Further rebound is likely in the near term. Though, strong resistance should emerge below 1.4014 (38.2% retracement of 1.4791 to 1.3538 at 1.4017 to limit upside.
Dollar loses momentum ahead of Fed’s potential dovish tilt
Fed is widely expected to keep interest rates unchanged 4.25–4.50%. Markets have priced in over a 97% chance of a hold, making the decision a foregone conclusion. However, the markets would watch out for any dovish signals from the Fed, which could put pressure on the Dollar, particularly if policy language starts to point more clearly toward a September cut.
Key to the announcement will be whether dovish members like Governors Christopher Waller and Michelle Bowman begin to shift their rhetoric into formal dissent— casting votes for an immediate cut. If additional policymakers join them, markets will likely interpret it as confirmation that a policy pivot is nearing. Fed Chair Jerome Powell’s tone in the post-meeting press conference will also be crucial in guiding expectations into the fall.
Currently, futures markets see a roughly 65% chance of a rate cut in September. Any softening in Powell’s stance or language around tariff uncertainty and inflation could raise those odds.
Economic data released ahead of the Fed will help set the stage. A 2.4% annualized Q2 GDP print is expected, following Q1’s surprising -0.5% contraction. However, this strength is largely technical, driven by a reversal in imports following tariff-related stockpiling in Q1, rather than an underlying surge in domestic activity.
Technically, USD/JPY's rebound from 145.84 lost momentum ahead of 149.17 resistance. Intraday bias is turned neutral first. On the upside, firm break of 149.17 will resume whole rally from 139.87 and target 100% projection of 139.87 to 148.64 from 142.66 at 151.43, which is close to 151.22 fibonacci level. Nevertheless, break of 147.50 minor support will extend the corrective pattern from 149.17 with another falling leg towards 145.84 first.
RBA Policy at Sixes and Sevens: 25bp Cash Rate Cut Expected in August
Quarterly trimmed mean inflation tracking at 0.6%–0.7%, so inflation is within target. RBA likely to continue reducing monetary restrictiveness, including by cutting the cash rate at its August meeting.
- The RBA Monetary Policy Board (MPB) in July opted to wait for more confirmation that inflation is on track to return to the midpoint of the 2–3% target range and stay there. That confirmation has now come with the full June quarter CPI data.
- We therefore expect the MPB to cut rates by 25bps at its August meeting, to 3.6%. Further cuts in November, February 2026 and May 2026, also look increasingly likely.
- Today’s data removes any awkwardness posed by inflation remaining too high for the RBA’s comfort, at the same time that the labour market might be starting to ease again. RBA Governor Bullock understandably downplayed the pick-up in unemployment in the month of June, given the volatility in the data. Further softening in the labour market would sit uncomfortably with a decision to hold the cash rate at restrictive levels when underlying inflation is so close to target.
Normally, monetary policy decisions should not come down to a single number tipping the balance. Monetary policy affects the economy with a lag and thus needs to be forward-looking. This time around, though, as in several recent quarters, the latest read for underlying inflation has been material for the RBA MPB’s upcoming decision.
Today’s trimmed mean inflation data came in close to what the RBA wanted to see. The outcome was 0.6%qtr, 2.7%yr versus 0.55%qtr (we believe) and 2.6%yr published in the RBA’s May forecasts. (Our own forecast, confirmed in Westpac Senior Economist Justin Smirk’s note earlier this week, was a ‘skinny’ 0.7%qtr, with downside risk, so the outcome was just a shade below our expectations.) Quarterly reads in the ‘sixes and sevens’ puts underlying inflation squarely inside the RBA’s 2–3%yr target range and is consistent with monetary policy no longer needing to be restrictive.
We therefore believe that the MPB now has the confirmation it needs to continue on its ‘cautious’ – if not so predictable last month – path of removing current monetary restrictiveness.
Accordingly, we expect the RBA to cut the cash rate by 25bps at its August meeting in a couple of weeks to 3.6%. With the internal members likely switching their votes from hold to cut, we expect the external members who voted to hold in July will also switch to a vote to cut, leading to a unanimous decision.
We suspect that today’s data will come as something of a relief to the RBA. By cementing the inflation case to cut, it removes any awkwardness around the signs of a renewed softening in the labour market, which would otherwise conflict with its response to inflation risks. RBA Governor Bullock downplayed the pick-up in unemployment in the month of June, rightly emphasising that one should never get hung up on one monthly read of a volatile series. The increase also took the quarterly average unemployment rate exactly in line with the RBA’s May forecast for June quarter. If, however, the RBA were to keep the cash rate on hold again in August, only to see further softening in the labour market in the July data released two days after the meeting, it would complicate its strategy and communication.
If we are correct that the RBA MPB does cut in August, the path from there also looks increasingly likely to line up with our current forecast of cuts in November, then February and May 2026. Assuming our expectations are borne out, that would take the cash rate to a trough of 2.85%. We think this is at the lower end of what could be regarded as neutral, and would reflect the RBA’s response to a path for underlying inflation that turns out a little lower than what it forecast in May.
We will have a little more colour on the RBA’s interpretation of these inflation data tomorrow, with Deputy Governor Andrew Hauser speaking in the morning. Consistent with the new practice for a MPB that is meant to be more independent than the previous Board was (wrongly) perceived to be, the Governor and Deputy Governor will not give guidance in public appearances between meetings. That would front-run the meeting and pre-empt the MPB’s decision. We could, however, learn more about how the RBA staff are seeing the data and whether the ongoing disinflation revealed in today’s data is expected to continue.
Australia CPI cools to 2.1% in Q2, June reading undershoots
Australia’s inflation pressures continued to ease in Q2, reinforcing expectations for further policy easing from the RBA.
Headline CPI rose 0.7% qoq, down from Q1’s 0.9% qoq and under the 0.8% qoq consensus. On an annual basis, CPI slowed from 2.4% yoy to 2.1% yoy, the lowest since early 2021, and below expectation of 2.2% yoy.
Trimmed mean inflation, the RBA’s preferred gauge, also moderated from 0.7% qoq to 0.6% qoq. Annual rate fell from 2.9% to 2.7% yoy, matched expectations, and marking the lowest since Q4 2021.
Underlying disinflation is broadening too. Annual services inflation cooled from 3.7% yoy to 3.3% yoy, the weakest since Q2 2022. Goods inflation dipped back to 1.1% yoy after a brief uptick from Q4's 0.8% yoy to Q1's 1.3% yoy.
The June monthly CPI dropped from 2.1% yoy to 1.9% yoy, also below expectations of 2.1% yoy, and undershoots RBA's 2-3% target band.
NZ ANZ business confidence ticks up to 47.8, easing inflation signals more RBNZ cuts ahead
New Zealand’s ANZ Business Confidence ticked higher in July, rising from 46.3 to 47.8. Own Activity Outlook edged down slightly from 40.9 to 40.6. The share of firms expecting to raise prices over the next three months dropped to 43.5%—the lowest since December 2024. Inflation expectations also dipped from 2.71% to 2.68%.
ANZ described the inflation signals as “benign,” noting declines across both cost and pricing expectations. The bank suggested that RBNZ may soon shift from worrying about inflation staying too high to concerns about it falling too low, implying a greater likelihood of deeper monetary easing than currently priced in by markets or flagged by the RBNZ itself.
EURGBP Wave Analysis
EURGBP: ⬇️ Sell
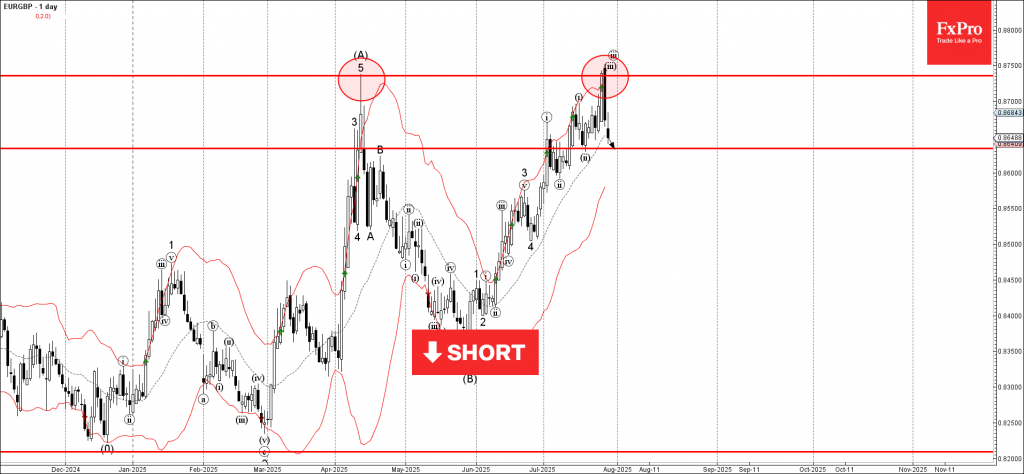
- EURGBP reversed from the resistance zone
- Likely fall to support level 0.8635
EURGBP currency pair recently reversed down from the resistance zone between the multi-month resistance level 0.8735 (which stopped sharp wave (A) in April) and the upper daily Bollinger Band.
The downward reversal from this resistance zone created the daily Japanese candlesticks reversal pattern Dark Cloud Cover.
Given the strength of the resistance level 0.8735, EURGBP currency pair can be expected to fall to the next support level 0.8635 (low of the previous minor correction ii).
Nikkei 225 Wave Analysis
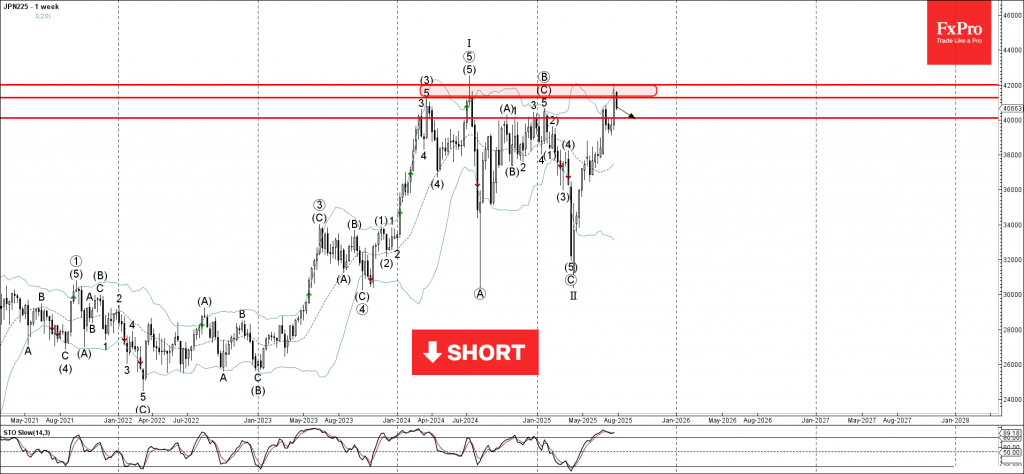
Nikkei 225: ⬇️ Sell
- Nikkei 225 reversed from the resistance zone
- Likely fall to support level 40000.00
Nikkei 225 index recently reversed from the resistance zone between the resistance levels 42000.00 (which started the sharp sell-off in 2024) and 41285.00.
This resistance zone was further strengthened by the upper daily and the weekly Bollinger Bands.
Given the strength of the aforementioned resistance zone and the overbought weekly Stochastic, Nikkei 225 index can be expected to fall to the next round support level 40000.00.