
Sample Category Title
USD/CHF Daily Outlook
Daily Pivots: (S1) 0.7937; (P) 0.7959; (R1) 0.7972; More….
Intraday bias in USD/CHF stays neutral for the moment. On the downside, below 0.7910 will bring retest of 0.7871 low. Firm break there will resume larger down trend and target 61.8% projection of 0.9200 to 0.8038 from 0.8475 at 0.7757. On the upside, break of 0.7990 minor resistance will bring stronger rebound to extend the corrective pattern from 0.7871.

In the bigger picture, long term down trend from 1.0342 (2017 high) is still in progress. Next target is 100% projection of 1.0146 (2022 high) to 0.8332 from 0.9200 at 0.7382. In any case, outlook will stay bearish as long as 0.8475 resistance holds.

AUD/USD Daily Report
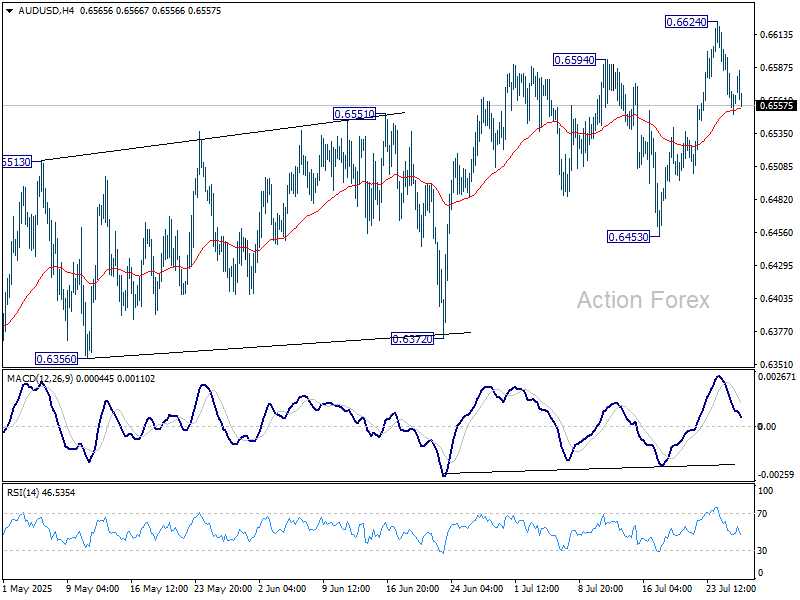
Daily Pivots: (S1) 0.6544; (P) 0.6573; (R1) 0.6594; More...
Intraday bias in AUD/USD remains neutral and more consolidations could be seen below 0.6624 resistance. Further rise is expected as long as 0.6453 support holds. Above 0.6624 will turn bias back to the upside. However, considering bearish divergence condition in D MACD, upside should be limited by 0.6713 fibonacci level on next rise.
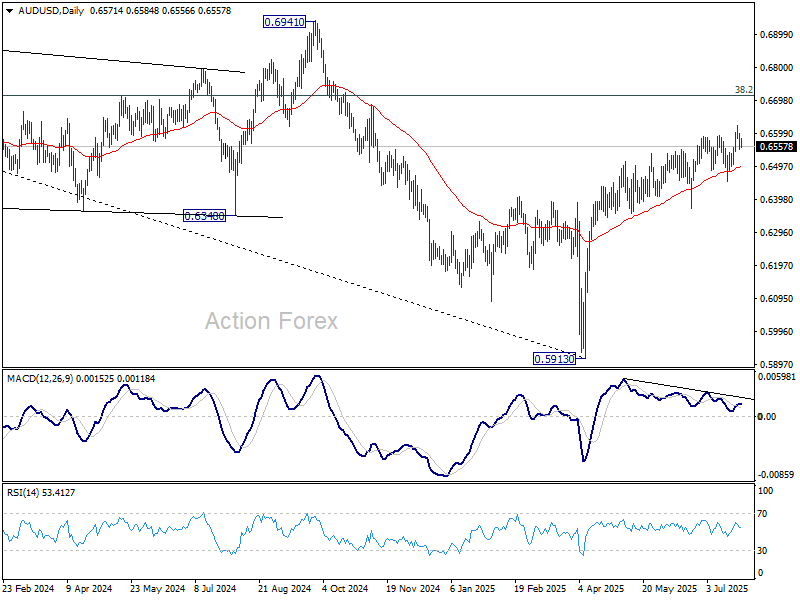
In the bigger picture, there is no clear sign that down trend from 0.8006 (2021 high) has completed. Rebound from 0.5913 is seen as a corrective move. While stronger rally cannot be ruled out, outlook will remain bearish as long as 38.2% retracement of 0.8006 to 0.5913 at 0.6713 holds. Nevertheless, considering bullish convergence condition in W MACD, even in case of another fall through 0.5913, downside should be contained above 0.5506 (2020 low).
USD/CAD Daily Outlook
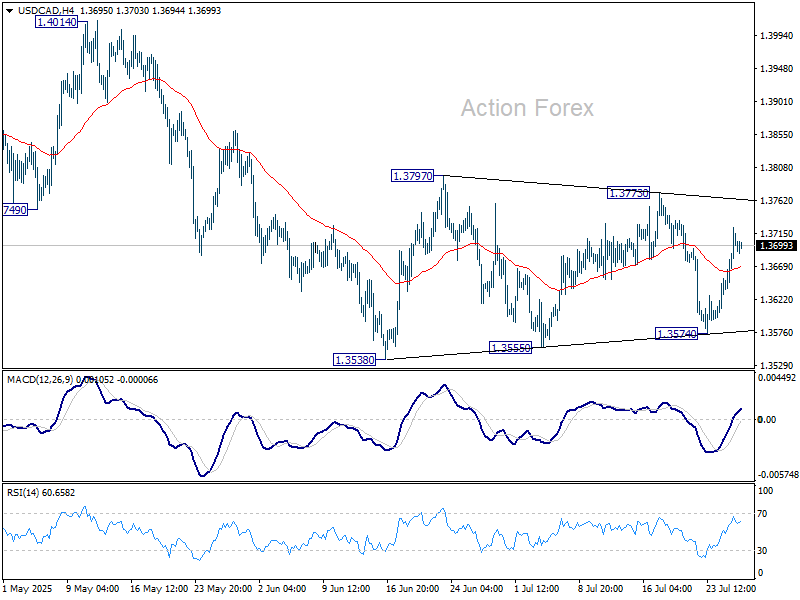
Daily Pivots: (S1) 1.3651; (P) 1.3688; (R1) 1.3742; More...
Intraday bias in USD/CAD stays neutral as sideway trading continues. Outlook will remain bearish as long as 1.3773 resistance holds. Break of 1.3574 will argue that consolidation pattern from 1.3538 has completed. And larger fall from 1.4791 is ready to resume through 1.3538. However, firm break of 1.3773 will argue that it's now correcting the whole fall from 1.4791 and target 1.4014 resistance instead.
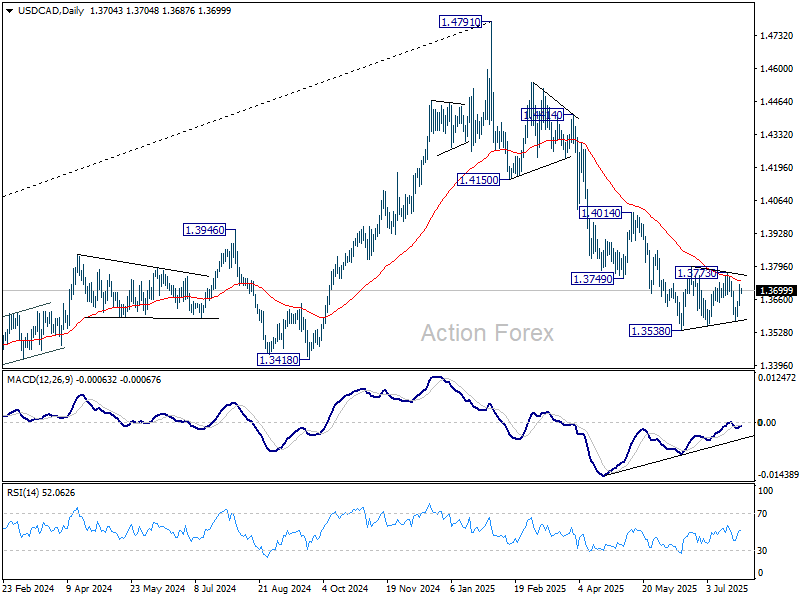
In the bigger picture, price actions from 1.4791 medium term top could either be a correction to rise from 1.2005 (2021 low), or trend reversal. In either case, further decline is expected as long as 1.4014 resistance holds. Next target is 61.8% retracement of 1.2005 (2021 low) to 1.4791 at 1.3069.
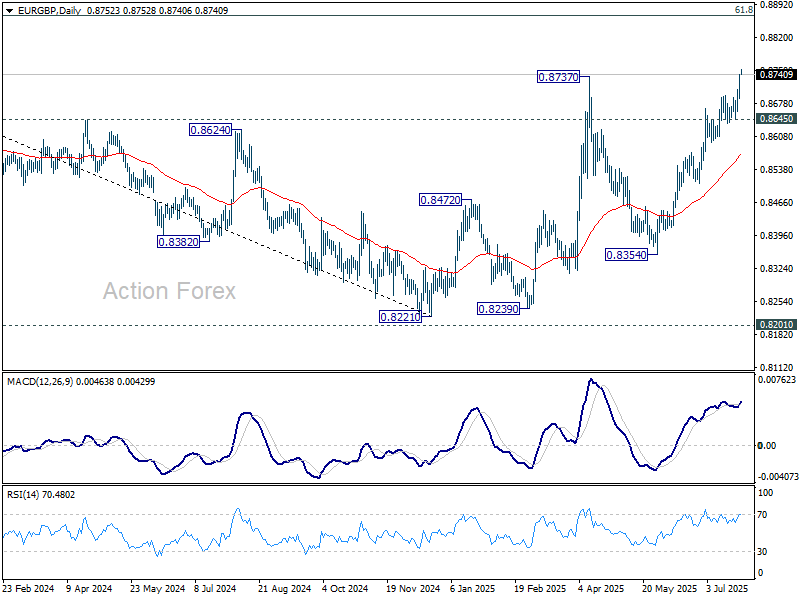
EUR/GBP Daily Outlook
Daily Pivots: (S1) 0.8699; (P) 0.8721; (R1) 0.8762; More...
Intraday bias in EUR/GBP remains on the upside at this point. Current rally is part of the whole medium term rise from 0.8221. Sustained trading above 0.8737 will pave the way to 0.8867 fibonacci level. For now, outlook will stay bullish as long as 0.8645 support holds, in case of retreat.
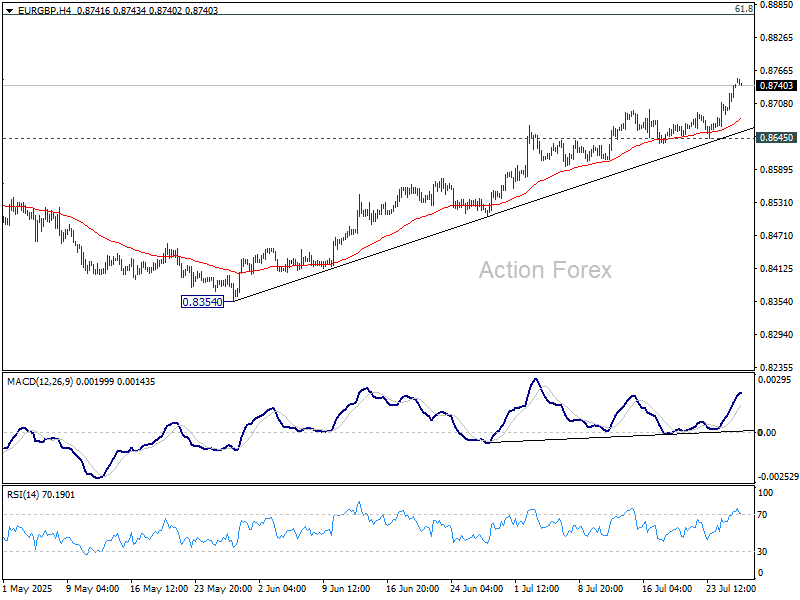
In the bigger picture, the structure from 0.8221 medium term bottom are not impulsive enough to suggest that it's reversing the down trend from 0.9267 (2022 high). But even if it's a correction, further rise is expected to 61.8% retracement of 0.9267 to 0.8221 at 0.8867. This will remain the favored case as long as 55 W EMA (now at 0.8486) holds.
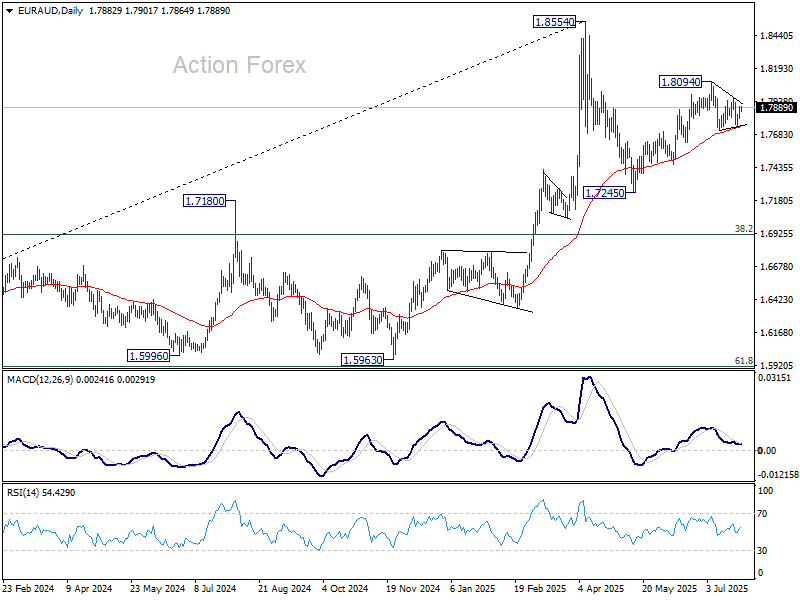
EUR/AUD Daily Outlook
Daily Pivots: (S1) 1.7811; (P) 1.7856; (R1) 1.7926; More...
Intraday bias in EUR/AUD remains neutral at this point. With 1.7717 support intact, further rally is expected. On the upside, above 1.7972 will bring retest of 1.8094. Firm break there will resume the rise from 1.7245 to towards 1.8554 high. However, break of 1.7717 support will revive the case that rise from 1.7245 has completed. Corrective pattern from 1.8554 should have then started the third leg.
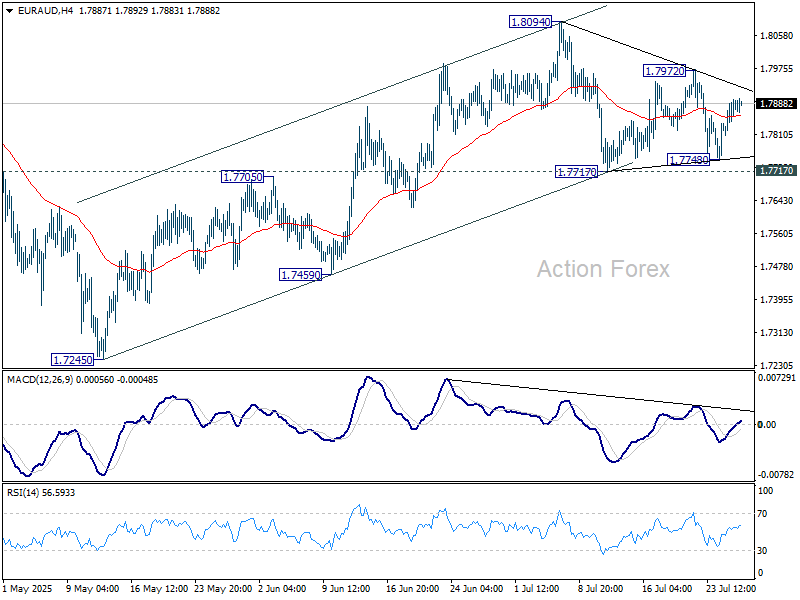
In the bigger picture, price actions from 1.8554 medium term top are seen as a corrective pattern. While deeper pullback might be seen, downside should be contained by 38.2% retracement of 1.4281 (2022 low) to 1.8554 at 1.6922 to bring rebound. Up trend from 1.4281 is expected to resume at a later stage.
EUR/CHF Daily Outlook
Daily Pivots: (S1) 0.9323; (P) 0.9339; (R1) 0.9349; More....
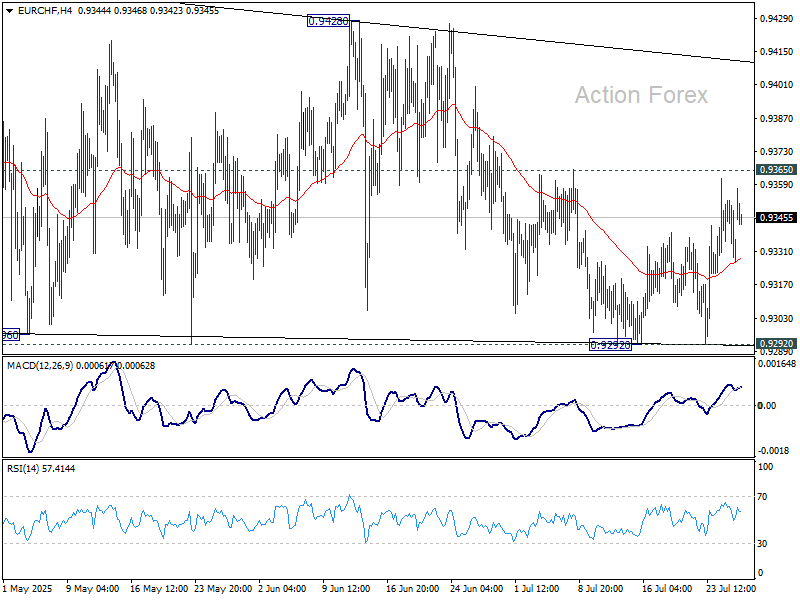
Intraday bias in EUR/CHF remains neutral for the moment. On the upside, firm break of 0.9365 will be the first sign that corrective pattern from 0.9445 has already completed. Further rise should then be seen to 0.9428/45 resistance zone. Firm break there will resume the rebound from 0.9218 low. However, firm break of 0.9292 will bring retest of 0.9218 instead.
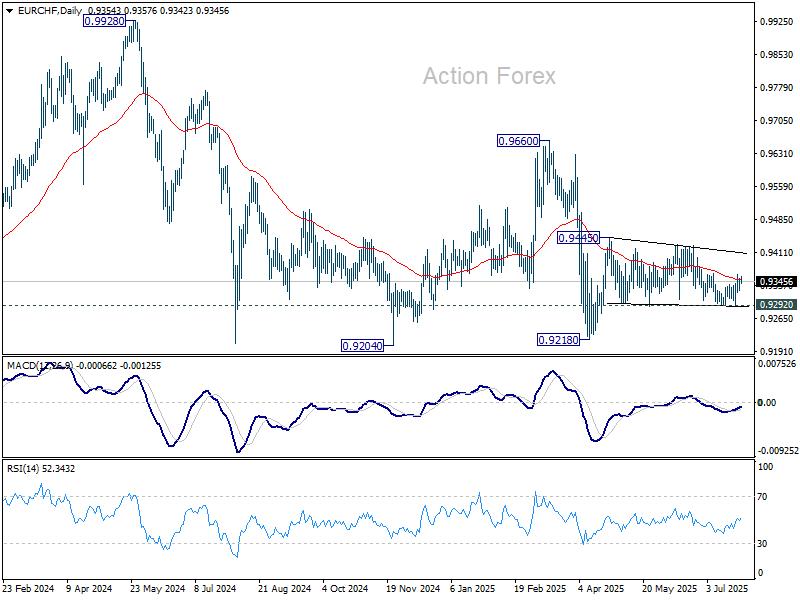
In the bigger picture, while downside momentum has been diminishing as seen in W MACD, there is no sign of bottoming yet. EUR/CHF is still staying below 55 W EMA (now at 0.9424) and well inside long term falling channel. Outlook will stay bearish as long as 0.9660 resistance holds. Break of 0.9204 (2024 low) will confirm resumption of down trend from 1.2004 (2018 high).
GBP/JPY Daily Outlook
Daily Pivots: (S1) 198.00; (P) 198.55; (R1) 198.95; More...
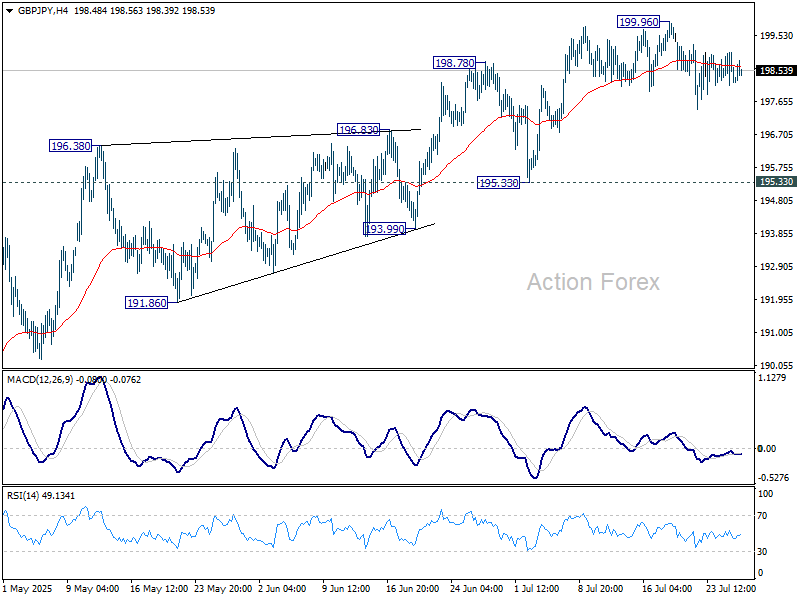
Intraday bias in GBP/JPY remains neutral and more consolidations could be seen below 199.96. While deeper pullback might be seen, outlook will stay bullish as long as 195.33 support holds. On the upside, break of 199.96 will resume the rise from 184.35 to 100% projection of 180.00 to 199.79 from 184.35 at 204.14.
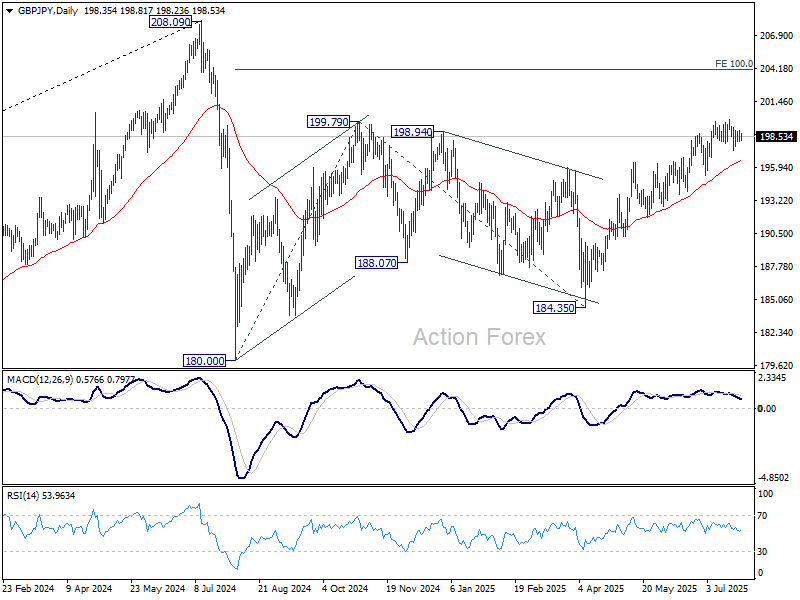
In the bigger picture, price actions from 208.09 (2024 high) are seen as a correction to rally from 123.94 (2020 low). The pattern might still extend with another falling leg. But in that case, strong support should be seen from 38.2% retracement of 123.94 to 208.09 at 175.94 to contain downside. Meanwhile, decisive break of 208.09 will confirm long term up trend resumption.
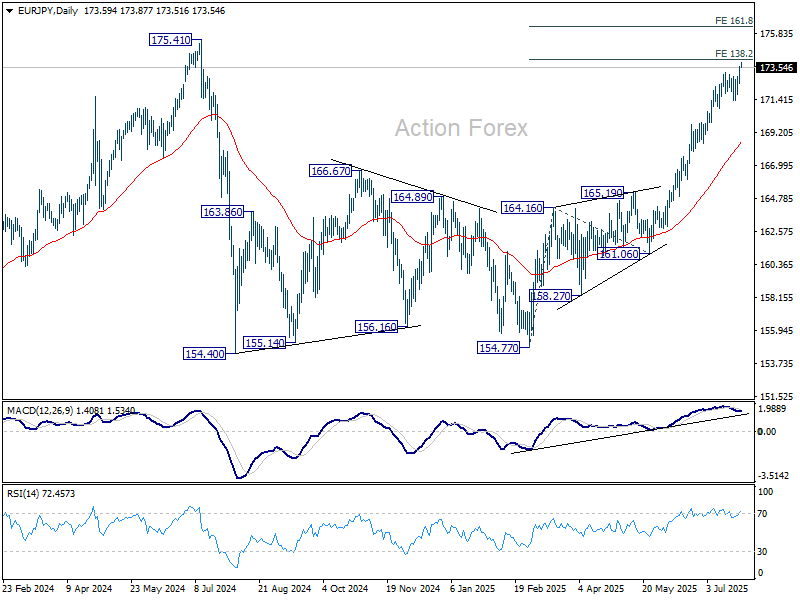
EUR/JPY Daily Outlook
Daily Pivots: (S1) 172.67; (P) 173.14; (R1) 173.81; More...
EUR/JPY's rally continues today and intraday bias remains on the upside. Immediate focus is on 138.2% projection of 154.77 to 164.16 from 161.06 at 174.03. Break there will bring retest of 175.41 high. For now, near term outlook will remain bullish as long as 171.35 support holds, in case of retreat.
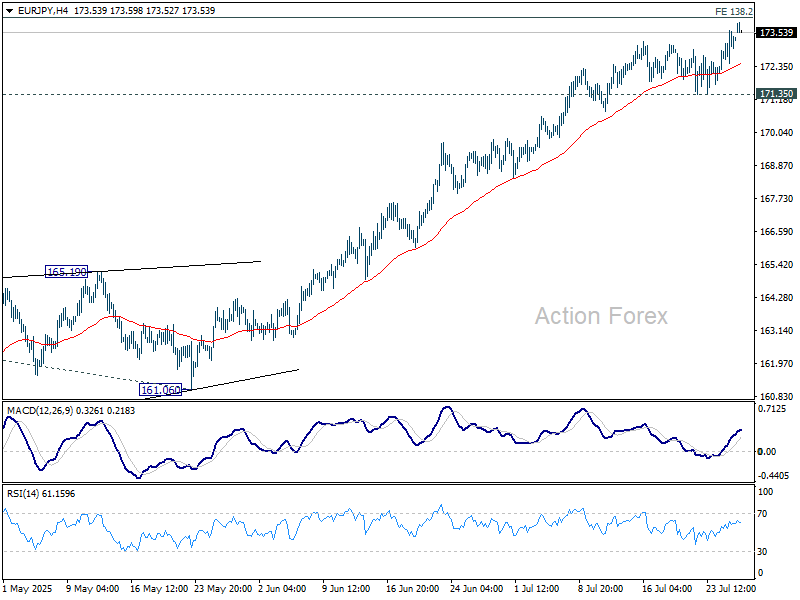
In the bigger picture, considering current strong momentum as seen in the rally from 154.77, corrective pattern from 175.41 could have already completed. Decisive break there will confirm long term up trend resumption. Next target is 61.8% projection of 124.37 to 175.41 from 154.77 at 186.31. However, rejection by 175.41, followed by firm break of 55 D EMA (now at 168.56) will delay this bullish case.
Euro Supported by Trade Deal, Eyes Turn to US-China Talks
Markets opened the week in a risk-on mood as trade developments filled the void left by a barren economic calendar. Euro gained broadly following the announcement of the US–EU framework agreement over the weekend, although upside momentum remained modest. The deal eased tariff threats and highlighted strategic cooperation, including major European energy purchases from the US.
Aussie and Kiwi also posted gains, supported by improving sentiment. In contrast, Dollar, Yen, and Swiss Franc were weaker across the board—a clear sign of waning demand for defensive assets. Loonie and Sterling were little changed, trading in the middle.
The broader market awaits a heavy slate of events later in the week, including monetary policy decisions from Fed, BoC, and BoJ. On the data front, traders will monitor GDP and inflation figures out of the US, Eurozone, Australia, and China for macro signals heading into August.
Nevertheless, immediate focus will shift to Stockholm first, where US and Chinese negotiators meet today into determine whether their fragile tariff truce can be extended beyond the looming August 12 deadline. Treasury Secretary Scott Bessent and Vice Premier He Lifeng lead the talks, which could set the tone for a possible Trump–Xi summit later this year.
Bessent has already suggested that the US is willing to delay tariff reimposition if talks progress. However, Beijing is expected to press for deeper cuts to the layered US tariffs, now totaling 55% on most Chinese goods, and for relaxation of technology export restrictions.
Parallel to the Stockholm dialogue, South Korea is reported to be pursuing an ambitious “Make American Shipbuilding Great Again” proposal to avoid the 25% US tariff. Officials from Seoul are in talks with the US this week, seeking to finalize a deal before Trump’s August 1 deadline. A cooperative framework on shipbuilding is being discussed as the centerpiece.
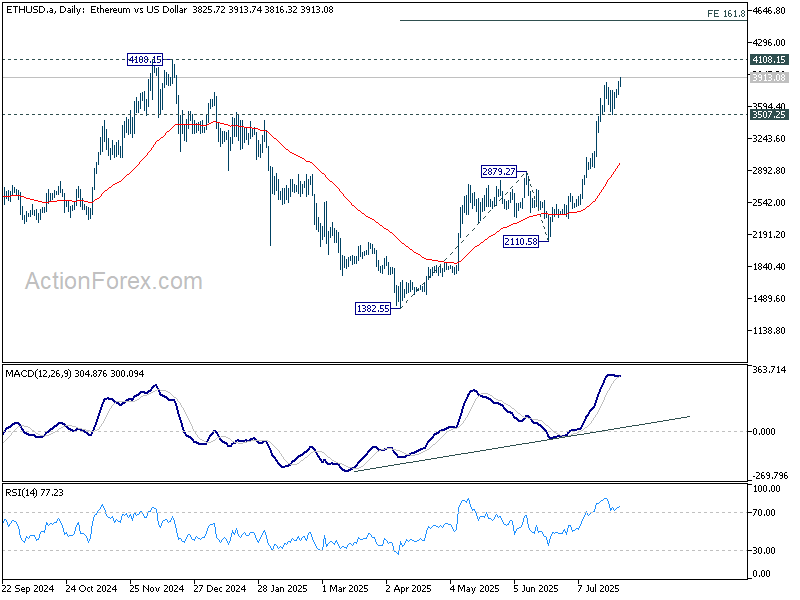
Technically, Ethereum's up trend resumed today and breaks above 3900 mark. Near term outlook will now stay bullish as long as 3507.25 support holds. Next target is 4108.15 high. Firm break there will target 161.8% projection of 1382.55 to 28179.27 from 2110.58 at 4532.27.
In Asia, at the time of writing, Nikkei is down -1.06%. Hong Kong HSI is up 0.53%. China Shanghai SSE is flat. Singapore Strait Times is down -0.24%. Japan 10-year JGB yield is down -0.04 at 1.565.
US-EU trade deal delivers Relief, Euro gains but lacks breakout momentum
In a significant breakthrough, the US and EU reached a framework trade agreement on Sunday, averting the imposition of 30% tariffs on European imports. Instead, a reduced 15% rate will apply to most goods. The two sides also agreed to exempt key strategic sectors—such as aircraft, chemicals, and some pharmaceuticals—from any tariffs entirely.
The deal also includes sweeping commitments from the EU, including USD 750B in US energy purchases and USD 600 billion in fresh US-bound investment over current levels.
EU Commission President Ursula von der Leyen called the agreement a win for “stability and predictability,” while acknowledging that the 15% tariff still presents challenges for European automakers. Meanwhile, the EU’s pivot toward US nuclear fuel and LNG also marks a decisive shift away from Russian energy dependency.
US President Donald Trump declared the deal as larger than last week's USD 550B Japan agreement and reiterated that it would significantly deepen US-EU ties across energy, defense, and trade. He claimed “hundreds of billions” in arms sales could follow.
Euro advanced broadly on the announcement, but momentum is restrained. EUR/CHF is still capped below 0.9365 resistance despite today's bounce. Firm break of this level is needed to be the first sign that consolidation pattern from 0.9445 has completed, and the rally from 0.9218 is ready to resume. Otherwise, more sideway trading would likely follow first.

Fed, BoC and BoJ to hold, as data wave hits global markets
A busy week lies ahead, packed with three central bank decisions and critical macro data. Fed, BoC and BoJ are all due to announce policy decisions, while top-tier reports on growth and inflation from the US, Eurozone, Australia, and China will shape investor expectations heading into August.
Fed is widely expected to leave interest rates unchanged at 4.25–4.50%. The key intrigue lies in whether dovish-leaning governors Christopher Waller and Michelle Bowman will formalize their views by voting for a cut, and if others on the FOMC might join them.
Futures markets are pricing in around a 65% chance of a September cut. However, Chair Powell is unlikely to pre-commit or even give any concrete guidance. Instead, traders' focus will turn to Q2 GDP advance and June PCE inflation report. July’s non-farm payrolls and ISM manufacturing data will soon follow, giving markets ample fodder to reassess the Fed outlook.
BoC is similarly expected to hold rates at 2.75%, pausing for a third time in this cycle. Earlier fears of deep recession from US tariff escalation have eased, as CUSMA exemptions ensure most Canadian exports remain duty-free.
On the other hand, Canadian inflation has surprised to the upside, challenging assumptions that weak demand would lead to faster disinflation. The BoC’s cautious stance reflects the need to see clearer signs of core inflation cooling before taking further steps.
Market consensus still leans dovish. A Reuters poll found that nearly two-thirds of economists expect a BoC cut in September, with most seeing at least two total reductions in 2025.
BoJ is also set to hold steady at 0.50%, but its outlook is evolving. Deputy Governor Uchida sounded notably upbeat last week, pointing to diminished uncertainty and stronger prospects for achieving sustained 2% inflation following the US–Japan trade pact.
BoJ will factor the trade deal into its quarterly projections this week, potentially teeing up policy tightening later in the year.
Beyond central banks, attention will also turn to Eurozone GDP and CPI, Australia's CPI and retail sales, and China’s PMIs for additional global growth signals.
Here are some highlights for the week:
- Tuesday: US goods trade balance, house price index, consumer confidence.
- Wednesday: New Zealand ANZ business confidence; Australia CPI; Eurozone GDP; Swiss KOF; US ADP employment, GDP advance, FOMC rate decision; BoC rate decision.
- Thursday: Japan industrial production, retail sales, BoJ rate decision; Australia retail sales; China NBS PMIs; Germany CPI flash, unemployment; Eurozone unemployment rate; Canada GDP; US personal income and spending, PCE inflation, Chicago PMI.
- Friday: Japan unemployment rate, PMI manufacturing final; Australia PPI; China Caixin PMI manufacturing; Eurozone PMI manufacturing final, CPI flash; UK PMI manufacturing final; US non-farm payrolls, ISM manufacturing.
EUR/JPY Daily Outlook
Daily Pivots: (S1) 172.67; (P) 173.14; (R1) 173.81; More...
EUR/JPY's rally continues today and intraday bias remains on the upside. Immediate focus is on 138.2% projection of 154.77 to 164.16 from 161.06 at 174.03. Break there will bring retest of 175.41 high. For now, near term outlook will remain bullish as long as 171.35 support holds, in case of retreat.
In the bigger picture, considering current strong momentum as seen in the rally from 154.77, corrective pattern from 175.41 could have already completed. Decisive break there will confirm long term up trend resumption. Next target is 61.8% projection of 124.37 to 175.41 from 154.77 at 186.31. However, rejection by 175.41, followed by firm break of 55 D EMA (now at 168.56) will delay this bullish case.
EUR/USD Regains Momentum But Can It Continue Higher?
Key Highlights
- EUR/USD started a fresh increase above the 1.1680 resistance zone.
- It cleared a key bearish trend line with resistance at 1.1660 on the 4-hour chart.
- GBP/USD is struggling to clear the 1.3520 and 1.3550 resistance levels.
- USD/JPY started a fresh increase above the 147.50 level.
EUR/USD Technical Analysis
The Euro formed a base above the 1.1550 level against the US Dollar. EUR/USD started a fresh increase above the 1.1660 and 1.1700 resistance levels.
Looking at the 4-hour chart, the pair settled above the 1.1700 level, the 100 simple moving average (red, 4-hour), and the 200 simple moving average (green, 4-hour). There was a clear move above the 50% Fib retracement level of the downward move from the 1.1829 swing high to the 1.1565 low.
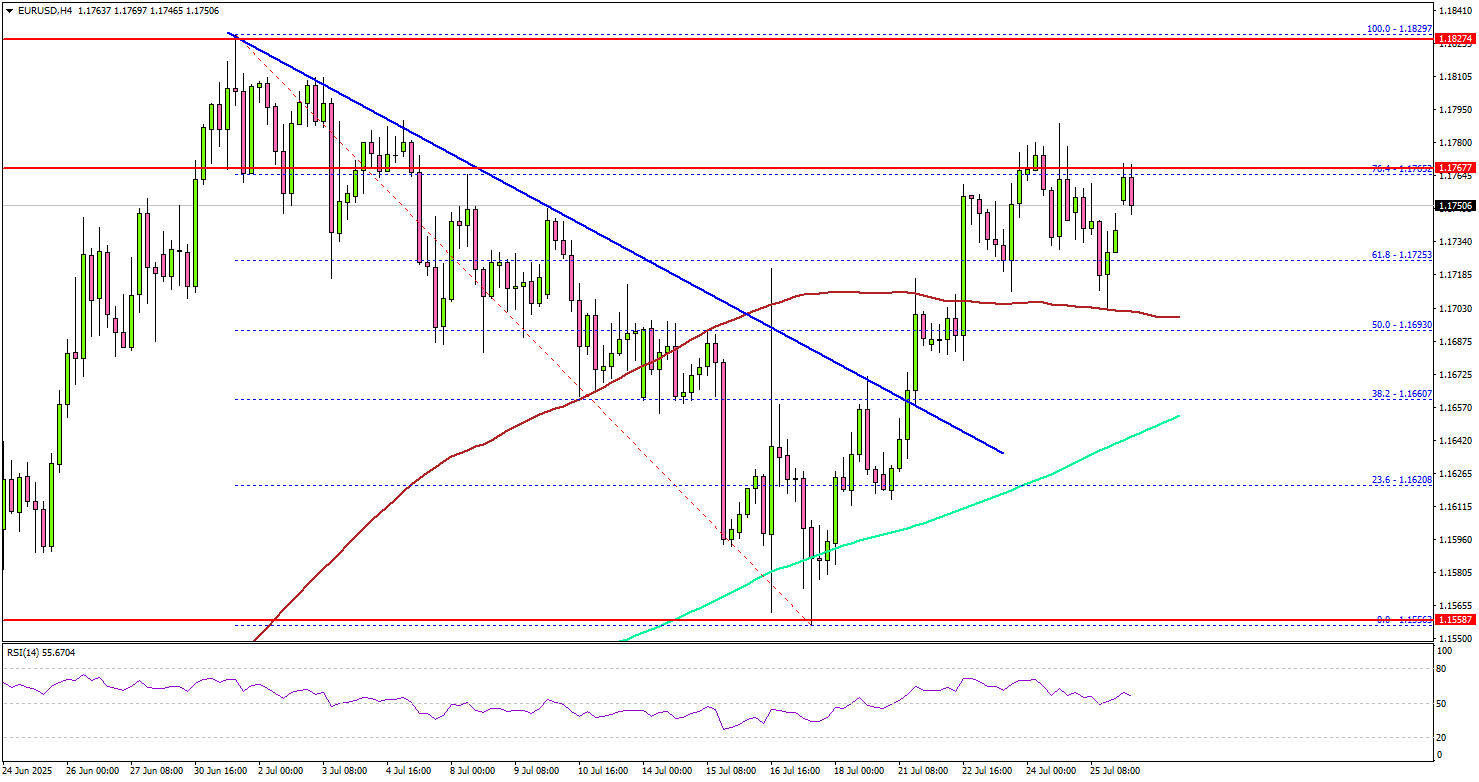
On the upside, the pair now faces resistance near the 1.1765 level. It is close to the 76.4% Fib retracement level of the downward move from the 1.1829 swing high to the 1.1565 low.
The next key resistance sits near the 1.1800 level. A close above the 1.1800 level could set the pace for another increase. In the stated case, the pair could rise toward the 1.1840 resistance. The next major stop for the bulls could be near the 1.1880 resistance.
On the downside, immediate support is near the 1.1700 level and the 100 simple moving average (red, 4-hour). The next key support sits near 1.1660. Any more losses could send the pair toward the 1.1620 support zone.
Looking at GBP/USD, the pair is showing bearish signs and might decline below the 1.3420 support zone.
Upcoming Economic Events:
- Dallas Fed Manufacturing Business Index for July 2025 – Forecast -12.0, versus -12.7 previous.