
Sample Category Title
USD/CHF Weekly Outlook
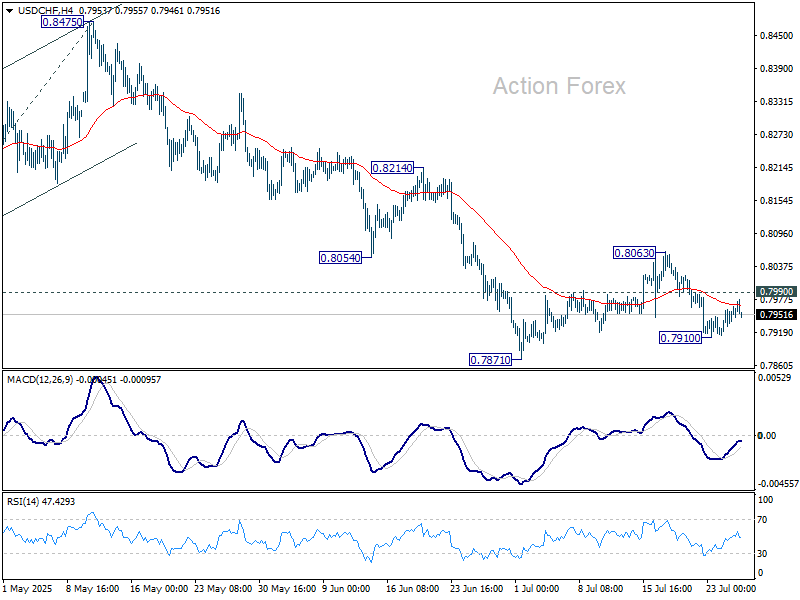
USD/CHF fell to 0.7910 last week but recovered since then. Initial bias remains neutral this week first. On the downside, below 0.7910 will bring retest of 0.7871 low. Firm break there will resume larger down trend and target 61.8% projection of 0.9200 to 0.8038 from 0.8475 at 0.7757. On the upside, break of 0.7990 minor resistance will bring stronger rebound to extend the corrective pattern from 0.7871.
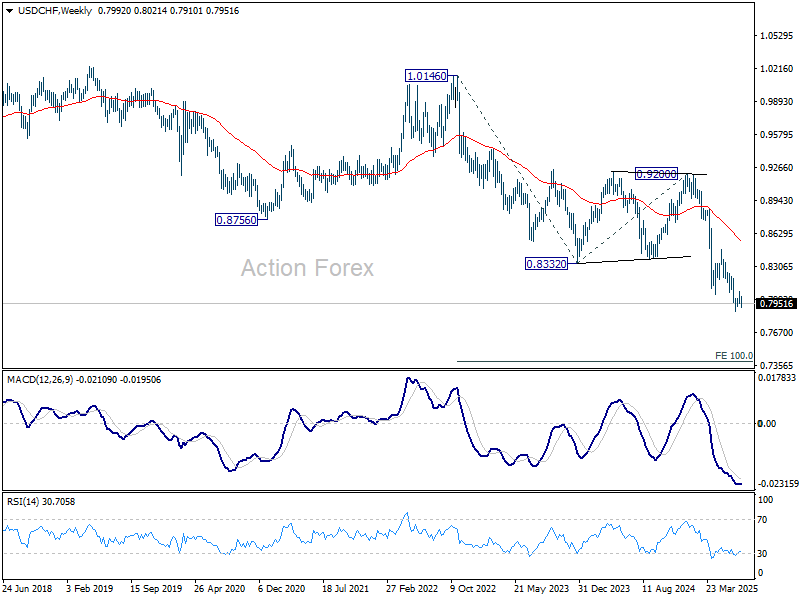
In the bigger picture, long term down trend from 1.0342 (2017 high) is still in progress. Next target is 100% projection of 1.0146 (2022 high) to 0.8332 from 0.9200 at 0.7382. In any case, outlook will stay bearish as long as 0.8475 resistance holds.

In the long term picture, price action from 0.7065 (2011 low) are seen as a corrective pattern to the multi-decade down trend from 1.8305 (2000 high). It's uncertain if the fall from 1.0342 is the second leg of the pattern, or resumption of the down trend. But in either case, outlook will stay bearish as long as 0.9200 resistance holds. Retest of 0.7065 should be seen next.

AUD/USD Weekly Report
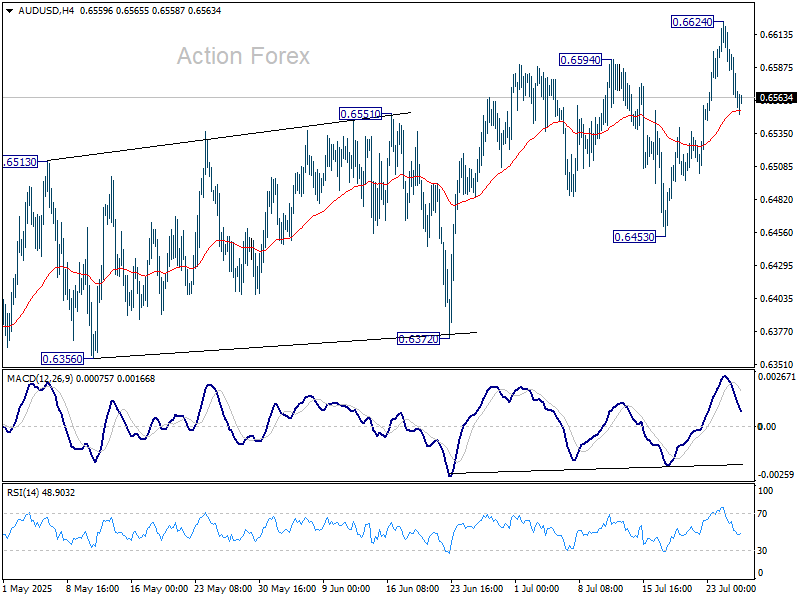
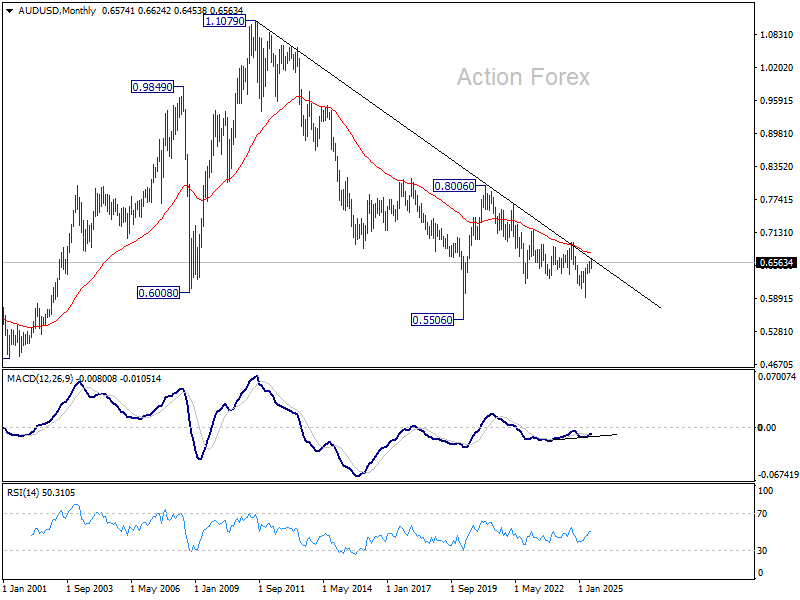
AUD/USD's rise from 0.5913 resumed to 0.6624 last week but retreated once again. Initial bias stays neutral this week first and some more consolidations could be seen. Further rise is expected as long as 0.6453 support holds. Above 0.6624 will turn bias back to the upside. However, considering bearish divergence condition in D MACD, upside should be limited by 0.6713 fibonacci level on next rise.
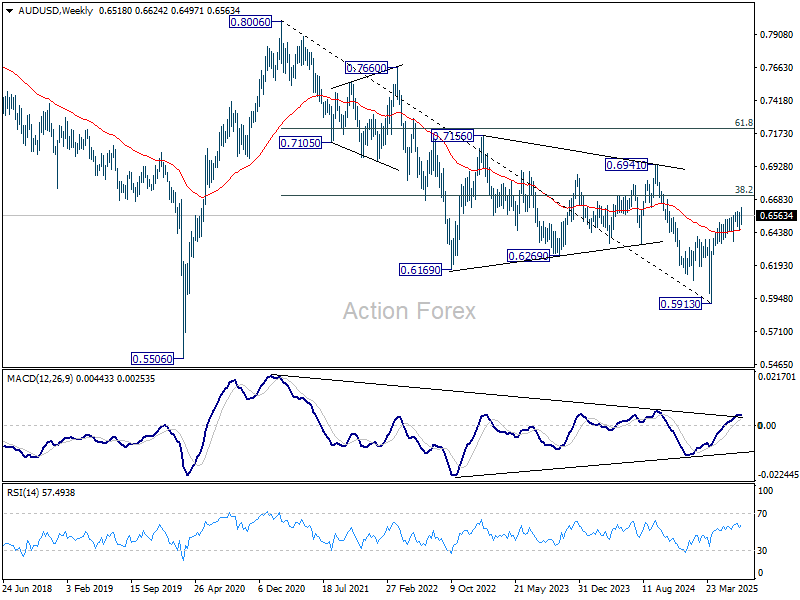
In the bigger picture, there is no clear sign that down trend from 0.8006 (2021 high) has completed. Rebound from 0.5913 is seen as a corrective move. While stronger rally cannot be ruled out, outlook will remain bearish as long as 38.2% retracement of 0.8006 to 0.5913 at 0.6713 holds. Nevertheless, considering bullish convergence condition in W MACD, even in case of another fall through 0.5913, downside should be contained above 0.5506 (2020 low).

In the long term picture, fall from 0.8006 is seen as the second leg of the corrective pattern from 0.5506 long term bottom (2020 low). Hence, in case of deeper decline, strong support should emerge above 0.5506 to contain downside to bring reversal. On the upside, firm break of 0.6941 will argue that the third leg has already started back to 0.8006.
USD/CAD Weekly Outlook
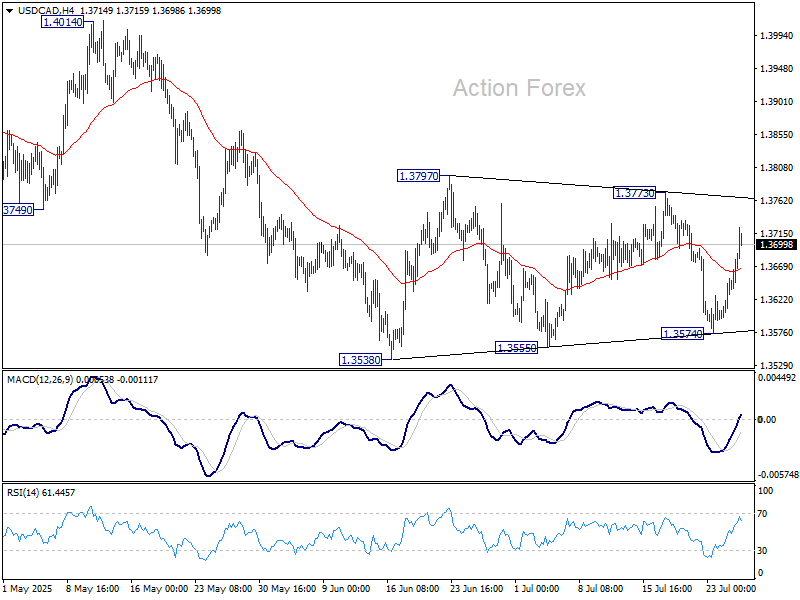
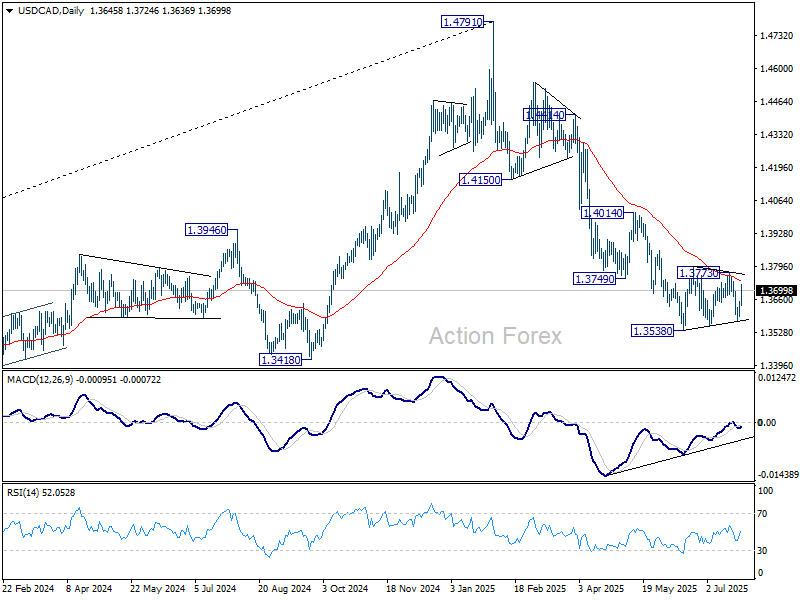
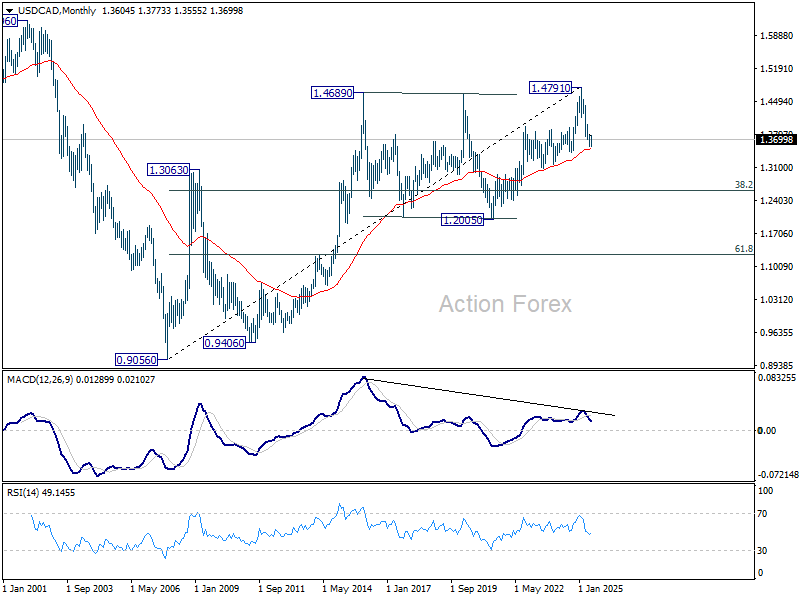
USD/CAD dived to 1.3574 last week but rebounded strongly from there. Initial bias remains neutral this week first. Outlook will stay bearish as long as 1.3773 resistance holds. Break of 1.3574 will argue that consolidation pattern from 1.3538 has completed. And larger fall from 1.4791 is ready to resume through 1.3538. However, firm break of 1.3773 will argue that it's now correcting the whole fall from 1.4791 and target 1.4014 resistance instead.
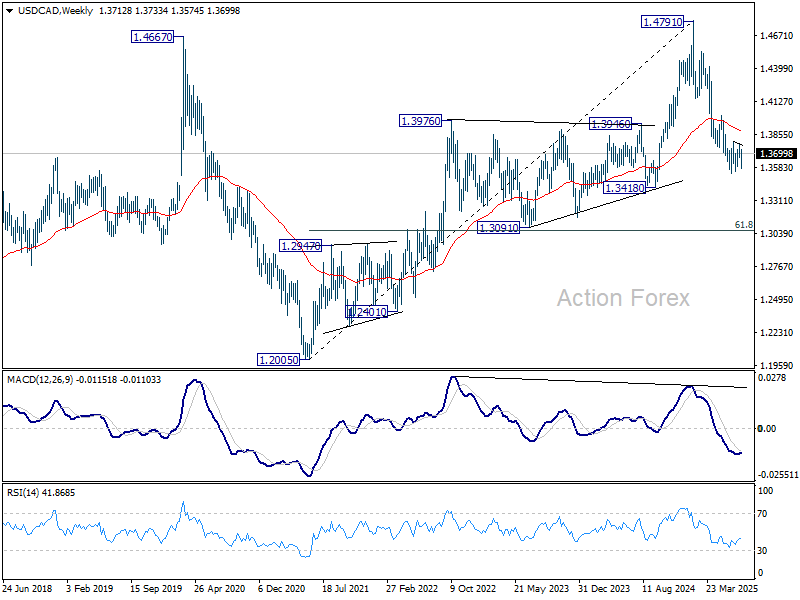
In the bigger picture, price actions from 1.4791 medium term top could either be a correction to rise from 1.2005 (2021 low), or trend reversal. In either case, further decline is expected as long as 1.4014 resistance holds. Next target is 61.8% retracement of 1.2005 (2021 low) to 1.4791 at 1.3069.
In the long term picture, as long as 55 M EMA (now at 1.3498) holds, up trend from 0.9056 (2007 low) should still resume through 1.4791 at a later stage. However, sustained trading below 55 M EMA will argue that the up trend has already completed, with rise from 1.2005 to 1.4791 as the fifth wave. 1.4791 would then be seen as a long term top and deeper medium term down trend should then follow.
GBP/JPY Weekly Outlook
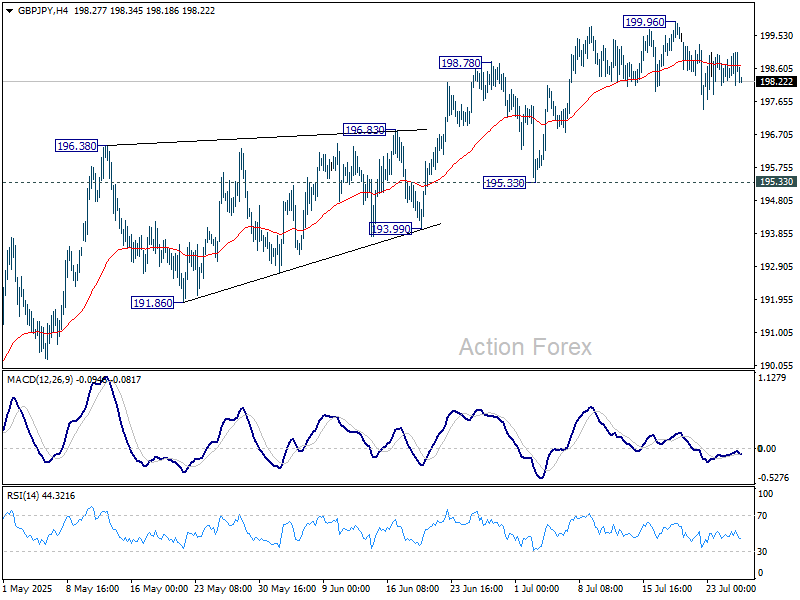
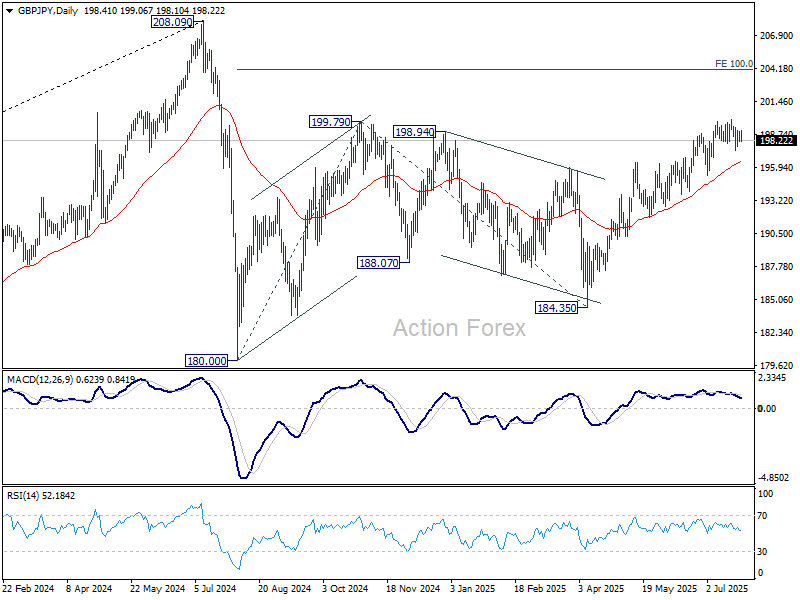
GBP/JPY stayed in range below 199.96 last week and outlook is unchanged. Initial bias remains neutral this week for more consolidations. While deeper pullback might be seen, outlook will stay bullish as long as 195.33 support holds. Break of 199.96 will resume the rise from 184.35 to 100% projection of 180.00 to 199.79 from 184.35 at 204.14.
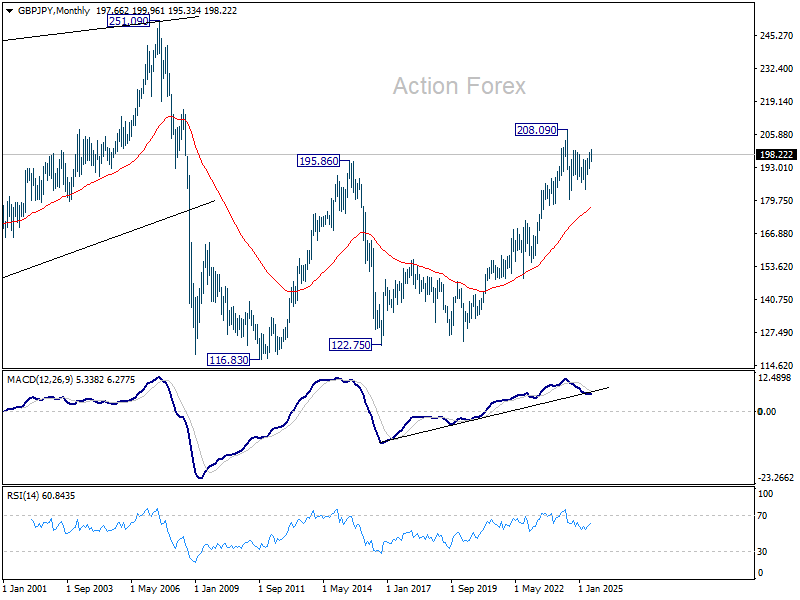
In the bigger picture, price actions from 208.09 (2024 high) are seen as a correction to rally from 123.94 (2020 low). The pattern might still extend with another falling leg. But in that case, strong support should be seen from 38.2% retracement of 123.94 to 208.09 at 175.94 to contain downside. Meanwhile, decisive break of 208.09 will confirm long term up trend resumption.
In the long term picture, there is no sign that the long term up trend from 122.75 (2016 low) has concluded. But firm break of 208.09 is needed to confirm resumption. Otherwise, more medium term range trading could still be seen.

EUR/JPY Weekly Outlook
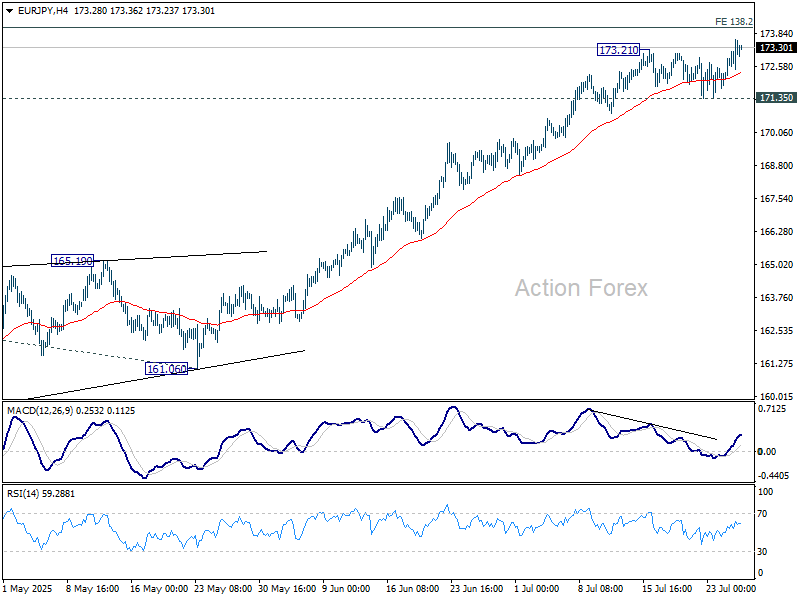
EUR/JPY's consolidations from 173.21 completed late last week with upside breakout. Initial bias is back on the upside this week for 138.2% projection of 154.77 to 164.16 from 161.06 at 174.03. Break there will bring retest of 175.41 high. For now, near term outlook will remain bullish as long as 171.35 support holds, in case of retreat.
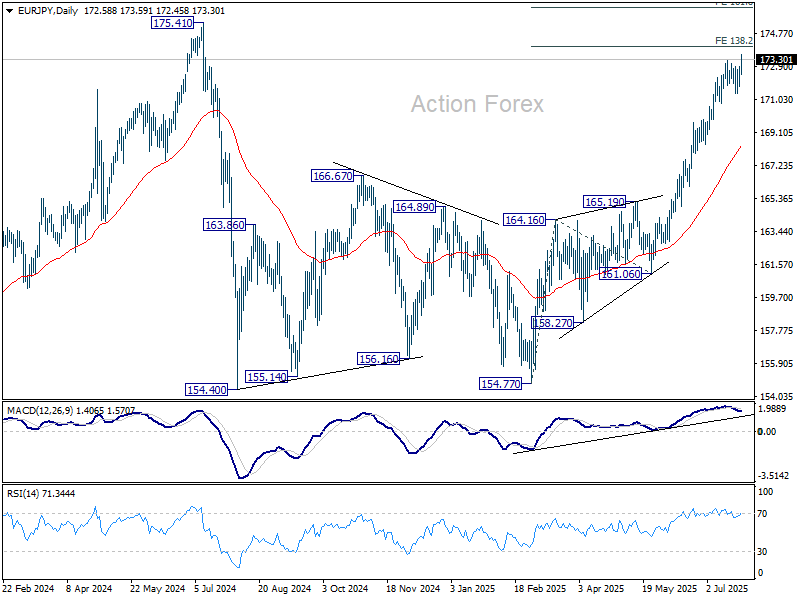
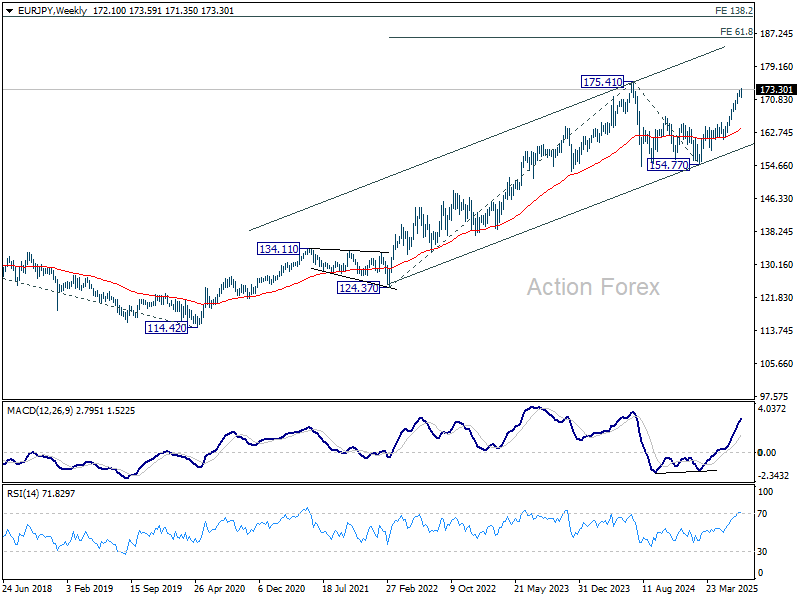
In the bigger picture, considering current strong momentum as seen in the rally from 154.77, corrective pattern from 175.41 could have already completed. Decisive break there will confirm long term up trend resumption. Next target is 61.8% projection of 124.37 to 175.41 from 154.77 at 186.31. However, rejection by 175.41, followed by firm break of 55 D EMA (now at 168.37) will delay this bullish case.
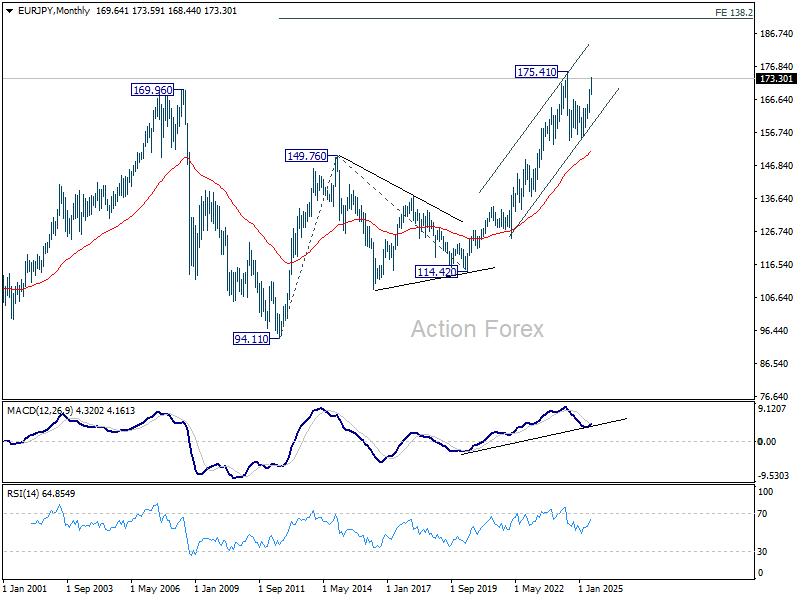
In the long term picture, up trend fro 94.11 (2021 low) is still in progress. On resumption, next target is 138.2% projection of 94.11 to 149.76 (2014 high) from 114.42 (2020 low) at 191.32.
EUR/GBP Weekly Outlook
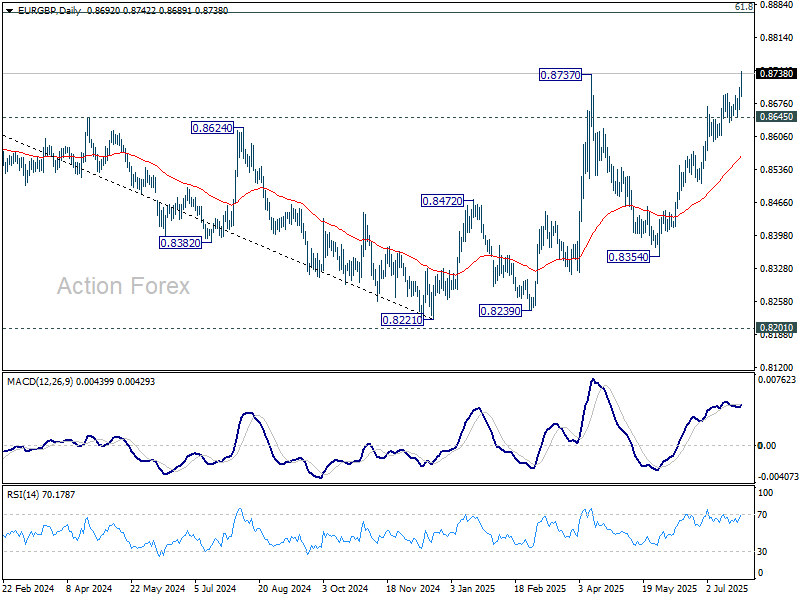
EUR/GBP's rally from 0.8354 continued last week and breached 0.8737 resistance before closing strongly. Initial bias stays on the upside this week. Sustained trading above 0.8737 will resume the whole rise from 0.8221. Next target is 0.8867 fibonacci level. For now, outlook will stay bullish as long as 0.8645 support holds, in case of retreat.
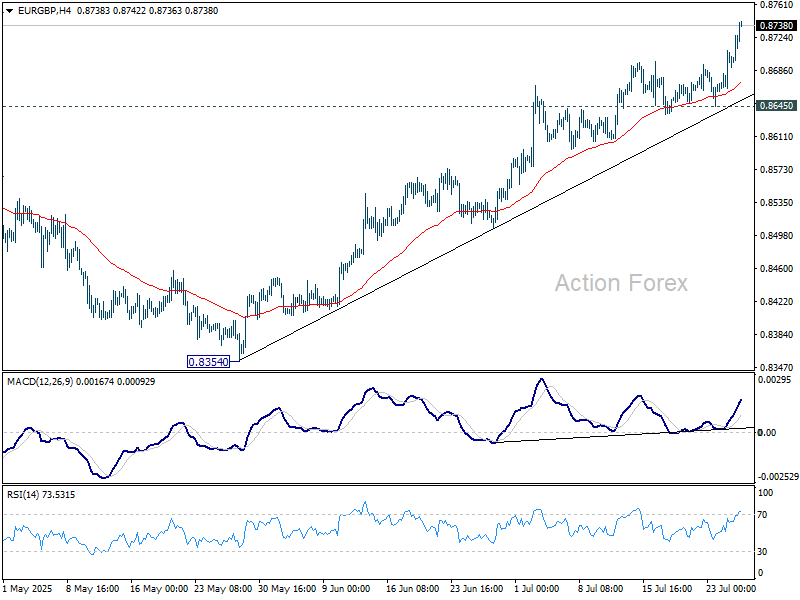
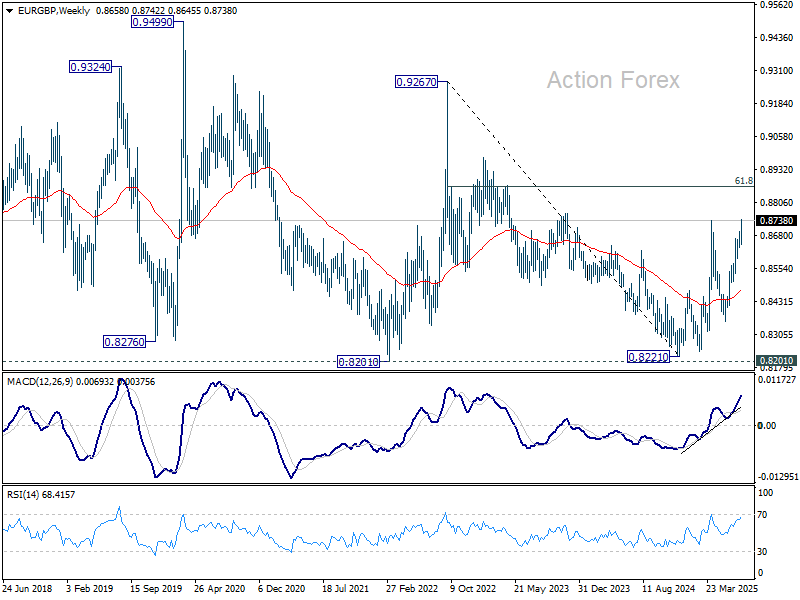
In the bigger picture, the structure from 0.8221 medium term bottom are not impulsive enough to suggest that it's reversing the down trend from 0.9267 (2022 high). But even if it's a correction, further rise is expected to 61.8% retracement of 0.9267 to 0.8221 at 0.8867. This will remain the favored case as long as 55 W EMA (now at 0.8476) holds.
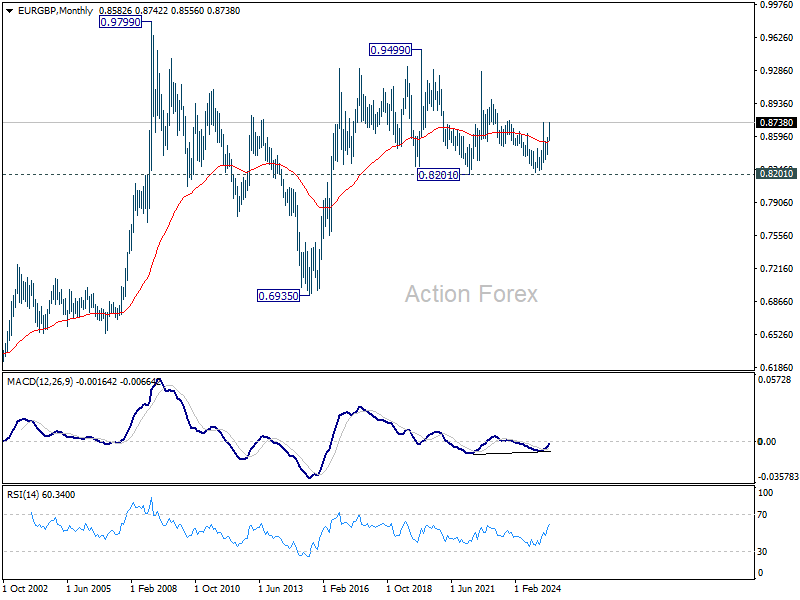
In the long term picture, price action from 0.9499 (2020 high) is seen as part of the long term range pattern from 0.9799 (2008 high). Range trading should continue between 0.8201 and 0.9499, until there is clear signal of imminent breakout.
EUR/AUD Weekly Outlook
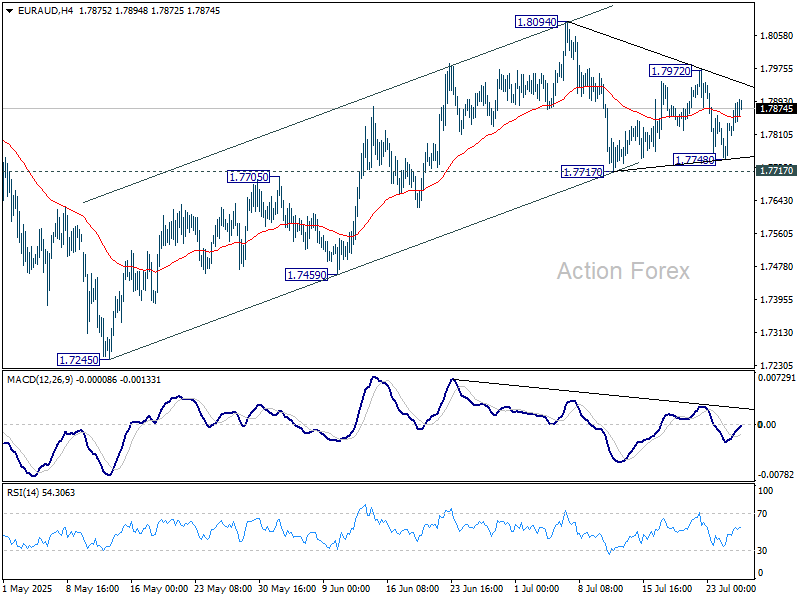
EUR/AUD's rebound was limited well below 1.8094 resistance as sideway trading extended. Initial bias remains neutral this week first, and further rally is expected as long as 1.7717 support holds. On the upside, above 1.7972 will bring retest of 1.8094. Firm break there will resume the rise from 1.7245 to towards 1.8554 high. However, break of 1.7717 support will revive the case that rise from 1.7245 has completed. Corrective pattern from 1.8554 should have then started the third leg.
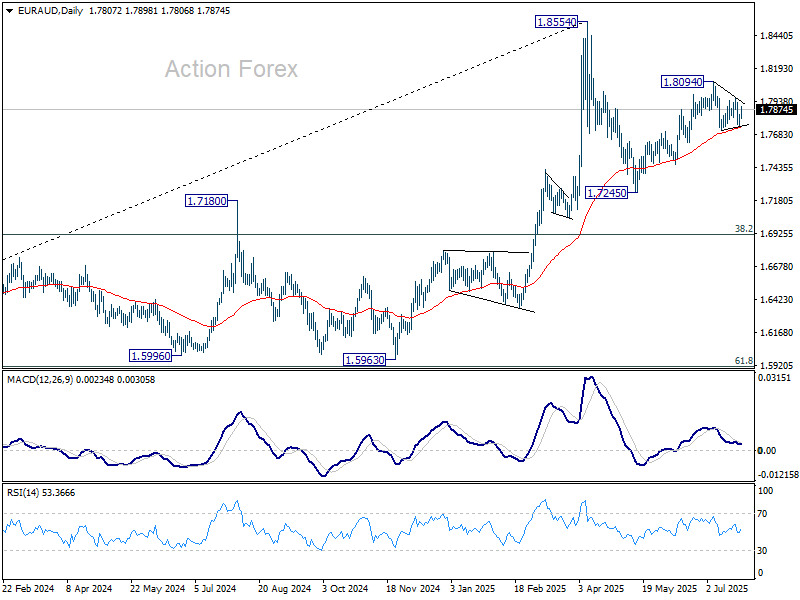
In the bigger picture, price actions from 1.8554 medium term top are seen as a corrective pattern. While deeper pullback might be seen, downside should be contained by 38.2% retracement of 1.4281 (2022 low) to 1.8554 at 1.6922 to bring rebound. Up trend from 1.4281 is expected to resume at a later stage.
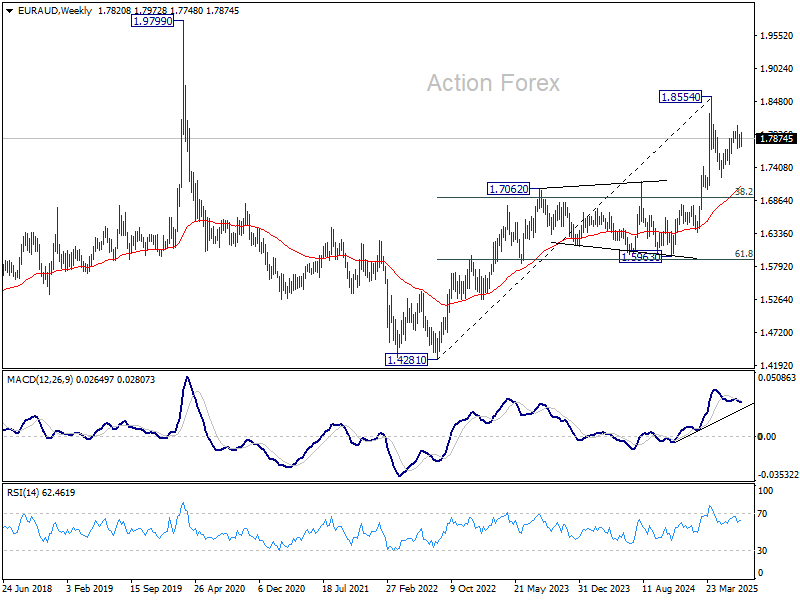
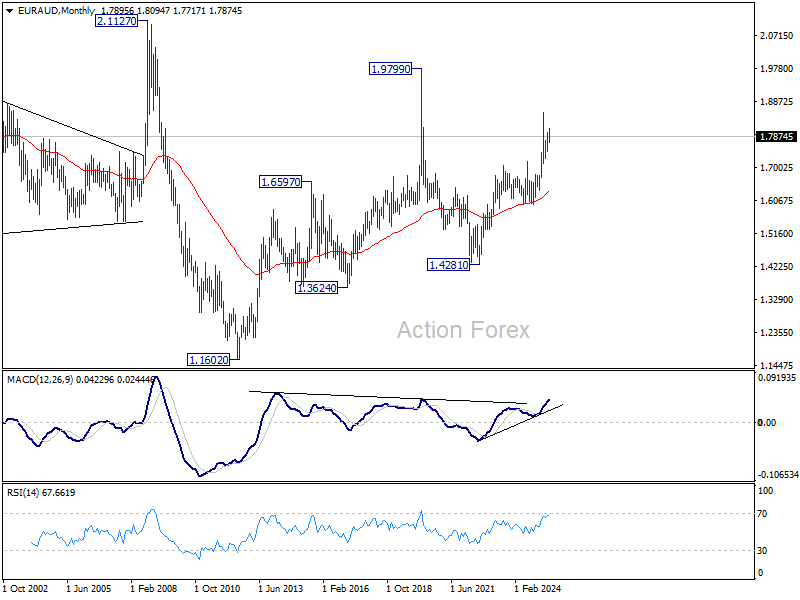
In the longer term picture, rise from 1.4281 is seen as the second leg of the pattern from 1.9799 (2020 high), which is part of the pattern from 2.1127 (2008 high). As long as 55 M EMA (now at 1.6365) holds, this second leg could still extend higher.
EUR/CHF Weekly Outlook
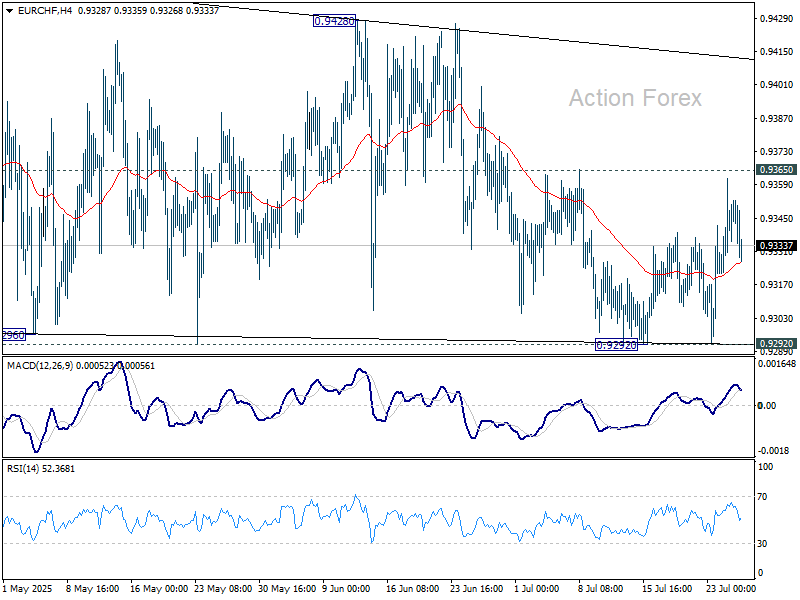
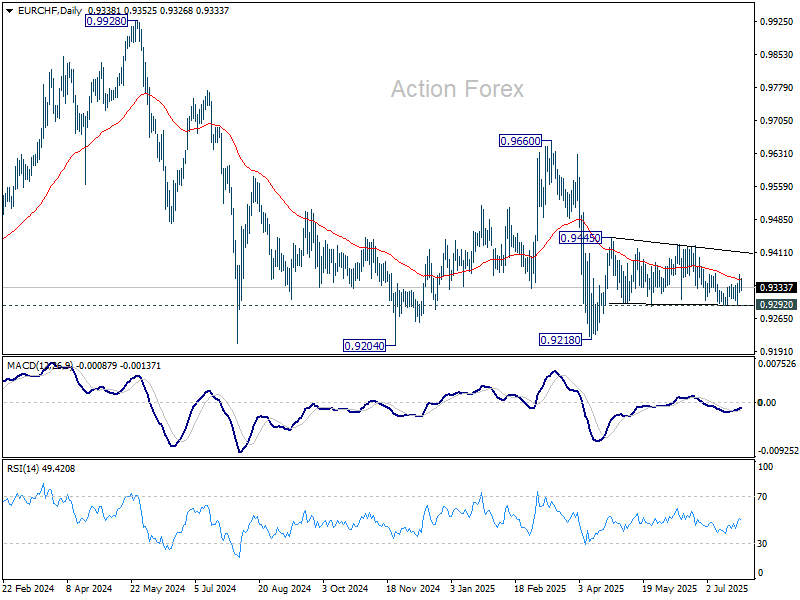
EUR/CHF bounced after dipping to 0.9292 last week but lost momentum ahead of 0.9365 resistance. Initial bias stays neutral this week first. On the upside, firm break of 0.9365 will be he first sign that corrective pattern from 0.9445 has already completed. Further rise should then be seen to 0.9428/45 resistance zone. Firm break there will resume the rebound from 0.9218 low. However, firm break of 0.9292 will bring retest of 0.9218 instead.
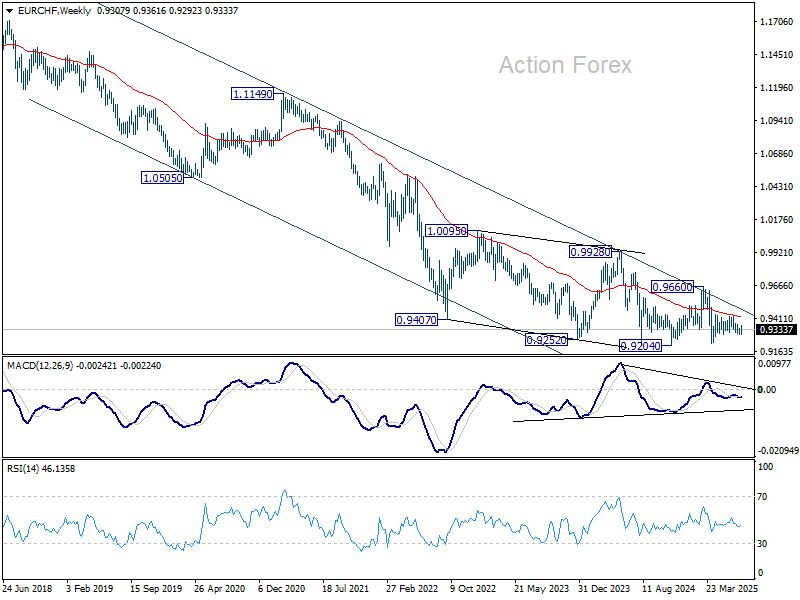
In the bigger picture, while downside momentum has been diminishing as seen in W MACD, there is no sign of bottoming yet. EUR/CHF is still staying below 55 W EMA (now at 0.9424) and well inside long term falling channel. Outlook will stay bearish as long as 0.9660 resistance holds. Break of 0.9204 (2024 low) will confirm resumption of down trend from 1.2004 (2018 high).
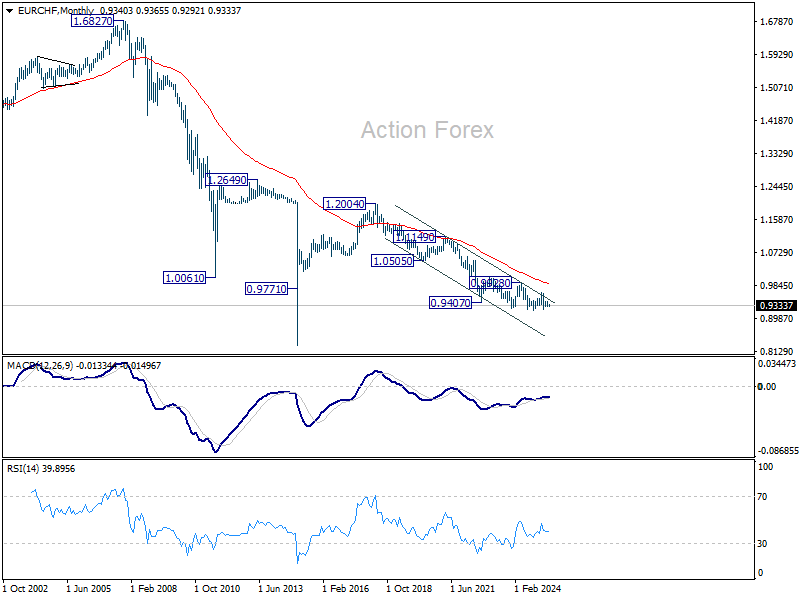
In the long term picture, overall long term down trend is still in progress in EUR/CHF. Outlook will continue to stay bearish as long as 55 M EMA (now at 0.9877) holds.
Summary 7/28 – 8/1
Monday, Jul 28, 2025
| GMT | Ccy | Events | Consensus | Previous |
|---|---|---|---|---|
| 10:00 | GBP | CBI Realized Sales Jul | -28 | -46 |
| 23:01 | GBP | BRC Shop Price Index Y/Y Jul | 0.20% | 0.40% |
| GMT | Ccy | Events | |
|---|---|---|---|
| 10:00 | GBP | CBI Realized Sales Jul | |
| Forecast: -28 | Previous: -46 | ||
| 23:01 | GBP | BRC Shop Price Index Y/Y Jul | |
| Forecast: 0.20% | Previous: 0.40% | ||
Tuesday, Jul 29, 2025
| GMT | Ccy | Events | Consensus | Previous |
|---|---|---|---|---|
| 08:30 | GBP | M4 Money Supply M/M Jun | 0.30% | 0.20% |
| 08:30 | GBP | Mortgage Approvals Jun | 63K | 63K |
| 12:30 | USD | Goods Trade Balance (USD) Jun P | -98.3B | -96.4B |
| 12:30 | USD | Wholesale Inventories Jun P | -0.10% | -0.30% |
| 13:00 | USD | S&P/CS Composite-20 HPI Y/Y May | 2.90% | 3.40% |
| 13:00 | USD | Housing Price Index M/M May | -0.20% | -0.40% |
| 14:00 | USD | Consumer Confidence Jul | 95.9 | 93 |
| GMT | Ccy | Events | |
|---|---|---|---|
| 08:30 | GBP | M4 Money Supply M/M Jun | |
| Forecast: 0.30% | Previous: 0.20% | ||
| 08:30 | GBP | Mortgage Approvals Jun | |
| Forecast: 63K | Previous: 63K | ||
| 12:30 | USD | Goods Trade Balance (USD) Jun P | |
| Forecast: -98.3B | Previous: -96.4B | ||
| 12:30 | USD | Wholesale Inventories Jun P | |
| Forecast: -0.10% | Previous: -0.30% | ||
| 13:00 | USD | S&P/CS Composite-20 HPI Y/Y May | |
| Forecast: 2.90% | Previous: 3.40% | ||
| 13:00 | USD | Housing Price Index M/M May | |
| Forecast: -0.20% | Previous: -0.40% | ||
| 14:00 | USD | Consumer Confidence Jul | |
| Forecast: 95.9 | Previous: 93 | ||
Wednesday, Jul 30, 2025
| GMT | Ccy | Events | Consensus | Previous |
|---|---|---|---|---|
| 01:00 | NZD | ANZ Business Confidence Jul | 46.3 | |
| 01:00 | NZD | ANZ Activity Outlook Jul | 40.9 | |
| 01:30 | AUD | Monthly CPI Y/Y Jun | 2.10% | 2.10% |
| 01:30 | AUD | CPI Q/Q Q2 | 0.80% | 0.90% |
| 01:30 | AUD | CPI Y/Y Q2 | 2.20% | 2.40% |
| 01:30 | AUD | Trimmed Mean CPI Q/Q Q2 | 0.70% | 0.70% |
| 01:30 | AUD | Trimmed Mean CPI Y/Y Q2 | 2.90% | |
| 05:30 | EUR | France Consumer Spending M/M Jun | -0.30% | 0.20% |
| 05:30 | EUR | France GDP Q/Q Q2 P | 0.10% | 0.10% |
| 06:00 | EUR | Germany Retail Sales M/M Jun | 0.50% | -1.60% |
| 06:00 | EUR | Germany GDP Q/Q Q2 P | -0.10% | 0.40% |
| 08:00 | CHF | UBS Economic Expectations Jul | -2.1 | |
| 09:00 | EUR | Eurozone GDP Q/Q Q2 P | 0.00% | 0.60% |
| 09:00 | EUR | Eurozone Economic Sentiment Jul | 94.8 | 94 |
| 09:00 | EUR | Eurozone Industrial Confidence Jul | -11 | -12 |
| 09:00 | EUR | Eurozone Consumer Confidence Jul | -14.7 | -14.7 |
| 09:00 | EUR | Eurozone Services Sentiment Jul | 3.4 | 2.9 |
| 12:15 | USD | ADP Employment Change Jul | 75K | -33K |
| 12:30 | USD | GDP Annualized Q2 P | 2.40% | -0.50% |
| 12:30 | USD | GDP Price Index Q2 P | 2.30% | 3.80% |
| 13:45 | CAD | BoC Interest Rate Decision | 2.75% | 2.75% |
| 14:00 | USD | Pending Home Sales M/M Jun | 0.30% | 1.80% |
| 14:30 | CAD | BoC Press Conference | ||
| 14:30 | USD | Crude Oil Inventories | -3.2M | |
| 18:00 | USD | Fed Interest Rate Decision | 4.50% | 4.50% |
| 18:30 | USD | FOMC Press Conference | ||
| 23:50 | JPY | Industrial Production M/M Jun P | -0.70% | -0.10% |
| 23:50 | JPY | Retail Trade Y/Y Jun | 1.80% | 1.90% |
| GMT | Ccy | Events | |
|---|---|---|---|
| 01:00 | NZD | ANZ Business Confidence Jul | |
| Forecast: | Previous: 46.3 | ||
| 01:00 | NZD | ANZ Activity Outlook Jul | |
| Forecast: | Previous: 40.9 | ||
| 01:30 | AUD | Monthly CPI Y/Y Jun | |
| Forecast: 2.10% | Previous: 2.10% | ||
| 01:30 | AUD | CPI Q/Q Q2 | |
| Forecast: 0.80% | Previous: 0.90% | ||
| 01:30 | AUD | CPI Y/Y Q2 | |
| Forecast: 2.20% | Previous: 2.40% | ||
| 01:30 | AUD | Trimmed Mean CPI Q/Q Q2 | |
| Forecast: 0.70% | Previous: 0.70% | ||
| 01:30 | AUD | Trimmed Mean CPI Y/Y Q2 | |
| Forecast: | Previous: 2.90% | ||
| 05:30 | EUR | France Consumer Spending M/M Jun | |
| Forecast: -0.30% | Previous: 0.20% | ||
| 05:30 | EUR | France GDP Q/Q Q2 P | |
| Forecast: 0.10% | Previous: 0.10% | ||
| 06:00 | EUR | Germany Retail Sales M/M Jun | |
| Forecast: 0.50% | Previous: -1.60% | ||
| 06:00 | EUR | Germany GDP Q/Q Q2 P | |
| Forecast: -0.10% | Previous: 0.40% | ||
| 08:00 | CHF | UBS Economic Expectations Jul | |
| Forecast: | Previous: -2.1 | ||
| 09:00 | EUR | Eurozone GDP Q/Q Q2 P | |
| Forecast: 0.00% | Previous: 0.60% | ||
| 09:00 | EUR | Eurozone Economic Sentiment Jul | |
| Forecast: 94.8 | Previous: 94 | ||
| 09:00 | EUR | Eurozone Industrial Confidence Jul | |
| Forecast: -11 | Previous: -12 | ||
| 09:00 | EUR | Eurozone Consumer Confidence Jul | |
| Forecast: -14.7 | Previous: -14.7 | ||
| 09:00 | EUR | Eurozone Services Sentiment Jul | |
| Forecast: 3.4 | Previous: 2.9 | ||
| 12:15 | USD | ADP Employment Change Jul | |
| Forecast: 75K | Previous: -33K | ||
| 12:30 | USD | GDP Annualized Q2 P | |
| Forecast: 2.40% | Previous: -0.50% | ||
| 12:30 | USD | GDP Price Index Q2 P | |
| Forecast: 2.30% | Previous: 3.80% | ||
| 13:45 | CAD | BoC Interest Rate Decision | |
| Forecast: 2.75% | Previous: 2.75% | ||
| 14:00 | USD | Pending Home Sales M/M Jun | |
| Forecast: 0.30% | Previous: 1.80% | ||
| 14:30 | CAD | BoC Press Conference | |
| Forecast: | Previous: | ||
| 14:30 | USD | Crude Oil Inventories | |
| Forecast: | Previous: -3.2M | ||
| 18:00 | USD | Fed Interest Rate Decision | |
| Forecast: 4.50% | Previous: 4.50% | ||
| 18:30 | USD | FOMC Press Conference | |
| Forecast: | Previous: | ||
| 23:50 | JPY | Industrial Production M/M Jun P | |
| Forecast: -0.70% | Previous: -0.10% | ||
| 23:50 | JPY | Retail Trade Y/Y Jun | |
| Forecast: 1.80% | Previous: 1.90% | ||
Thursday, Jul 31, 2025
| GMT | Ccy | Events | Consensus | Previous |
|---|---|---|---|---|
| JPY | BoJ Interest Rate Decision | 0.50% | 0.50% | |
| 01:30 | AUD | Retail Sales M/M Jun | 0.40% | 0.20% |
| 01:30 | AUD | Private Sector Credit M/M Jun | 0.50% | 0.50% |
| 01:30 | AUD | Import Price Index Q/Q Q2 | -0.30% | 3.30% |
| 01:30 | AUD | Building Permits M/M Jun | 1.90% | 3.20% |
| 01:30 | CNY | NBS Manufacturing PMI Jul | 49.7 | 49.7 |
| 01:30 | CNY | NBS Non-Manufacturing PMI Jul | 50.3 | 50.5 |
| 01:30 | AUD | Building Permits Y/Y Jun | 6.50% | |
| 05:00 | JPY | Housing Starts Y/Y Jun | -34.40% | |
| 05:00 | JPY | Construction Orders Y/Y Jun | -16.30% | 14% |
| 05:00 | JPY | Consumer Confidence Index Jul | 35.2 | 34.5 |
| 06:00 | EUR | Germany Import Price Index M/M Jun | -0.20% | -0.70% |
| 06:30 | CHF | Real Retail Sales Y/Y Jun | 0.20% | 0.00% |
| 07:00 | CHF | KOF Leading Indicator Jul | 96.1 | |
| 07:55 | EUR | Germany Unemployment Change Jun | 15K | 11K |
| 07:55 | EUR | Germany Unemployment Rate Jun | 6.40% | 6.30% |
| 09:00 | EUR | Eurozone Unemployment Rate Jun | 6.30% | 6.30% |
| 12:00 | EUR | Germany CPI M/M Jul P | 0.20% | 0.00% |
| 12:00 | EUR | Germany CPI Y/Y Jul P | 1.80% | 2.00% |
| 12:30 | CAD | GDP M/M May | -0.10% | -0.10% |
| 12:30 | USD | Initial Jobless Claims (Jul 25) | 220K | 217K |
| 12:30 | USD | Personal Income M/M Jun | 0.20% | -0.40% |
| 12:30 | USD | Personal Spending Jun | 0.40% | -0.10% |
| 12:30 | USD | PCE Price Index M/M Jun | 0.30% | 0.10% |
| 12:30 | USD | PCE Price Index Y/Y Jun | 2.30% | |
| 12:30 | USD | Core PCE Price Index M/M Jun | 0.30% | 0.20% |
| 12:30 | USD | Core PCE Price Index Y/Y Jun | 2.70% | |
| 12:30 | USD | Employment Cost Index Q2 | 0.80% | 0.90% |
| 13:45 | USD | Chicago PMI Jul | 41.2 | 40.4 |
| 14:30 | USD | Natural Gas Storage | 23B | |
| 22:45 | NZD | Building Permits M/M Jun | 10.40% | |
| 23:30 | JPY | Unemployment Rate Jun | 2.50% | 2.50% |
| GMT | Ccy | Events | |
|---|---|---|---|
| JPY | BoJ Interest Rate Decision | ||
| Forecast: 0.50% | Previous: 0.50% | ||
| 01:30 | AUD | Retail Sales M/M Jun | |
| Forecast: 0.40% | Previous: 0.20% | ||
| 01:30 | AUD | Private Sector Credit M/M Jun | |
| Forecast: 0.50% | Previous: 0.50% | ||
| 01:30 | AUD | Import Price Index Q/Q Q2 | |
| Forecast: -0.30% | Previous: 3.30% | ||
| 01:30 | AUD | Building Permits M/M Jun | |
| Forecast: 1.90% | Previous: 3.20% | ||
| 01:30 | CNY | NBS Manufacturing PMI Jul | |
| Forecast: 49.7 | Previous: 49.7 | ||
| 01:30 | CNY | NBS Non-Manufacturing PMI Jul | |
| Forecast: 50.3 | Previous: 50.5 | ||
| 01:30 | AUD | Building Permits Y/Y Jun | |
| Forecast: | Previous: 6.50% | ||
| 05:00 | JPY | Housing Starts Y/Y Jun | |
| Forecast: | Previous: -34.40% | ||
| 05:00 | JPY | Construction Orders Y/Y Jun | |
| Forecast: -16.30% | Previous: 14% | ||
| 05:00 | JPY | Consumer Confidence Index Jul | |
| Forecast: 35.2 | Previous: 34.5 | ||
| 06:00 | EUR | Germany Import Price Index M/M Jun | |
| Forecast: -0.20% | Previous: -0.70% | ||
| 06:30 | CHF | Real Retail Sales Y/Y Jun | |
| Forecast: 0.20% | Previous: 0.00% | ||
| 07:00 | CHF | KOF Leading Indicator Jul | |
| Forecast: | Previous: 96.1 | ||
| 07:55 | EUR | Germany Unemployment Change Jun | |
| Forecast: 15K | Previous: 11K | ||
| 07:55 | EUR | Germany Unemployment Rate Jun | |
| Forecast: 6.40% | Previous: 6.30% | ||
| 09:00 | EUR | Eurozone Unemployment Rate Jun | |
| Forecast: 6.30% | Previous: 6.30% | ||
| 12:00 | EUR | Germany CPI M/M Jul P | |
| Forecast: 0.20% | Previous: 0.00% | ||
| 12:00 | EUR | Germany CPI Y/Y Jul P | |
| Forecast: 1.80% | Previous: 2.00% | ||
| 12:30 | CAD | GDP M/M May | |
| Forecast: -0.10% | Previous: -0.10% | ||
| 12:30 | USD | Initial Jobless Claims (Jul 25) | |
| Forecast: 220K | Previous: 217K | ||
| 12:30 | USD | Personal Income M/M Jun | |
| Forecast: 0.20% | Previous: -0.40% | ||
| 12:30 | USD | Personal Spending Jun | |
| Forecast: 0.40% | Previous: -0.10% | ||
| 12:30 | USD | PCE Price Index M/M Jun | |
| Forecast: 0.30% | Previous: 0.10% | ||
| 12:30 | USD | PCE Price Index Y/Y Jun | |
| Forecast: | Previous: 2.30% | ||
| 12:30 | USD | Core PCE Price Index M/M Jun | |
| Forecast: 0.30% | Previous: 0.20% | ||
| 12:30 | USD | Core PCE Price Index Y/Y Jun | |
| Forecast: | Previous: 2.70% | ||
| 12:30 | USD | Employment Cost Index Q2 | |
| Forecast: 0.80% | Previous: 0.90% | ||
| 13:45 | USD | Chicago PMI Jul | |
| Forecast: 41.2 | Previous: 40.4 | ||
| 14:30 | USD | Natural Gas Storage | |
| Forecast: | Previous: 23B | ||
| 22:45 | NZD | Building Permits M/M Jun | |
| Forecast: | Previous: 10.40% | ||
| 23:30 | JPY | Unemployment Rate Jun | |
| Forecast: 2.50% | Previous: 2.50% | ||
Friday, Aug 1, 2025
| GMT | Ccy | Events | Consensus | Previous |
|---|---|---|---|---|
| 01:30 | AUD | PPI Q/Q Q2 | 0.90% | |
| 01:30 | AUD | PPI Y/Y Q2 | 3.70% | |
| 01:45 | CNY | Caixin Manufacturing PMI Jul | 50.2 | 50.4 |
| 07:50 | EUR | France Manufacturing PMI Jul F | 48.4 | 48.4 |
| 07:55 | EUR | Germany Manufacturing PMI Jul F | 49.2 | 49.2 |
| 08:00 | EUR | Eurozone Manufacturing PMI Jul F | 49.8 | 49.8 |
| 08:30 | GBP | Manufacturing PMI Jul | 48.2 | 48.2 |
| 09:00 | EUR | Eurozone CPI Y/Y Jul P | 1.90% | 2.00% |
| 09:00 | EUR | Eurozone CPI Core Y/Y Jul P | 2.30% | 2.30% |
| 12:30 | USD | Nonfarm Payrolls Jul | 102K | 147K |
| 12:30 | USD | Unemployment Rate Jul | 4.20% | 4.10% |
| 12:30 | USD | Average Hourly Earnings M/M Jul | 0.30% | 0.20% |
| 13:30 | CAD | Manufacturing PMI Jul | 45.6 | |
| 13:45 | USD | Manufacturing PMI Jul F | 49.5 | 49.5 |
| 14:00 | USD | ISM Manufacturing PMI Jul | 49.6 | 49 |
| 14:00 | USD | ISM Manufacturing Prices Paid Jul | 66.5 | 69.7 |
| 14:00 | USD | ISM Manufacturing Employment Index Jul | 45 | |
| 14:00 | USD | UoM Consumer Sentiment Jul F | 61.8 | 61.8 |
| 14:00 | USD | UoM 1-year Inflation Expectations Jul F | 4.40% |
| GMT | Ccy | Events | |
|---|---|---|---|
| 01:30 | AUD | PPI Q/Q Q2 | |
| Forecast: | Previous: 0.90% | ||
| 01:30 | AUD | PPI Y/Y Q2 | |
| Forecast: | Previous: 3.70% | ||
| 01:45 | CNY | Caixin Manufacturing PMI Jul | |
| Forecast: 50.2 | Previous: 50.4 | ||
| 07:50 | EUR | France Manufacturing PMI Jul F | |
| Forecast: 48.4 | Previous: 48.4 | ||
| 07:55 | EUR | Germany Manufacturing PMI Jul F | |
| Forecast: 49.2 | Previous: 49.2 | ||
| 08:00 | EUR | Eurozone Manufacturing PMI Jul F | |
| Forecast: 49.8 | Previous: 49.8 | ||
| 08:30 | GBP | Manufacturing PMI Jul | |
| Forecast: 48.2 | Previous: 48.2 | ||
| 09:00 | EUR | Eurozone CPI Y/Y Jul P | |
| Forecast: 1.90% | Previous: 2.00% | ||
| 09:00 | EUR | Eurozone CPI Core Y/Y Jul P | |
| Forecast: 2.30% | Previous: 2.30% | ||
| 12:30 | USD | Nonfarm Payrolls Jul | |
| Forecast: 102K | Previous: 147K | ||
| 12:30 | USD | Unemployment Rate Jul | |
| Forecast: 4.20% | Previous: 4.10% | ||
| 12:30 | USD | Average Hourly Earnings M/M Jul | |
| Forecast: 0.30% | Previous: 0.20% | ||
| 13:30 | CAD | Manufacturing PMI Jul | |
| Forecast: | Previous: 45.6 | ||
| 13:45 | USD | Manufacturing PMI Jul F | |
| Forecast: 49.5 | Previous: 49.5 | ||
| 14:00 | USD | ISM Manufacturing PMI Jul | |
| Forecast: 49.6 | Previous: 49 | ||
| 14:00 | USD | ISM Manufacturing Prices Paid Jul | |
| Forecast: 66.5 | Previous: 69.7 | ||
| 14:00 | USD | ISM Manufacturing Employment Index Jul | |
| Forecast: | Previous: 45 | ||
| 14:00 | USD | UoM Consumer Sentiment Jul F | |
| Forecast: 61.8 | Previous: 61.8 | ||
| 14:00 | USD | UoM 1-year Inflation Expectations Jul F | |
| Forecast: | Previous: 4.40% | ||
Markets Weekly Outlook – US Data Dump, Earnings Season and Trade Deals
Week in review: Trade Deals Materialize
The August 1 tariff deadline approaches and with it we have had a few trade deal announcements which came out this week. Market sentiment seemed to get a boost, with Gold in particular feeling the heat of a stronger US Dollar.
Market participants remain at least partially on the edge of their seats as we have not seen any details of agreements as yet. This led to early signs of cracks in potential trade deals with the US announcing a Japan trade deal which included significant investments in the US.
However, Japanese officials and US officials seem to have differing views of the deal with Japanese officials stating that the US will secure only 90 per cent of profits from joint investments with Japan if it takes on a proportional amount of risk and financing. This seems to suggest that cracks may be present in the two allies’ interpretation of their hastily agreed trade deal.
Japanese officials further stressed there was no written agreement with Washington & no legally binding one would be drawn up after Trump administration officials claimed Tokyo would back investments in the US from which American taxpayers would reap nine-tenths of the profits.
Wall Street and the dollar strengthened on Friday as investors prepared for the upcoming week. All three major indexes were slightly up in early trading and set to end the week with gains.
The week also saw global investors snap up a net $8.71 billion worth of equity funds during the week, reversing a $4.4 billion net withdrawal in the prior week, data from LSEG Lipper showed.
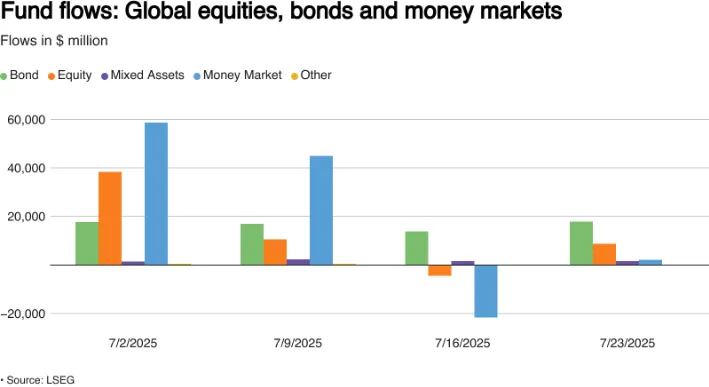
Source: LSEG
With just a week left before Trump's trade deadline, the US and its partners are rushing to finalize deals. European negotiators are optimistic after the trade agreement with Japan earlier this week.
The dollar strengthened but is still set for its biggest monthly drop as investors focus on upcoming trade talks and central bank meetings.
The dollar index rose 0.28% to 97.72, while the euro fell 0.2% to $1.173. Against the yen, the dollar gained 0.4%, reaching 147.57.
In cryptocurrencies, bitcoin dropped 3.08% to $115,133.22, and Ethereum fell 2.63% to $3,641.43.
Oil prices dipped as investors considered global demand and a possible supply increase from Venezuela. US crude fell 0.56% to $65.63 per barrel, and Brent dropped 0.39% to $68.91.
Gold prices also declined as the stronger dollar and optimism over US-EU trade talks reduced demand for the safe-haven metal. Spot gold fell 0.93% to $3,336.52 an ounce.
Earnings Season
Over a third of S&P 500 companies have reported earnings, with 80% beating expectations, according to LSEG data.
Analysts now predict second-quarter earnings will grow 7.7% compared to the 5.8% estimate from July 1.
Next week, four big tech companies Amazon, Apple, Meta, and Microsoft will release their earnings. Investors will closely watch their updates to see if spending on AI is delivering results and if trade tariffs are still affecting their future plans.
The Week Ahead: US Very Much in Focus, Fed Decision, Trade Deals and Earnings
The week ahead has several important data releases lined up. The US and UK will release inflation data with key GDP data from China and manufacturing data from Japan.
Asia Pacific Markets - US/China Trade Talks
The key focus this week is the US-China trade talks in Sweden. A 90-day tariff ceasefire, which started in May, is set to end on August 12. Markets are watching closely to see if the ceasefire will be extended or if there will be changes to current tariffs. An agreement is expected, but uncertainty remains despite President Trump's claims that a framework is in place.
On the data front, China's official July PMI (out Thursday) is expected to stay in contraction at 49.6. The S&P PMI (focused on private and export-driven firms) will follow on Friday. Over the weekend, June industrial profits data will be released. After a sharp drop in May, markets are eager to see if profits recover due to eased trade tensions or if the decline continues.
The Bank of Japan (BoJ) is not expected to make any changes at its meeting on July 30-31. However, markets will pay attention to the BoJ's updated economic outlook. The recent US-Japan trade deal has reduced uncertainty, which may ease pressure on the BoJ. If inflation forecasts are raised, it could give clues about future interest rates. On the downside, weak industrial production data for June may hurt growth, but this could be balanced by a rebound in retail sales.
Economic Data from Europe, UK and the US
The US will be a key focus next week thanks to a data dump and of course trade deal announcements.
On Wednesday, we will get 2nd quarter GDP data which I expect to grow 3.3% (above the 2.5% forecast), driven by strong trade and investment. However, consumer spending, a key growth driver, has slowed since late 2024 due to tariff concerns and economic uncertainty.
This will be followed by the Fed rate decision later in the day. We obviously have the ongoing attacks at Fed Chair Jerome Powell by US President Trump and his administration. However, this is unlikely to sway the Fed at this stage as they are likely to adopt a wait and see approach. The economy is slowing but stable. The Fed is unlikely to cut rates now though I could see a 50bp cut in December if inflation eases.
The US data week will end with focus on Jobs data and PCE.
The Fed's preferred inflation measure, the core PCE deflator, is expected to rise 0.3% in June, slightly higher than CPI's 0.2%. NFP data on Friday is expected at 100-120k, with unemployment ticking up to 4.2%.
As Europe heads into summer, key eurozone data is due. GDP is expected to slow after a strong 1Q boosted by U.S. trade activity. April saw drops in production and exports, though May had a rebound, especially in pharmaceuticals. Overall, U.S. developments likely hurt eurozone GDP, and weak service sector performance may add to the slowdown.
On Friday we will get Euro Area inflation data. ECB President Lagarde has highlighted stable inflation and steady growth as positives. July's inflation data is expected to stay calm, but the focus will be on the U.S.-EU trade relationship as the August 1 deadline nears.
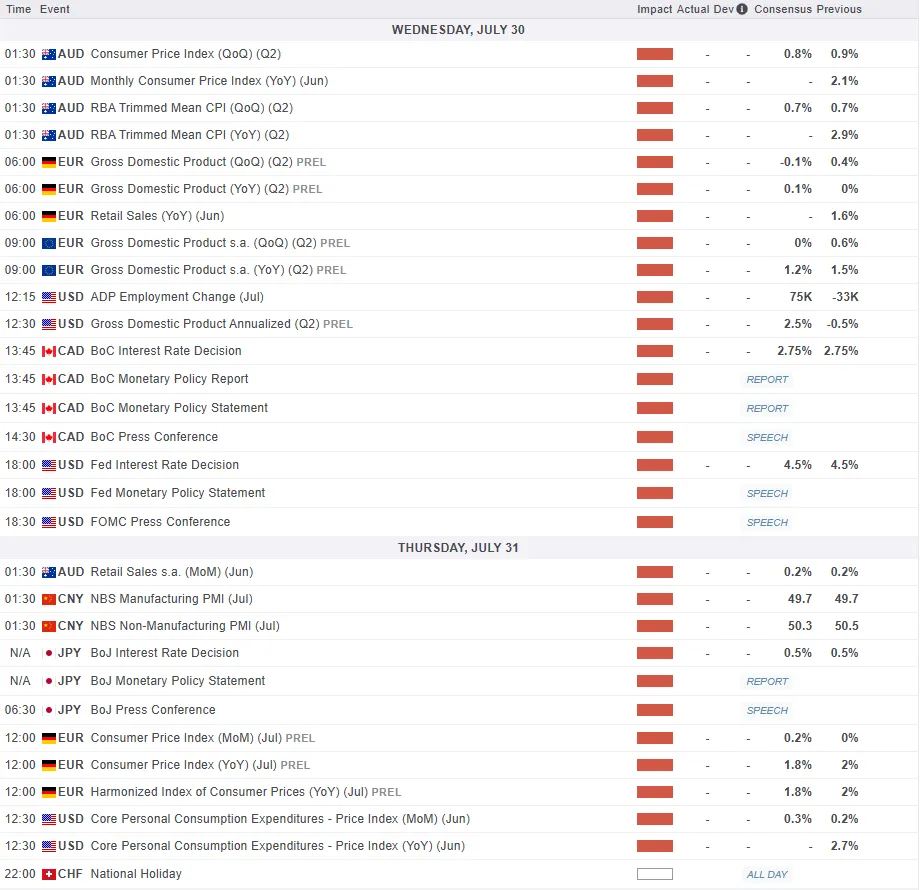
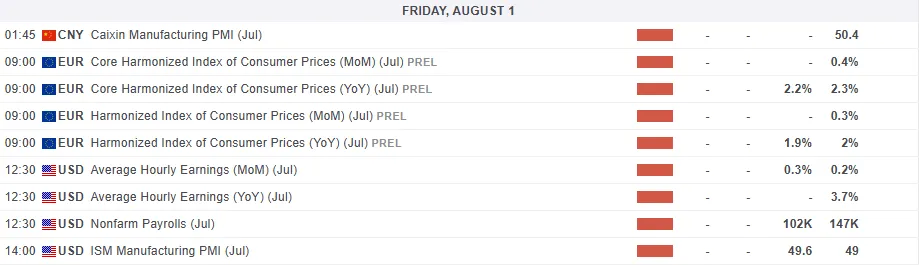
For all market-moving economic releases and events, see the MarketPulse Economic Calendar. (click to enlarge)
Chart of the Week - Gold (XAU/USD)
This week's Chart of the week is Gold (XAU/USD).
Gold has shrugged off its early week gains and dropped over a $100 from the weekly highs around the $3440/oz mark.
Looking at the chart below and we have the triangle pattern which appeared to experience a upside breakout earlier in the week before reversing now to test the lower band of the triangle pattern.
Gold has been mixed since making fresh all-time highs in April of $3500/oz with higher highs followed by lower lows. However, the failure this week to take out the most recent swing high at $3451/oz on June 16 may warrant caution for bulls.
A break below the lower end of the triangle pattern would usually be a sign of further downside, however following the false breakout this week, market participants may rightly be slight confused.
If the trendline holds, bulls may return, however if it does give way then the door may be opening for a larger retracement and the $3300 level is the next key spot of support i will pay attention to.
Gold (XAU/USD) Daily Chart - July 25, 2025
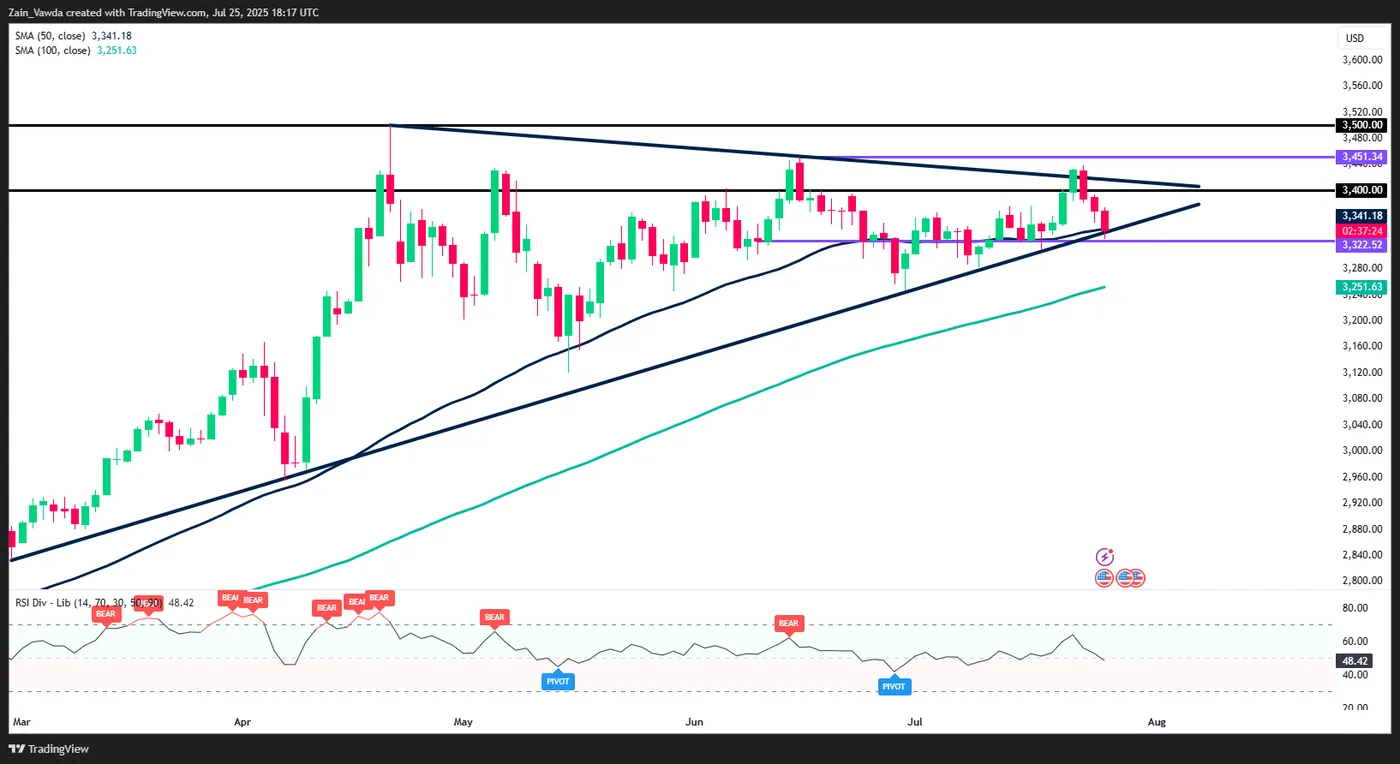
Source:TradingView.Com (click to enlarge)
Key Levels to Consider:
Support
- 3300
- 3278
- 3251 (100-day MA)
Resistance
- 3350
- 3400
- 3425