
Sample Category Title
USD/JPY Mid-Day Outlook
Daily Pivots: (S1) 146.23; (P) 146.63; (R1) 147.39; More...
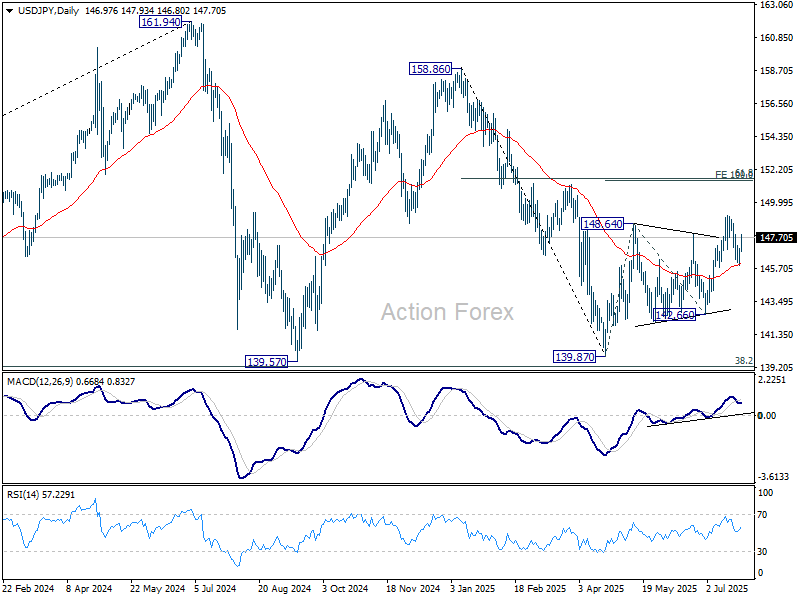
Intraday bias in USD/JPY remains neutral and outlook is unchanged. As long as 55 D EMA (now at 145.97) holds, further rally is still expected. On the upside, above 147.94 minor resistance will bring retest of 149.17. Firm break there will target 100% projection of 139.87 to 148.64 from 142.66 at 151.43. That is close to 61.8% retracement of 158.86 to 139.87 at 151.22. However, sustained trading below 55 D EMA will argue that the whole rebound from 139.87 might have completed and target 142.66 support for confirmation.
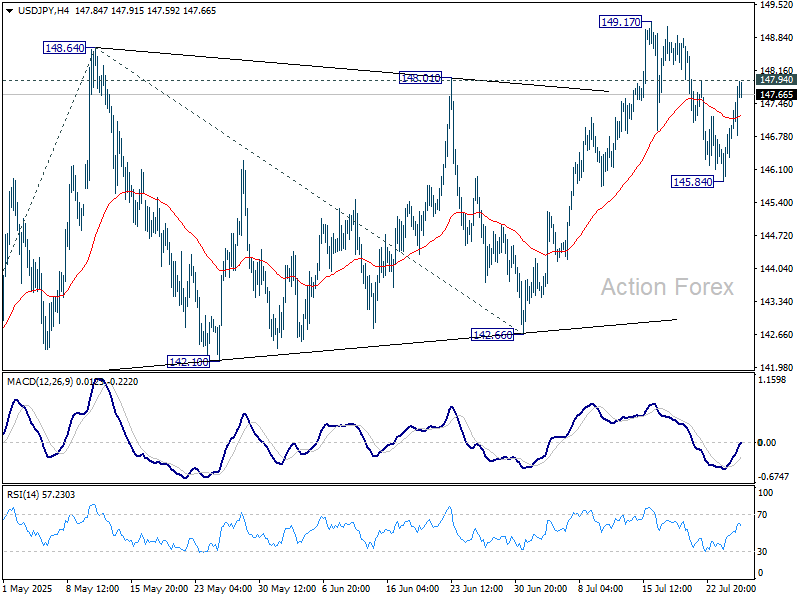
In the bigger picture, price actions from 161.94 (2024 high) are seen as a corrective pattern to rise from 102.58 (2021 low). There is no clear sign that the pattern has completed yet. But still, strong support is expected from 38.2% retracement of 102.58 to 161.94 at 139.26 to bring rebound. in case of another fall.
USD/CHF Mid-Day Outlook
Daily Pivots: (S1) 0.7928; (P) 0.7944; (R1) 0.7973; More….
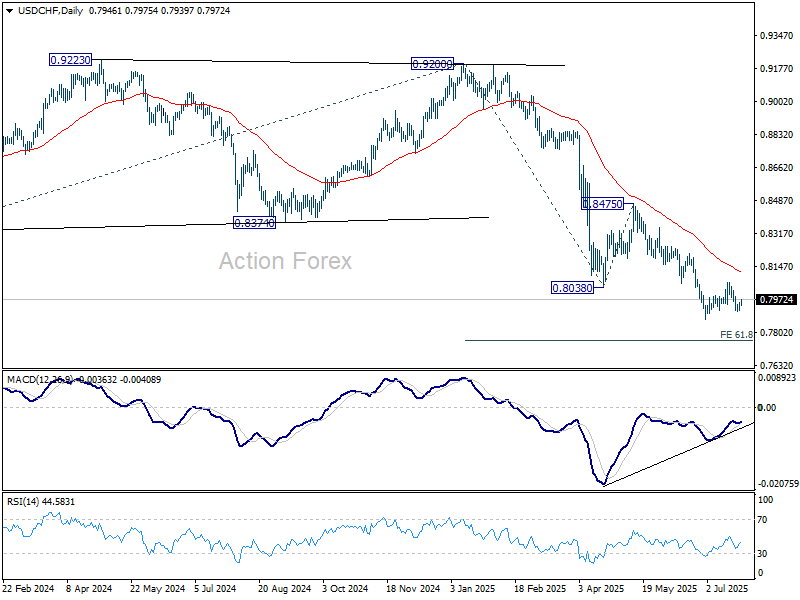
No change in USD/CHF's outlook and intraday bias remains neutral. On the downside, below 0.7910 will bring retest of 0.7871 support. Firm break there will resume larger down trend and target 61.8% projection of 0.9200 to 0.8038 from 0.8475 at 0.7757. On the upside, break of 0.7990 minor resistance will bring stronger rebound to extend the corrective pattern from 0.7871.
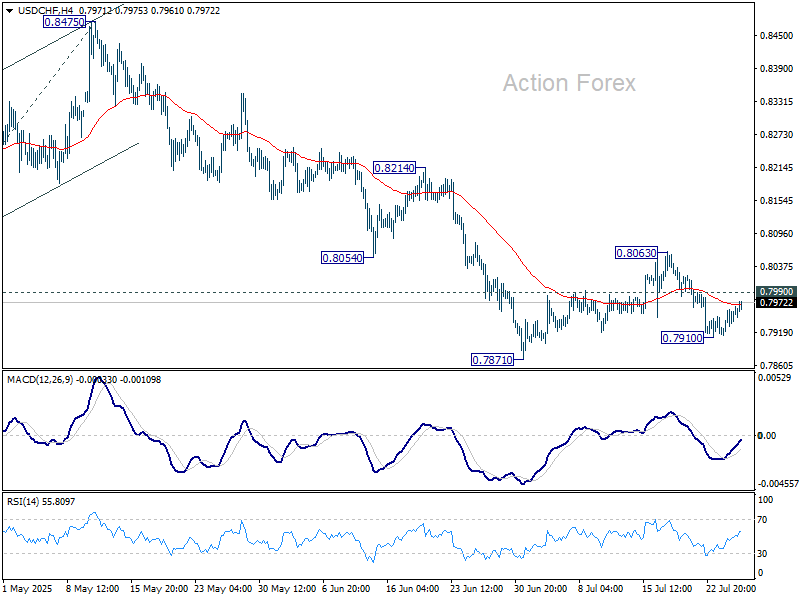
In the bigger picture, long term down trend from 1.0342 (2017 high) is still in progress. Next target is 100% projection of 1.0146 (2022 high) to 0.8332 from 0.9200 at 0.7382. In any case, outlook will stay bearish as long as 0.8475 resistance holds.
GBP/USD Mid-Day Outlook
Daily Pivots: (S1) 1.3476; (P) 1.3533; (R1) 1.3562; More...
Intraday bias in GBP/USD remains neutral at this point. Further rise is expected as long as 1.3363 support holds. Above 1.3587 will turn bias back to the upside for retesting 1.3787 first. However, sustained break of 1.3363 will argue that it's already correcting the whole rally from 1.2099, and target 1.3206 resistance turned support.
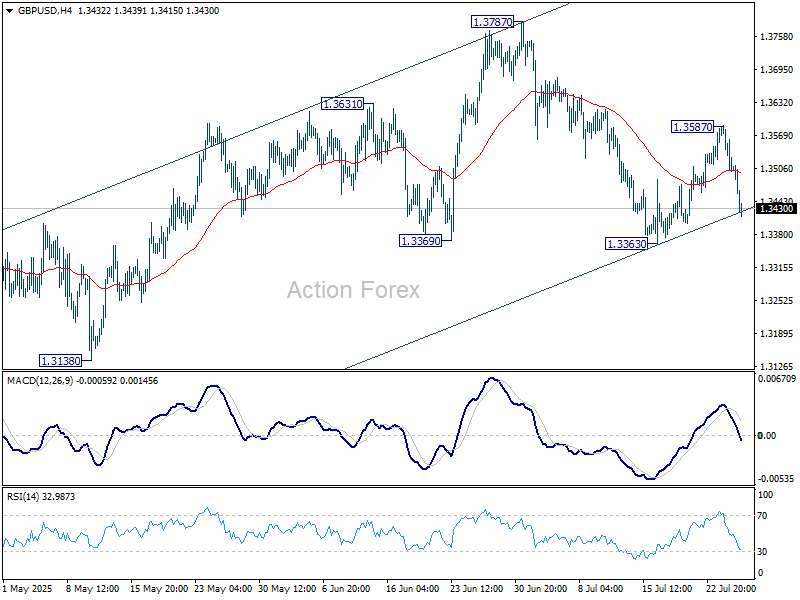
In the bigger picture, up trend from 1.3051 (2022 low) is in progress. Next medium term target is 61.8% projection of 1.0351 to 1.3433 from 1.2099 at 1.4004. Outlook will now stay bullish as long as 55 W EMA (now at 1.3017) holds, even in case of deep pullback.
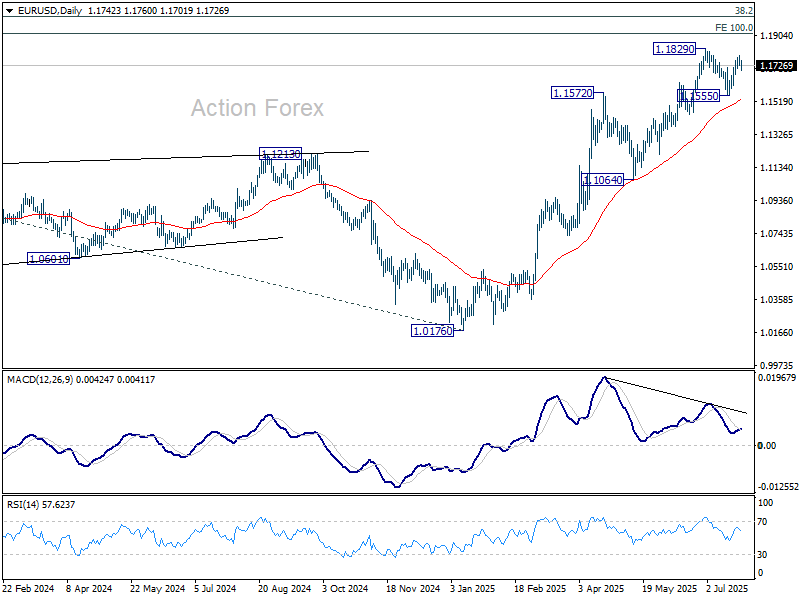
EUR/USD Mid-Day Outlook
Daily Pivots: (S1) 1.1723; (P) 1.1756; (R1) 1.1781; More...
Intraday bias in EUR/USD is turned neutral with current retreat. Further rise is favor as long as 1.1677 minor support holds. Firm break of 1.1829 will resume whole rally from 1.0176, and target 1.1916 projection level. However, break of 1.1677 will turn bias to the downside, and extend the corrective pattern from 1.1829 with another falling leg.
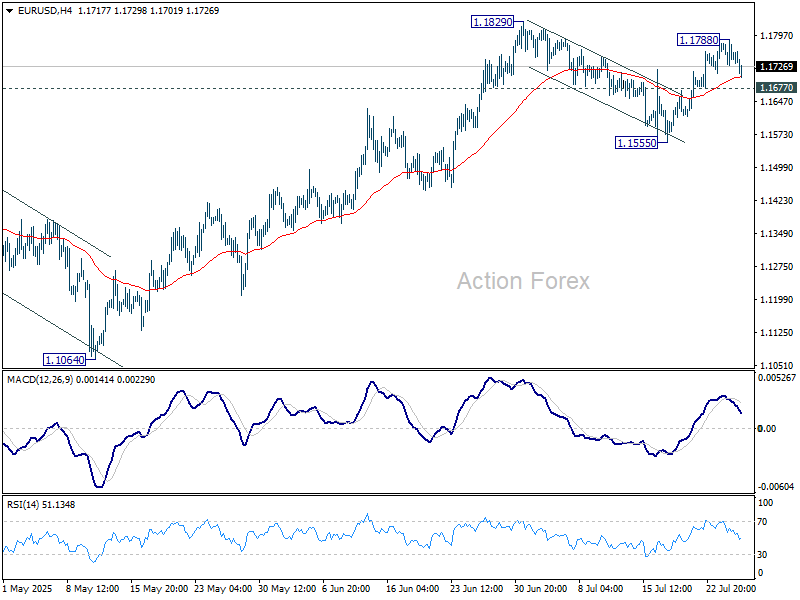
In the bigger picture, rise from 0.9534 long term bottom could be correcting the multi-decade downtrend or the start of a long term up trend. In either case, further rise should be seen to 100% projection of 0.9534 to 1.1274 from 1.0176 at 1.1916. This will remain the favored case as long as 1.1604 support holds.
Dollar Rebound Gains Momentum as Trade Talks Still in Focus
Dollar is staging a firm rebound heading into Friday’s New York session, reversing most of the earlier weekly losses. While durable goods orders for June came in better than expected, markets largely dismissed the data, recognizing that recent swings in transportation orders are tied more to tariff-driven volatility than to underlying demand.
Instead, the greenback's strength appears rooted in rising confidence that Fed Chair Jerome Powell will not be fired by President Donald Trump. Despite ongoing verbal pressure, Trump told reporters he doesn’t believe dismissing Powell is “necessary,” suggesting that while political interference will persist, the Fed’s leadership remains intact—for now.
On the trade front, Japan clarified the structure of its USD 550B investment deal with the US, which accompanied this week’s tariff agreement. Japan’s top negotiator Ryosei Akazawa emphasized that profit-sharing will be proportional and privately managed, countering claims that Tokyo is giving away funds without returns. US-Japan coordination on joint investments appears to be strengthening.
Meanwhile, South Korea’s push to secure a tariff exemption from the US is entering its final phase. Top ministers are meeting again in Washington with US Commerce Secretary Howard Lutnick, reaffirming a commitment to reach a deal by the August 1 deadline. Seoul is signaling confidence that an agreement is close, though time is short.
Across the currency markets, Dollar remains the weakest performer for the week but could recover further if sentiment holds. Sterling and Loonie follow as laggards. Aussie and Euro. Yen and Swiss franc are trading mid-pack.
In Europe, at the time of writing, FTSE is down -0.33%. DAX is down -0.67%. CAC is down -0.10%. UK 10-year yield is up 0.033 at 4.658. Germany 10-year yield is up 0.036 at 2.741. Earlier in Asia, Nikkei fell -0.88%. Hong Kong HSI fell -1.09%. China Shanghai SSE fell -0.33%. Singapore Strait Times fell -0.28%. Japan 10-year JGB yield rose 0.002 to 1.605.
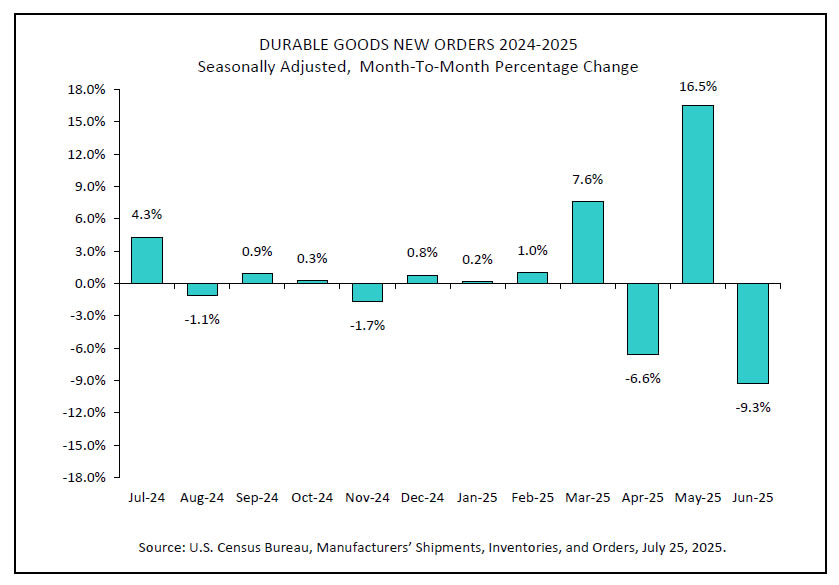
US durable goods slump -9.3% mom on transport orders
US durable goods orders plunged -9.3% mom to USD 311.8B in June, marking the steepest drop since April 2020. Still, the result was better than consensus forecasts of -11.0% mom decline. The weakness was driven almost entirely by transportation equipment, which tumbled -22.4% mom to USD 113.0B, pulling headline orders sharply lower.
Beneath the surface, however, core figures were more resilient. Orders excluding transportation rose 0.2% mom to USD 198.8B, beating the 0.1% mom forecast. Ex-defense orders slumped -9.4% mom, reinforcing the outsized drag from specific sectors.
ECB forecasters see no enduring disinflation from tariffs
The ECB’s Q3 Survey of Professional Forecasters showed that headline inflation expectations have been revised down across the medium term. HICP inflation is now projected at 2.0% for 2025 (down from 2.2%) and 1.8% for 2026 (down from 2.0%), while 2027 remains unchanged at 2.0%. Core HICP inflation for 2025 is unchanged at 2.3%, but was revised down from 2.1% to 2.0% for both 2026 and 2027.
Respondents cited tariffs as having a small downward effect on inflation in the short term, subtracting roughly -0.06 percentage points from the HICP in both 2025 and 2026, but anticipated no lasting impact beyond that.
On growth, forecasters revised up their 2025 GDP forecast by 0.2 percentage points, trimmed 2026 by 0.1 points, and left 2027 unchanged at 1.4%.
ECB's Villeroy emphasizes agile pragmatism
French and Finnish ECB officials are urging caution but not complacency as the central bank navigates an increasingly uncertain global environment. Speaking today, François Villeroy de Galhau said growth risks remain "tilted to the downside" and emphasized that "agile pragmatism in light of data and forecasts is of the essence."
Villeroy also noted that US tariffs—though still not fully defined—are unlikely to spark inflation to rise in the Eurozone. Instead, the recent appreciation of Euro is already exerting a “significant disinflationary effect,” which could aid in anchoring inflation near the ECB's 2% target.
Separately, Finnish policymaker Olli Rehn echoed the theme of strategic patience, warning that while caution is warranted, the ECB should avoid “waiting in vain.” He stressed the high “option value of waiting.”
ECB's Kazaks sees pause to continue as inflation settles at 2%
Latvian ECB Governing Council member Martins Kazaks said there is now “value in holding rates at the current levels,” signaling that the era of obvious rate hikes or cuts is over. Speaking in an interview, the central banker stressed that a “steady-hand policy is appropriate,” suggesting little urgency for additional easing from the ECB in the near term.
Kazaks further emphasized that unless the Eurozone economy suffers a major blow, there’s limited justification for lowering interest rates. His stance comes after ECB President Christine Lagarde also struck a cautious tone following yesterday’s decision to keep the deposit rate unchanged at 2.00%.
Separately, Lithuanian Governing Council member Gediminas Šimkus noted “inflation is expected to stay at 2% level in the medium term.”
German Ifo rises to 88.6, but recovery still sluggish
Germany’s Ifo Business Climate Index edged up from 88.4 to 88.6 in July, indicating only marginal improvement in business confidence. Current Assessment Index also ticked higher from 86.2 to 86.5, while Expectations Index held steady at 90.7. The Ifo Institute noted the recovery remains “sluggish,” with no clear acceleration in sight.
By industry, sentiment in manufacturing improved from -13.9 to -11.8, while construction also saw a modest rebound to -14.0. However, services weakened slightly to 2.7, and trade sentiment deteriorated again to -20.2.
UK retail sales rise 0.9% mom in June, but miss forecasts
UK retail sales rose 0.9% mom in June, a solid rebound from May’s -2.8% mom drop, but shy of expectations for a 1.2% mom increase. On a quarterly basis, sales volumes grew 0.2% qoq in Q2, indicating modest underlying momentum.
Fuel sales jumped 2.8% mom—the strongest monthly gain in over a year—while food store volumes also posted a 0.7% mom rise. Online activity remained robust, with non-store sales volumes climbing 1.7% mom and reaching their highest level since February 2022.
Tokyo CPI core slows to 2.9%, but stays elevated
Tokyo’s core CPI (ex-fresh food) eased slightly from 3.1% to 2.9% yoy in July, coming in just below expectations of 3.0% yoy, but still notably above the BoJ’s 2% target.
Headline inflation also slowed from 3.1% yoy to 2.9% yoy. Core-core measure—excluding fresh food and energy—held steady at 3.1%. The stickiness in core-core inflation highlights persistent underlying price pressures.
The figures will feed into the BoJ’s upcoming July 30–31 policy meeting, where the board is widely expected to upgrade its inflation forecast for the current fiscal year. While the data alone may not push the BoJ to act immediately, it strengthens the case for further normalization as inflation remains well above target.
EUR/USD Mid-Day Outlook
Daily Pivots: (S1) 1.1723; (P) 1.1756; (R1) 1.1781; More...
Intraday bias in EUR/USD is turned neutral with current retreat. Further rise is favor as long as 1.1677 minor support holds. Firm break of 1.1829 will resume whole rally from 1.0176, and target 1.1916 projection level. However, break of 1.1677 will turn bias to the downside, and extend the corrective pattern from 1.1829 with another falling leg.
In the bigger picture, rise from 0.9534 long term bottom could be correcting the multi-decade downtrend or the start of a long term up trend. In either case, further rise should be seen to 100% projection of 0.9534 to 1.1274 from 1.0176 at 1.1916. This will remain the favored case as long as 1.1604 support holds.
US durable goods slump -9.3% mom on transport orders
US durable goods orders plunged -9.3% mom to USD 311.8B in June, marking the steepest drop since April 2020. Still, the result was better than consensus forecasts of -11.0% mom decline. The weakness was driven almost entirely by transportation equipment, which tumbled -22.4% mom to USD 113.0B, pulling headline orders sharply lower.
Beneath the surface, however, core figures were more resilient. Orders excluding transportation rose 0.2% mom to USD 198.8B, beating the 0.1% mom forecast. Ex-defense orders slumped -9.4% mom, reinforcing the outsized drag from specific sectors.
ECB’s Villeroy emphasizes agile pragmatism
French and Finnish ECB officials are urging caution but not complacency as the central bank navigates an increasingly uncertain global environment. Speaking today, François Villeroy de Galhau said growth risks remain "tilted to the downside" and emphasized that "agile pragmatism in light of data and forecasts is of the essence."
Villeroy also noted that US tariffs—though still not fully defined—are unlikely to spark inflation to rise in the Eurozone. Instead, the recent appreciation of Euro is already exerting a “significant disinflationary effect,” which could aid in anchoring inflation near the ECB's 2% target.
Separately, Finnish policymaker Olli Rehn echoed the theme of strategic patience, warning that while caution is warranted, the ECB should avoid “waiting in vain.” He stressed the high “option value of waiting.”
EUR/USD Under Pressure Despite Weaker US Dollar
The EUR/USD pair dipped to 1.1738 on Friday as the US dollar staged a modest recovery, though it remains on track for a weekly decline. Investors continue to weigh developments in trade negotiations while awaiting next week’s Federal Reserve meeting.
Recent reports suggest the US and EU are nearing a trade agreement, which would impose tariffs of 15% on most European goods, mirroring the recent deal struck with Japan.
Amid this backdrop, monetary policy is coming into sharper focus. Markets expect the Fed to keep rates on hold at its upcoming meeting, as policymakers monitor the potential inflationary impact of new tariffs.
Meanwhile, President Donald Trump has softened his tone towards Fed Chair Jerome Powell following a historic visit to the central bank’s headquarters. Trump reiterated that he has no intention of removing Powell, despite earlier speculation.
Interest rate futures currently reflect expectations of a rate cut totalling 43 basis points by the end of 2025, with the consensus forecast anticipating one cut in September and another in December.
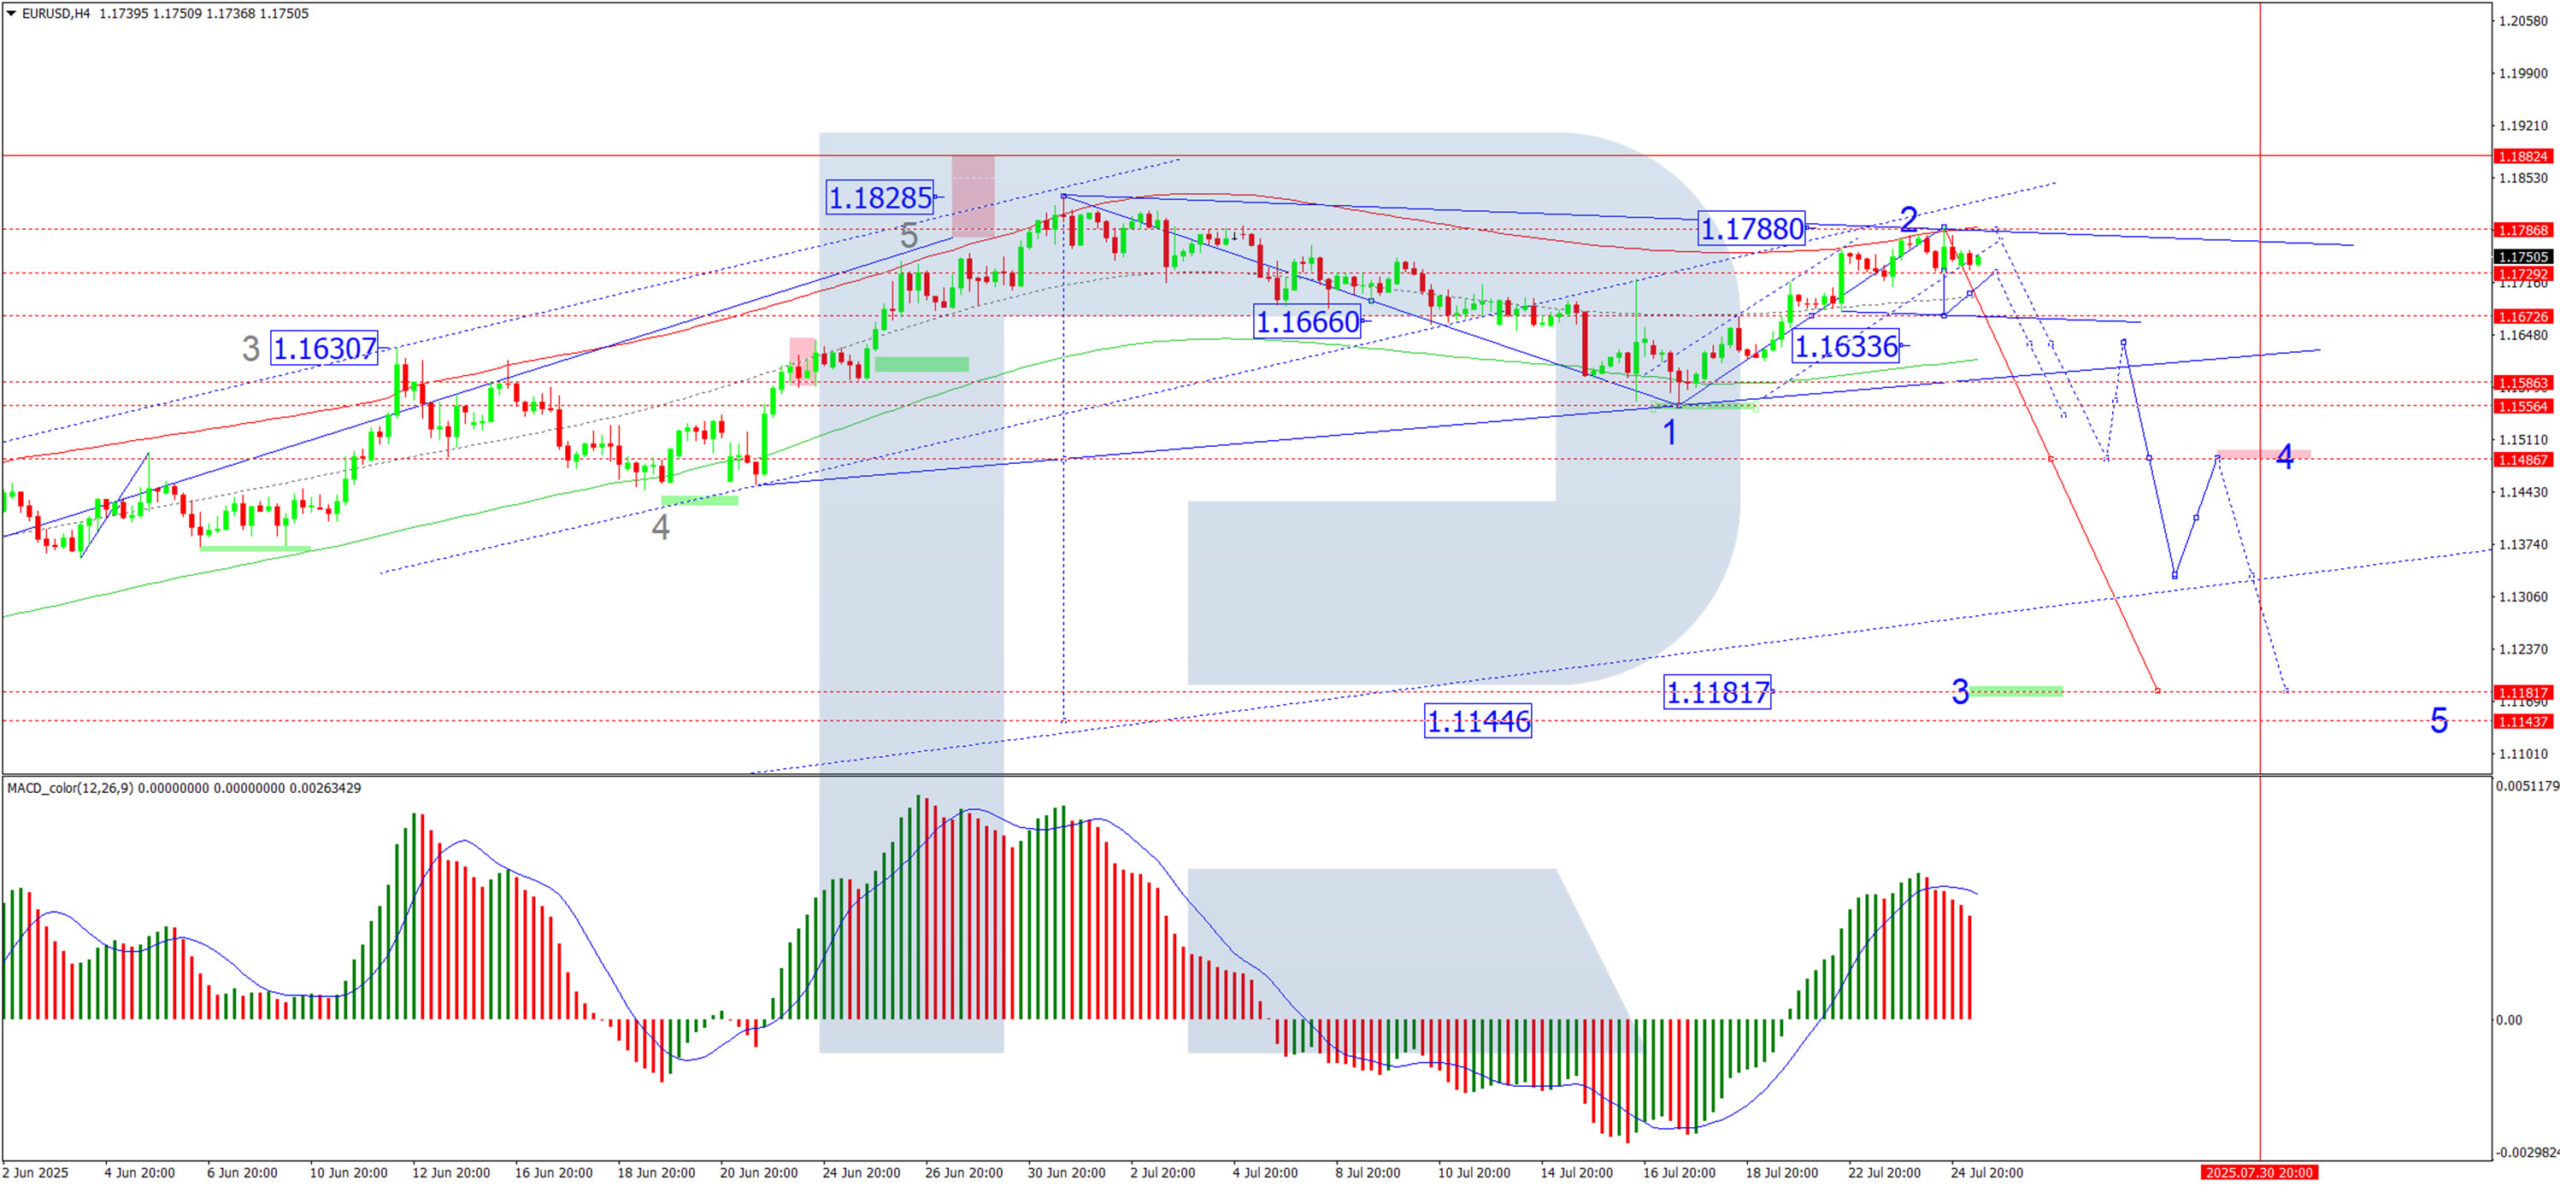
Technical Analysis: EUR/USD
H4 Chart:
The EUR/USD has completed an upward wave towards 1.1788 on the H4 chart. Today, we expect a downward impulse to 1.1723, followed by a potential rebound to 1.1755. The pair is likely to enter a consolidation range near the peak of this upward wave, with a possible breakout to the downside towards 1.1670 as the primary target. This scenario is supported by the MACD indicator, where the signal line remains above zero but is trending sharply downward.
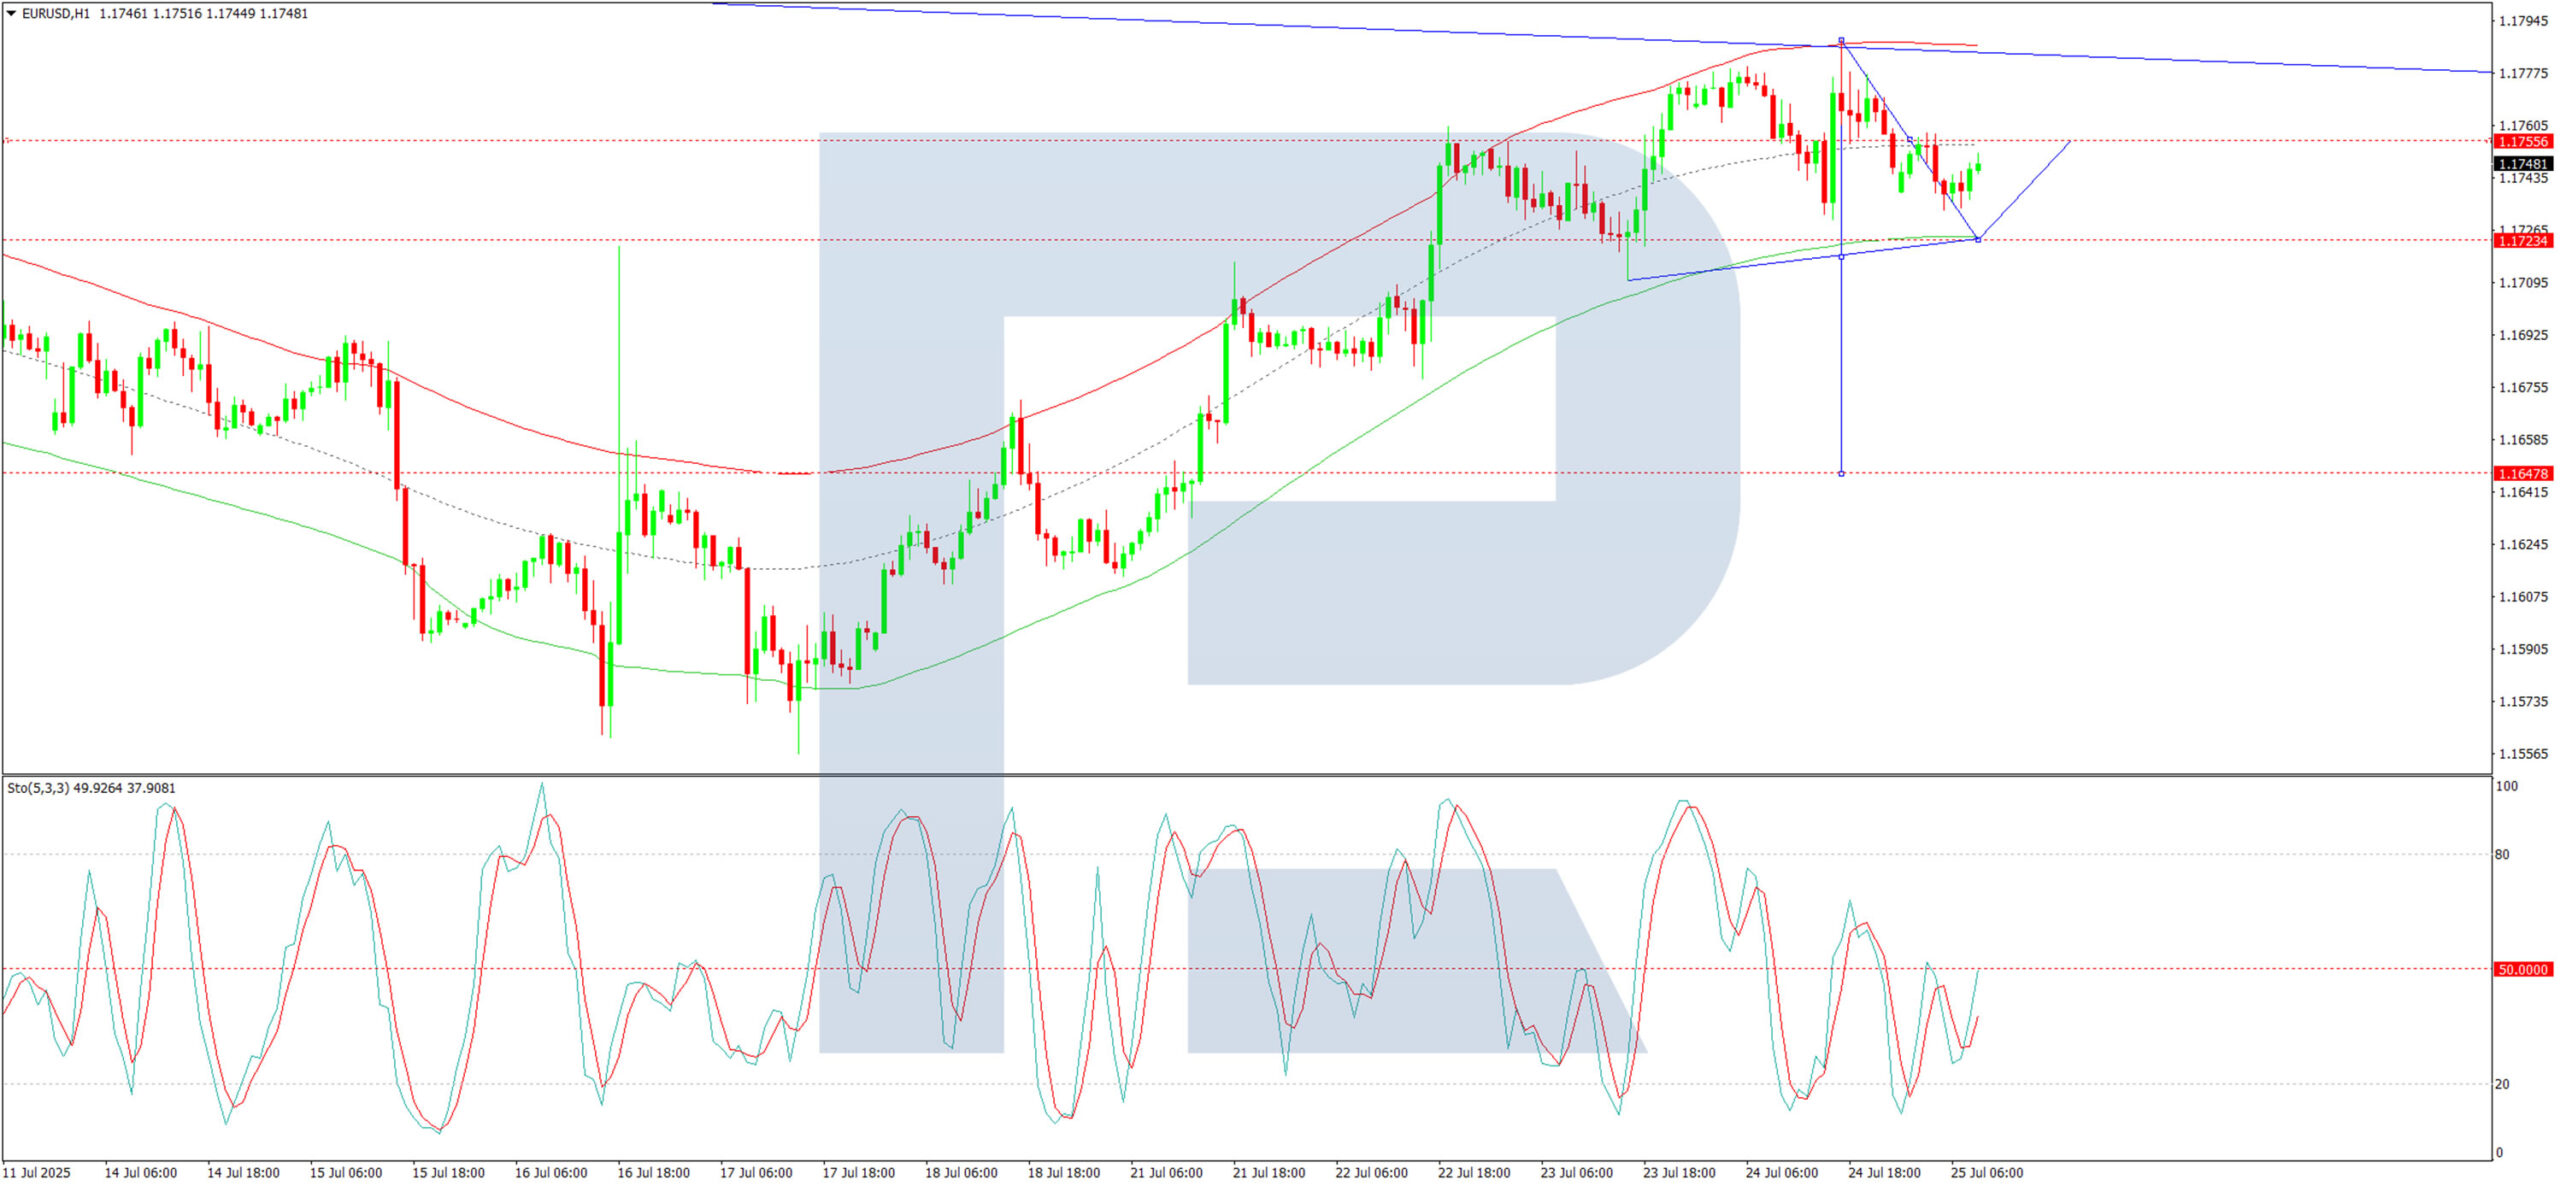
H1 Chart:
On the H1 timeframe, the pair is forming the initial structure of a downward wave targeting 1.1723. The first local target at 1.1733 has already been met. A corrective rise to 1.1755 may follow before another decline towards 1.1723. The Stochastic oscillator corroborates this outlook, with its signal line below 50 and pointing firmly downward towards 20.
Conclusion
The EUR/USD faces near-term pressure, but broader dollar weakness persists. Traders should monitor developments in trade policy and forthcoming Fed communications for directional cues, while technicals suggest further consolidation with a bearish bias.
DAX Index Losing Bullish Momentum
At the end of May, we noted that the German stock index DAX 40 (Germany 40 mini on FXOpen) was exhibiting significantly stronger performance compared to other global equity indices. However, we also highlighted the 24,100 level as a strong resistance zone.
Two months have passed, and the chart now suggests that bearish signals are intensifying.
From a technical analysis perspective, the DAX 40 (Germany 40 mini on FXOpen) formed an ascending channel in July (outlined in blue). However, each time the bulls attempted to push the price above the 24,460 level (which corresponds to the May high), they encountered resistance.
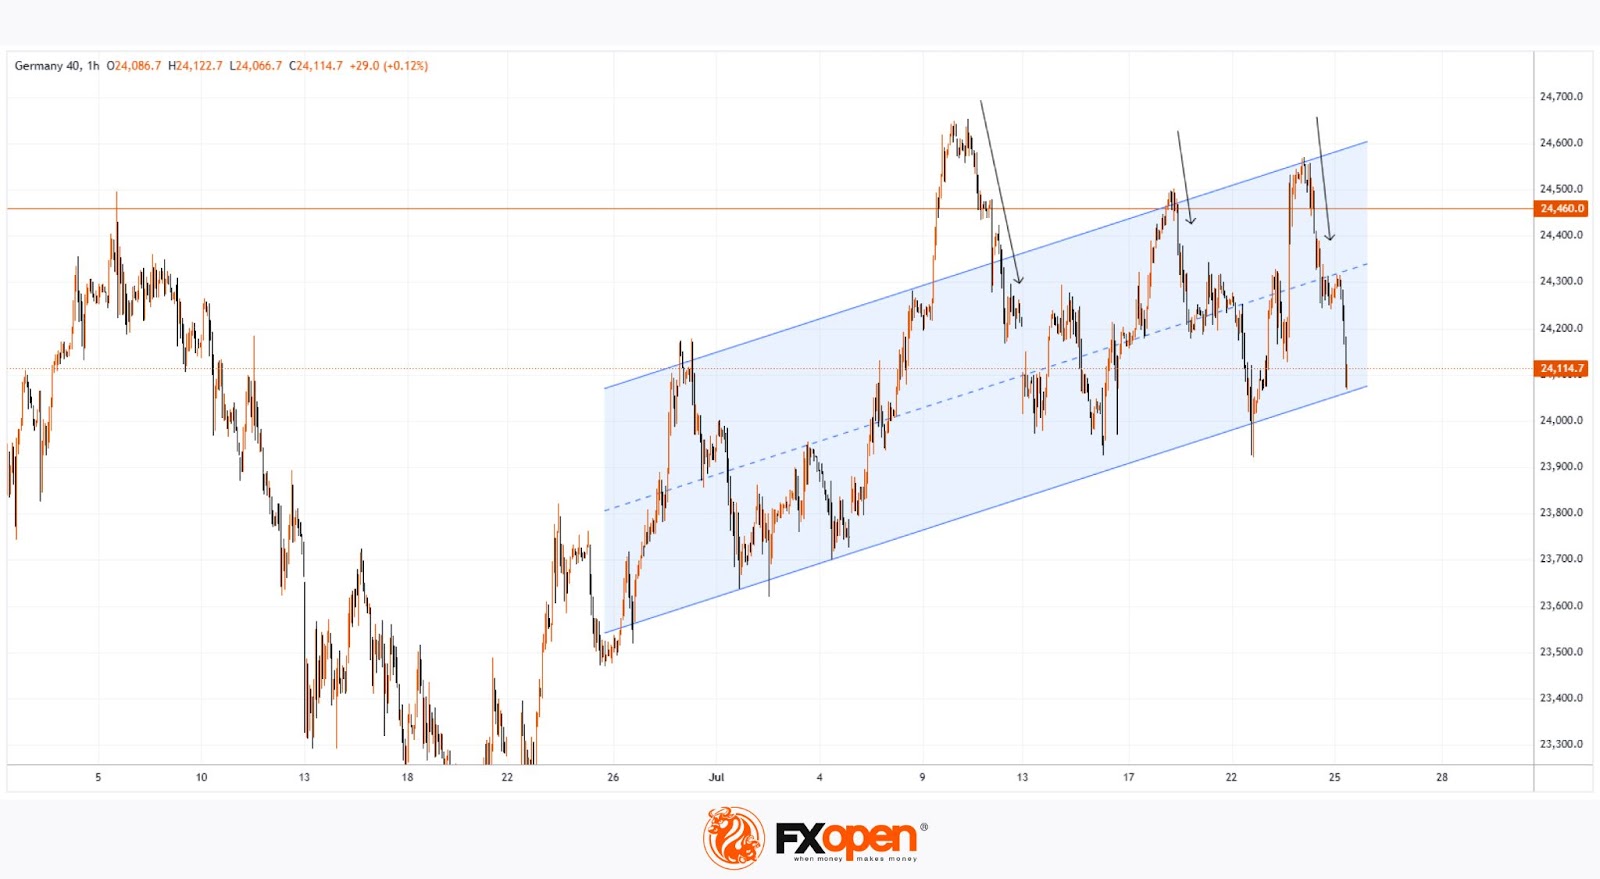
It is worth noting the nature of the bearish reversals (indicated by arrows) – the price declined sharply, often without intermediate recoveries, signalling strong selling pressure. It is likely that major market participants used the proximity to the all-time high to reduce their long positions.
From a fundamental standpoint, several factors are weighing on the DAX 40 (Germany 40 mini on FXOpen):
→ Ongoing uncertainty surrounding the US–EU trade agreement, which has yet to be finalised (with the deadline approaching next week);
→ Corporate news, including disappointing earnings reports from Puma, Volkswagen, and several other German companies.
Given the above, it is reasonable to assume that bearish activity could result in an attempt to break below the lower boundary of the ascending blue channel.
Trade global index CFDs with zero commission and tight spreads. Open your FXOpen account now or learn more about trading index CFDs with FXOpen.
This article represents the opinion of the Companies operating under the FXOpen brand only. It is not to be construed as an offer, solicitation, or recommendation with respect to products and services provided by the Companies operating under the FXOpen brand, nor is it to be considered financial advice.
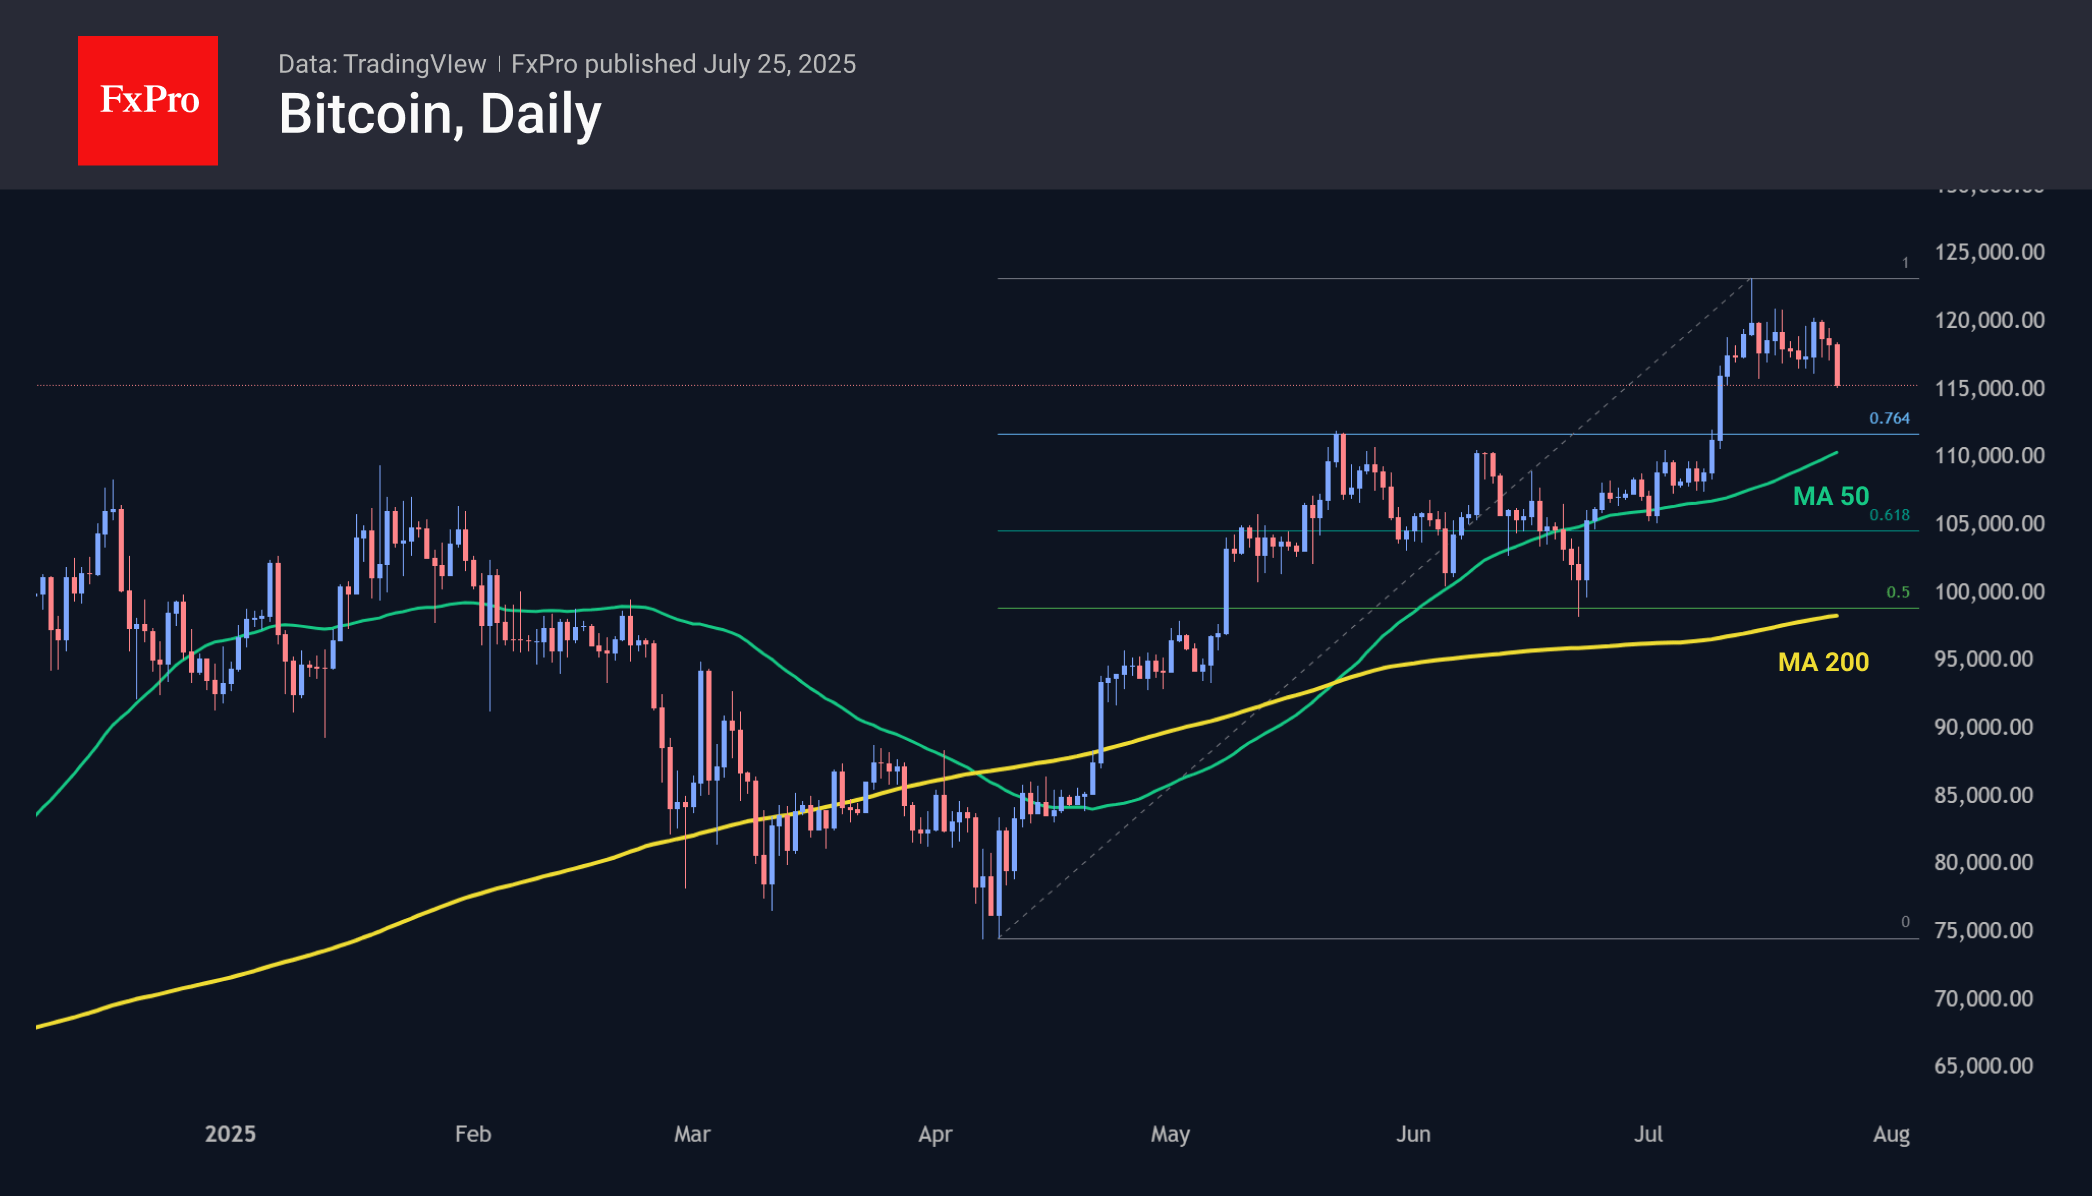
Bitcoin Moved from Consolidation to Correction
Market Overview
The crypto market capitalisation has fallen by another 1.3% over the past 24 hours to $3.77 trillion, which is 5.3% below the highs of $3.98 trillion set on July 23rd. We consider the decline from the December peaks to be a necessary and healthy correction. Even a pullback to 3.40 can be seen as part of profit-taking, pulling the market back to recent peaks and the 61.8% area of the total growth from April lows. As long as the market remains above this level, there is no point in talking about a change in the medium-term trend.
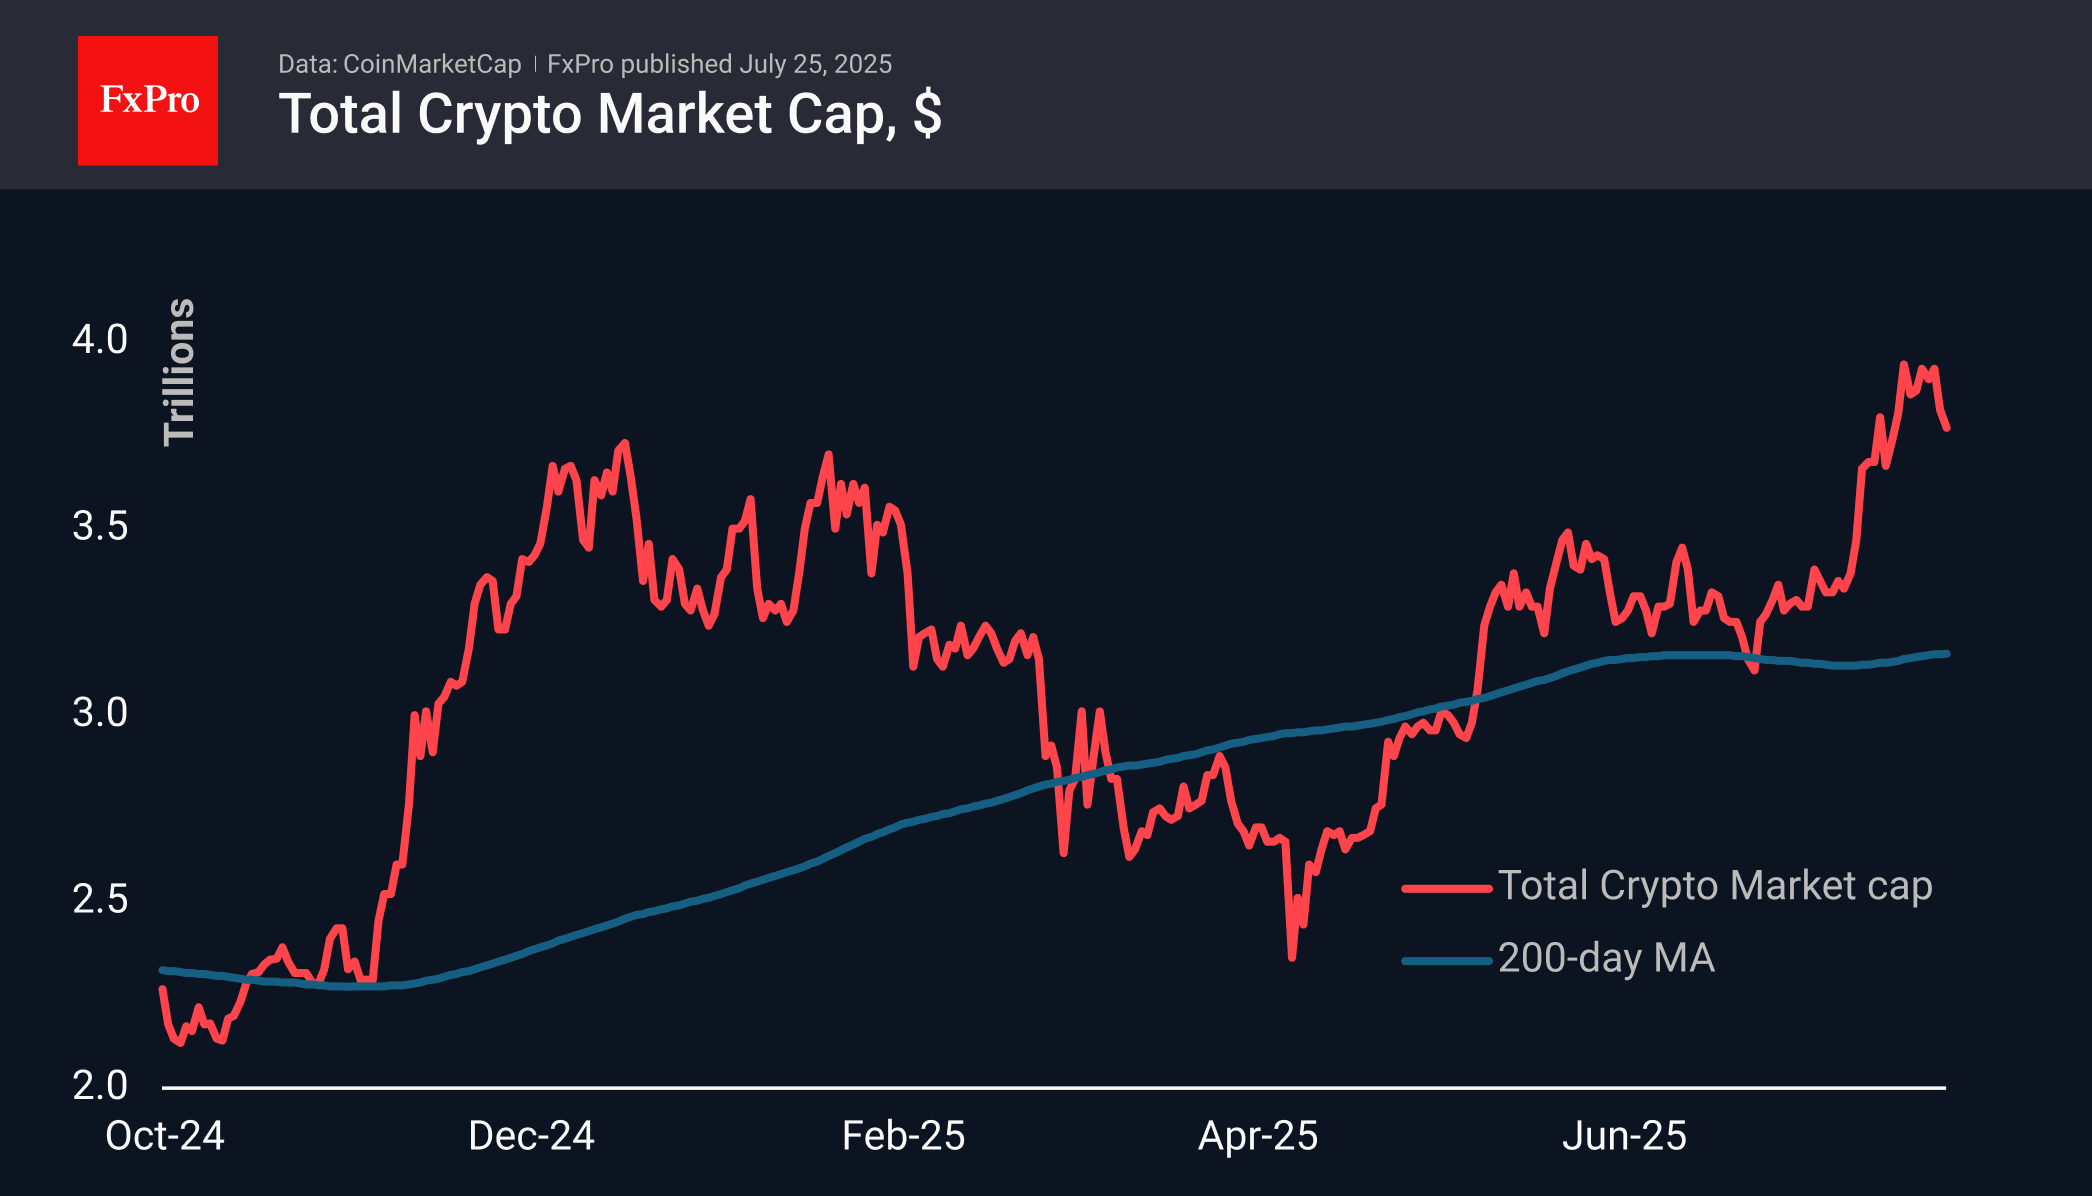
The sentiment index at 70 indicates a high probability that the market is ready to return to buying as soon as it consolidates part of the latest rally. It should be acknowledged that the market is not falling into such blatant greed as it did in previous growth cycles after halving. On the other hand, the drawdowns are not as deep now either.
Bitcoin fell to $115.2k, losing 2% in a day and 4% in seven days. This is a downward exit from the latest consolidation, forcing us to tune in to a correction with the price moving towards $111K, where the May highs are concentrated, the 76.4% retracement level from the April growth. The 50-day moving average is also heading there.
News Background
Institutional investors continue to build positions in Bitcoin amid retail participants’ sales, CryptoQuant notes. The rally has the potential to continue until retail investors enter the market en masse.
Google Trends data confirms the lack of excitement among small players. The number of searches for the word “bitcoin” remains significantly below the “euphoria” of 2021.
For the first time in a long time, Ethereum’s trading volume has surpassed that of Bitcoin, CryptoQuant notes. Santiment is convinced that the upward trend of ETH will continue, and that the current market correction is related to profit-taking.
On July 24th, trading in shares of Tron (TRON), a company associated with the blockchain of the same name, began on the Nasdaq exchange. The firm went public through a merger with SRM Entertainment, which was already listed on the trading platform.
Jack Dorsey’s Block announced the launch of Bitcoin payments in the Square app based on Lightning Network technology. On July 23rd, Block officially joined the S&P 500 index.