
Sample Category Title
USD/CAD Daily Outlook
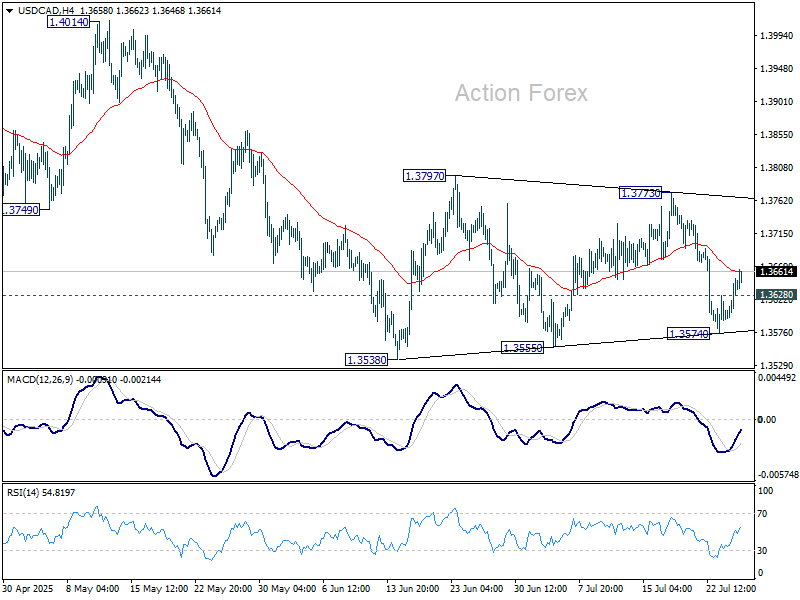
Daily Pivots: (S1) 1.3602; (P) 1.3628; (R1) 1.3665; More...
USD/CAD's recovery ahead of 1.3538/3555 support zone and break of 1.3628 minor resistance suggests that consolidation pattern from 1.3538 is extending with another leg. Intraday bias is turned neutral first. Upside of recovery should be limited below 1.3773 resistance. Firm break of 1.3538 will confirm resumption of whole decline from 1.4791.
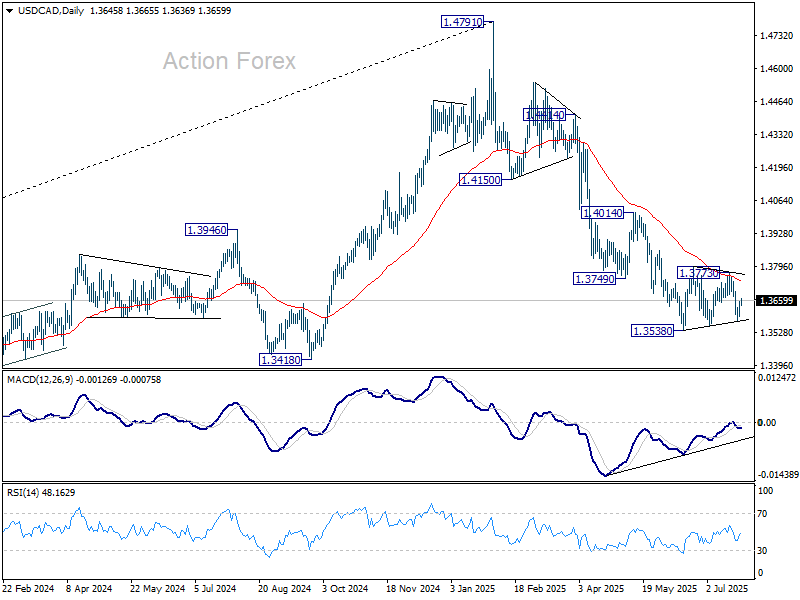
In the bigger picture, price actions from 1.4791 medium term top could either be a correction to rise from 1.2005 (2021 low), or trend reversal. In either case, further decline is expected as long as 1.4014 resistance holds. Next target is 61.8% retracement of 1.2005 (2021 low) to 1.4791 at 1.3069.
EUR/CHF Daily Outlook
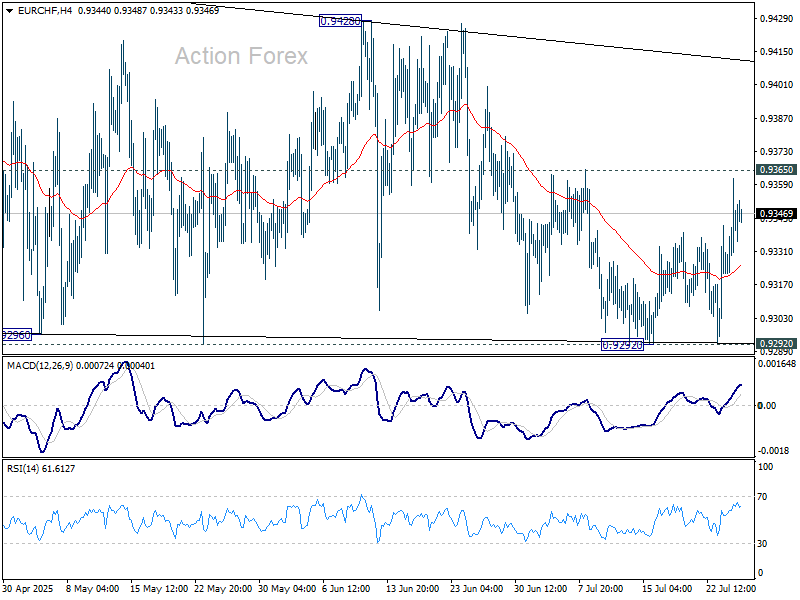
Daily Pivots: (S1) 0.9325; (P) 0.9344; (R1) 0.9365; More....
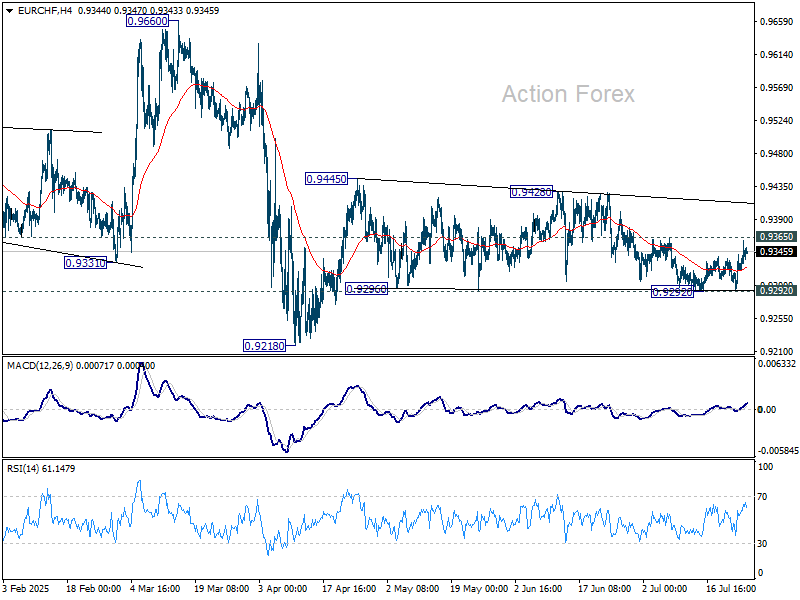
Intraday bias in EUR/CHF remains neutral at this point. On the upside, firm break of 0.9365 resistance will be the first sign that corrective pattern from 0.9445 has already completed. Further rise should then be seen to 0.9428/45 resistance zone. Firm break there will resume the rebound from 0.9218 low. However, firm break of 0.9292 will bring retest of 0.9218 instead.
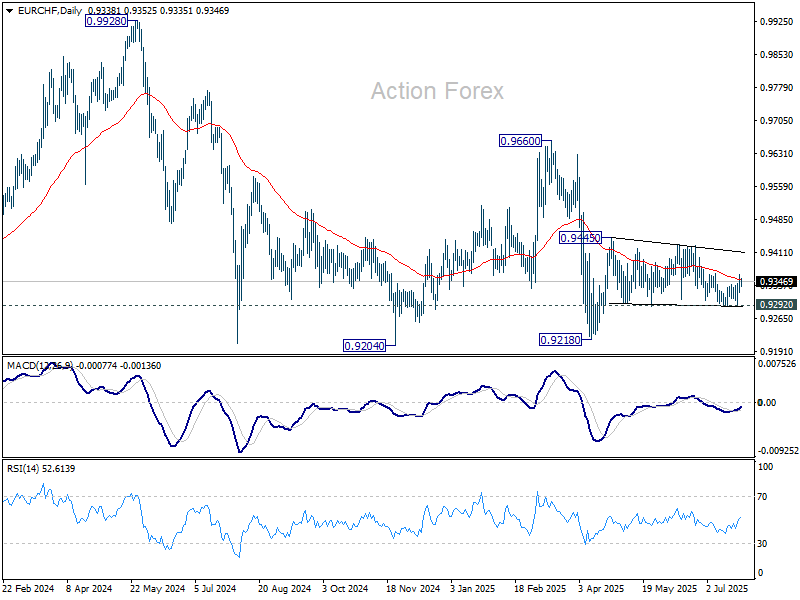
In the bigger picture, while downside momentum has been diminishing as seen in W MACD, there is no sign of bottoming yet. EUR/CHF is still staying below 55 W EMA (now at 0.9424) and well inside long term falling channel. Outlook will stay bearish as long as 0.9660 resistance holds. Break of 0.9204 (2024 low) will confirm resumption of down trend from 1.2004 (2018 high).
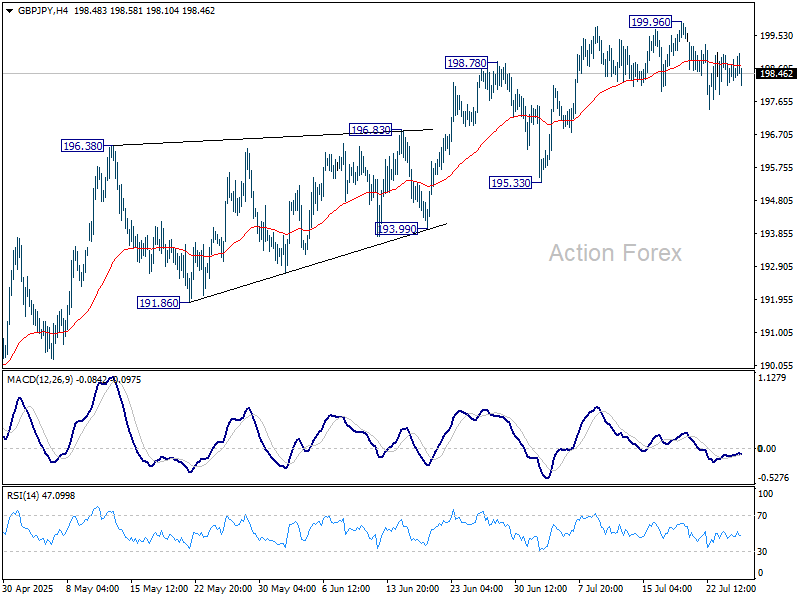
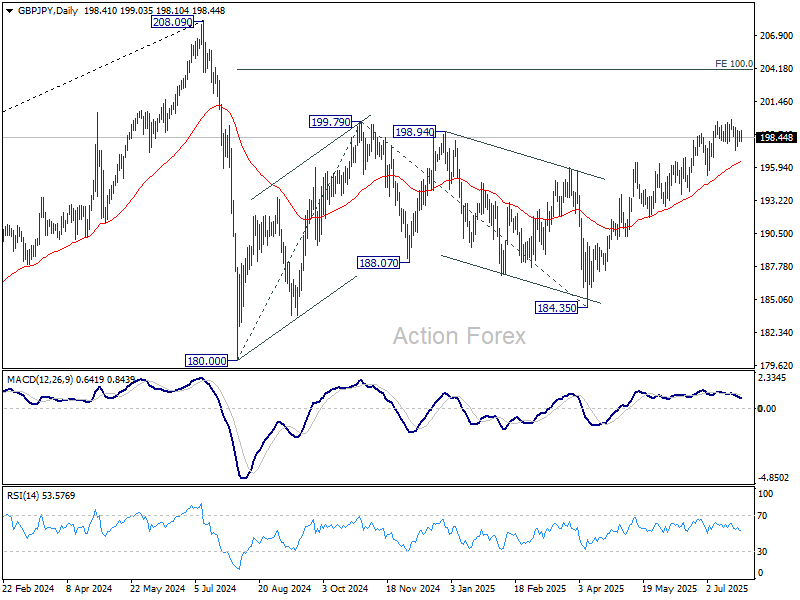
GBP/JPY Daily Outlook
Daily Pivots: (S1) 198.14; (P) 198.61; (R1) 199.48; More...
Intraday bias in GBP/JPY remains neutral for the moment as consolidations continue below 199.96. While deeper pullback cannot be ruled out, further rally will remain in favor as long as 195.33 support holds. Above 199.96 will resume the rise from 184.35 to 100% projection of 180.00 to 199.79 from 184.35 at 204.14.
In the bigger picture, price actions from 208.09 (2024 high) are seen as a correction to rally from 123.94 (2020 low). The pattern might still extend with another falling leg. But in that case, strong support should be seen from 38.2% retracement of 123.94 to 208.09 at 175.94 to contain downside. Meanwhile, decisive break of 208.09 will confirm long term up trend resumption.
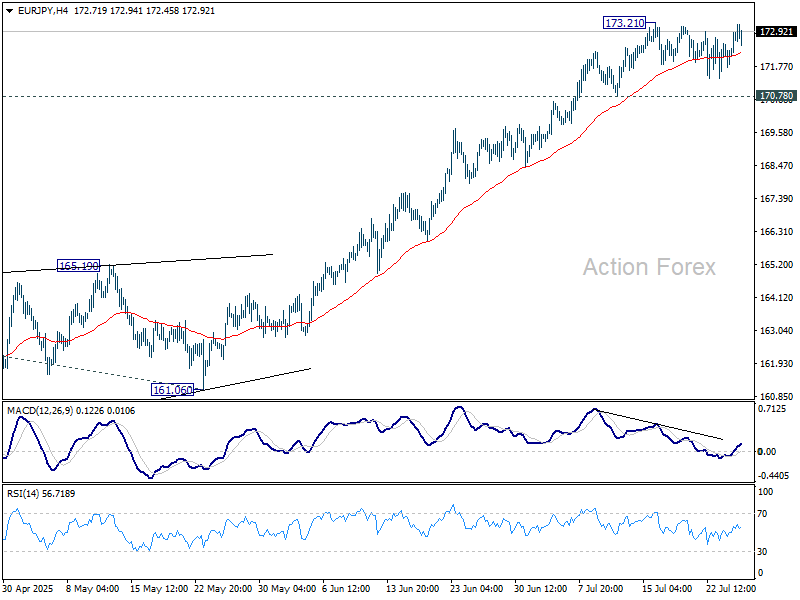
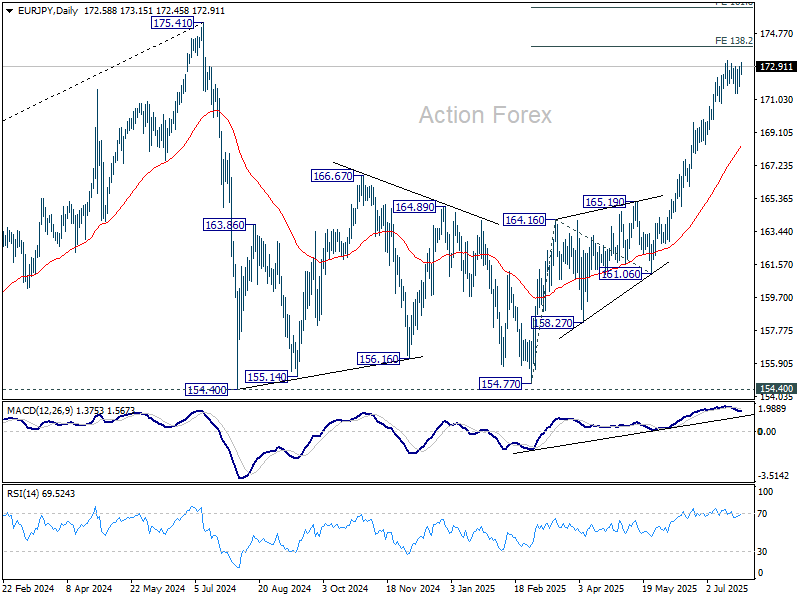
EUR/JPY Daily Outlook
Daily Pivots: (S1) 171.98; (P) 172.45; (R1) 173.15; More...
Intraday bias in EUR/JPY remains neutral for the moment. Consolidations from 173.21 could still extend with another falling leg. But overall, with 170.78 support intact, further rally is expected. On the upside, break of 173.21 will target 138.2% projection of 154.77 to 164.16 from 161.06 at 174.03. Break there will bring retest of 175.41 high. Nevertheless, considering bearish divergence condition in 4H MACD, break of 170.78 will indicate short term topping, and turn bias to the downside for deeper pullback.
In the bigger picture, price actions from 175.41 (2024 high) are seen as correction to up trend from 114.42 (2020 low). The pattern might still extend with another falling leg. But in that case, strong support should be seen from 38.2% retracement of 114.42 to 175.41 at 152.11 to contain downside. Meanwhile, decisive break of 175.41 will confirm long term up trend resumption.
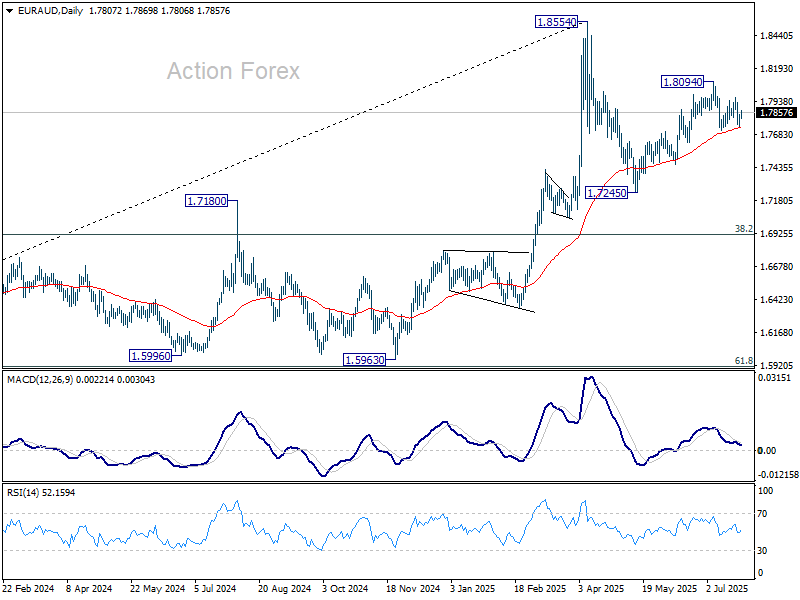
EUR/AUD Daily Outlook
Daily Pivots: (S1) 1.7774; (P) 1.7810; (R1) 1.7870; More...
No change in EUR/AUD's outlook and intraday bias stays neutral. On the downside, break of 1.7717 support will revive the case that rise from 1.7245 has completed. Corrective pattern from 1.8554 should have then started the third leg. Intraday bias will be back on the downside for 1.7459 support next. On the upside, above 1.7972 will bring retest of 1.8094 resistance.
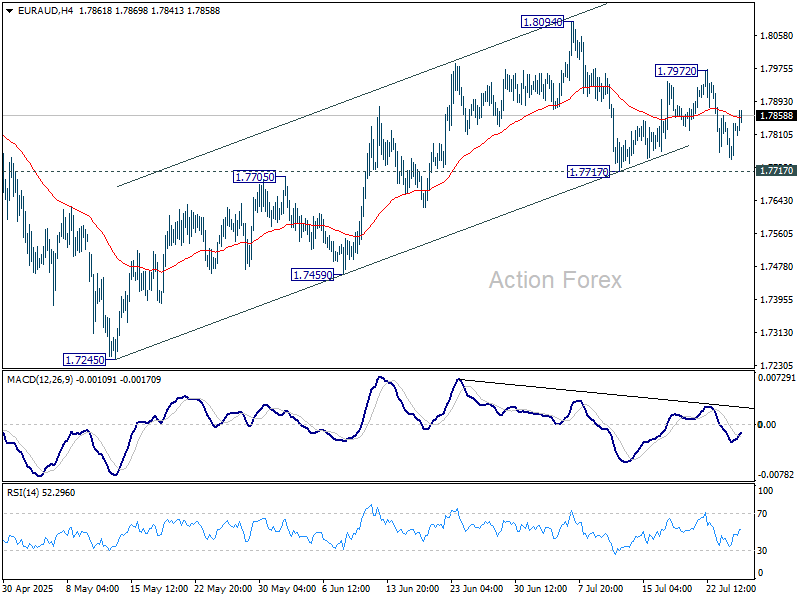
In the bigger picture, price actions from 1.8554 medium term top are seen as a corrective pattern. While deeper pullback might be seen, downside should be contained by 38.2% retracement of 1.4281 (2022 low) to 1.8554 at 1.6922 to bring rebound. Up trend from 1.4281 is expected to resume at a later stage.
Today’s Numbers Do Not Derail Our Expectations for Further BoJ Rate Hikes Later This Year
Markets
EMU yield curves bear flattened yesterday. A solid EMU PMI and the ECB reconfirming a data-dependent wait-and-see modus caused markets to reconsider expectations on additional ECB easing. The July EMU composite PMI at 51.0 suggests economic resilience despite still lingering trade uncertainty. The overall EMU figure was also still pressured by a poor French performance. Growth momentum in Germany improves. The rest of Europe continues a solid expansion. Cost inflation is easing and so are prices rises for consumers. The ECB basically subscribed the message from the PMI’s. Inflation has returned to the 2% target and is expected to hold near that level in the foreseeable future, admittedly given an exceptionally high degree of uncertainty. At the press conference, ECB’s Lagarde said the ECB is in a good place to assess developments. She saw growth mostly as expected, maybe even a bit better. In particular the latter remark triggered a further upleg in EMU yields. German yields rose between 8.8 bps (2-y) and 1.9 bps (30-y). The market focus, at least temporarily shifted from fiscal sustainability to monetary policy considerations. Money markets now only see about a 65% chance of a ‘final’ 25 bps ECB rate cut EoY 2025. US yields initially also showed similar gains, supported by low weekly jobless claims, but mixed US PMI’s (manufacturing unexpectedly falling from 52.9 to 49.5, but services beating at 54.6 from 52.9) slowed the upward momentum. The US 2-y yield added 3.6 bps. The 30-y finished unchanged. On other markets, equities apparently had discounted the good news of the US-Japan trade deal (and the anticipation of other ‘acceptable’ deals with other trading partners). The US S&P 500 (+0.1%) and the EuroStoxx 50 (+0.2%) closed off the intraday peak levels. On FX markets, the performance of the euro post PMI/ECB could have been stronger. A EUR/USD spike to the 1.1785/90 area could not be sustained. EUR/USD even closed modestly lower at 1.175. DXY gained modestly (97.38 from 97.2). Still the technical picture remains fragile. USD/JPY also rebound to close near 147. Sterling again underperformed after a disappointing UK PMI. EUR/GBP extensively tested the 0.87 barrier (close 0.8698).
Asian equity markets are falling prey to profit taking after recent trade-driven rally. The dollar gains marginally. Later today, US durable goods orders data and German IFO sentiment probably will only be of intraday significance. Markets will continue to look out for more trade deals between the US and major trading partners (including EU) as the August 1 deadline is nearing fast. This might cause some consolidation for equities and the dollar going into the weekend. At the short end of the EMU yield curve, a firm bottom now is probably in place. More good news might cause MM to further price out the probability of a final ECB rate cut. UK June retail sales rebounded a below consensus 0.6% M/M after a sharp 2.9% decline in May. EUR/GBP tried to extend gains beyond 0.87.
News & Views
Inflation in Japan’s capital Tokyo marginally eased and slightly more than expected in July to remain among the fastest paces in recent decades barring the post-pandemic surge. Both the headline and core (ex. food) gauge retreated from 3.1% to 2.9%. The conventional core measure (ex. food and energy) matched June’s 3.1% as did services inflation at 2.1%. The latter is key to the central bank to determine whether inflation is durable or not, via wage gains filtering through to this labour sensitive sector. This year’s shunto (spring labor wage negotiations) are likely to add upward pressure on (services) inflation. Today’s numbers do not derail our expectations for further BoJ rate hikes later this year, though the bank is likely to skip July despite the US and Japan having struck a trade deal. Japanese yields and the yen nevertheless edge a tad lower this morning. USD/JPY hovers north of 147.
UK GfK consumer confidence deteriorated from -18 to -19 in July. While slightly better than the -20 anticipated, it features some poor underlying details. GfK attributed this month’s drop to mounting job losses and rising inflation. It added that the savings intentions subseries rose to 34, the highest level since November 2007. GfK said households were building “contingency funds”, amongst others due to fears for further tax hikes in the next October budget. The weak consumer survey comes after yesterday’s poor PMI business confidence indicators and could spell trouble for the UK economy going forward. EUR/GBP extends gains to north of 0.87 to trade the highest since the April 2 market mayhem.
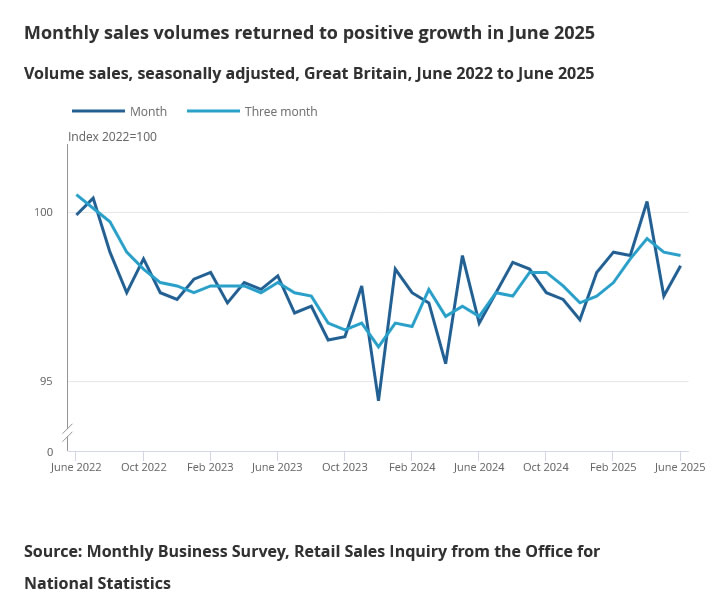
UK retail sales rise 0.9% mom in June, but miss forecasts
UK retail sales rose 0.9% mom in June, a solid rebound from May’s -2.8% mom drop, but shy of expectations for a 1.2% mom increase. On a quarterly basis, sales volumes grew 0.2% qoq in Q2, indicating modest underlying momentum.
Fuel sales jumped 2.8% mom—the strongest monthly gain in over a year—while food store volumes also posted a 0.7% mom rise. Online activity remained robust, with non-store sales volumes climbing 1.7% mom and reaching their highest level since February 2022.
EUR/GBP Daily Outlook
Daily Pivots: (S1) 0.8672; (P) 0.8691; (R1) 0.8716; More...
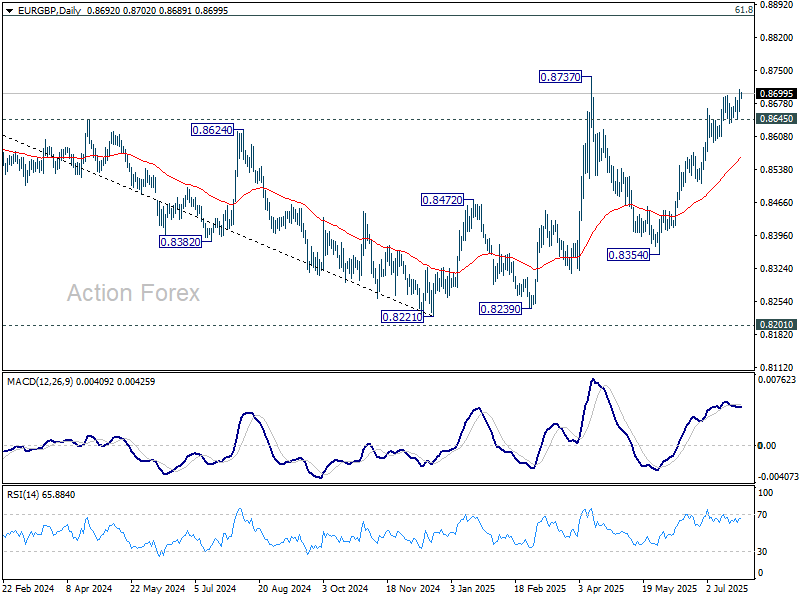
EUR/GBP's rise from 0.8354 resumed by breaking 0.8696 resistance and intraday bias is back on the upside. Further rally should be seen to retest 0.8737 high. Firm break there will extend the rise from 0.8221 towards 0.8867 fibonacci level. On the downside, however, break of 0.8645 will suggest short term topping, and turn bias to the downside for deeper pullback.
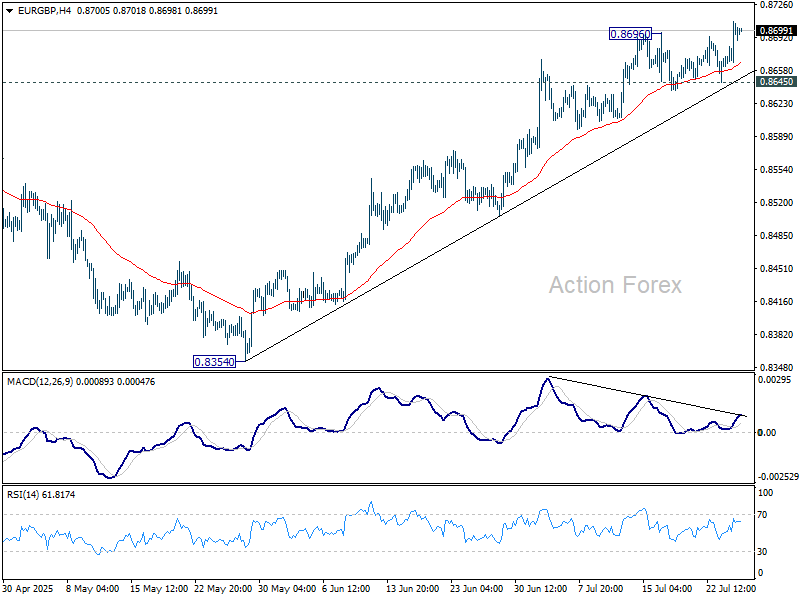
In the bigger picture, the structure from 0.8221 medium term bottom are not impulsive enough to suggest that it's reversing the down trend from 0.9267 (2022 high). But even if it's a correction, firm break of 0.8737 will still pave the way to 61.8% retracement of 0.9267 to 0.8221 at 0.8867. For now, further rise will remain in favor as long as 55 W EMA (now at 0.8474) holds.
Shifting ECB Cut Expectations Supports Euro; Trump Tones Down Powell Threat
Euro strengthened notably against Sterling and Swiss Franc as expectations for a September rate cut from the ECB began to fade. Some analysts now see October as a more likely timing, after President Christine Lagarde maintained an optimistic outlook during her post-decision press conference yesterday. Lagarde emphasized that June’s baseline forecasts remain valid, even amid US tariff threats. Latest improvement in July’s services PMI also reduced the urgency for another near-term cut.
In the US, Dollar clawed back modest ground following signs that Fed Chair Jerome Powell’s job is safe—at least for now. During a symbolic visit to the Fed, US President Donald Trump reiterated his frustration with Powell’s reluctance to cut rates but walked back threats of dismissal. Trump said that firing the chair would be “a big move” and likely unnecessary. The shift eases some institutional risk concerns that had weighed on the greenback.
Meanwhile, Australia’s decision to allow US beef imports marks another bright spot in global trade relations. Australian Agriculture Minister Julie Collins noted that biosecurity concerns have been addressed through improved US monitoring systems. Trump welcomed the move, touting it as a win for American ranchers and a sign of stronger US-Australia ties.
Overall for the week so far, Yen is currently the strongest one, followed by Kiwi, and then Euro. Dollar remains at the bottom, followed by Loonie, and then Sterling. Swiss Franc and Aussie are positioning in the middle. Risk-on sentiment appears to be receding.
Technically, a focus today is on 0.9365 resistance in EUR/CHF as near term rebound extends. Firm break there will argue that corrective pattern from 0.9445 might have finally completed at 0.9292. Retest of 0.9428/9445 resistance zone should be seen next. Firm break there will resume the rebound from 0.9218.
In Asia, at the time of writing, Nikkei is down -0.87%. Hong Kong HSI is down -0.87%. China Shanghai SSE is down -0.25%. Singapore Strait Times is down -0.35%. Japan 10-year JGB yield is down -0.008 at 1.595. Overnight, DOW fell -0.70%. S&P 500 rose 0.07%. NASDAQ rose 0.18%. 10-year yield rose 0.02 to 4.408.
Tokyo CPI core slows to 2.9%, but stays elevated
Tokyo’s core CPI (ex-fresh food) eased slightly from 3.1% to 2.9% yoy in July, coming in just below expectations of 3.0% yoy, but still notably above the BoJ’s 2% target.
Headline inflation also slowed from 3.1% yoy to 2.9% yoy. Core-core measure—excluding fresh food and energy—held steady at 3.1%. The stickiness in core-core inflation highlights persistent underlying price pressures.
The figures will feed into the BoJ’s upcoming July 30–31 policy meeting, where the board is widely expected to upgrade its inflation forecast for the current fiscal year. While the data alone may not push the BoJ to act immediately, it strengthens the case for further normalization as inflation remains well above target.
EUR/GBP Daily Outlook
Daily Pivots: (S1) 0.8672; (P) 0.8691; (R1) 0.8716; More...
EUR/GBP's rise from 0.8354 resumed by breaking 0.8696 resistance and intraday bias is back on the upside. Further rally should be seen to retest 0.8737 high. Firm break there will extend the rise from 0.8221 towards 0.8867 fibonacci level. On the downside, however, break of 0.8645 will suggest short term topping, and turn bias to the downside for deeper pullback.
In the bigger picture, the structure from 0.8221 medium term bottom are not impulsive enough to suggest that it's reversing the down trend from 0.9267 (2022 high). But even if it's a correction, firm break of 0.8737 will still pave the way to 61.8% retracement of 0.9267 to 0.8221 at 0.8867. For now, further rise will remain in favor as long as 55 W EMA (now at 0.8474) holds.
Cliff Notes: Resting on Data Dependency
Key insights from the week that was.
In Australia, the RBA’s July Minutes provided more colour around the Board’s diverse set of views on the balance of risks and the subsequent split decision. The case to cut the cash rate rested on the opinion that the current forecasts for inflation to settle around the mid-point of the target band and the recovery in economic growth may be too optimistic. This risk, particularly as it relates to a potentially slower pick-up in consumer spending, is clearly evident in recent card activity data.
While a minority of Board members favoured this view, the majority saw a small degree of upside inflation risk in the recent run of partial data, and hence sought to remain patient until the full quarterly reading can be assessed. The ultimate decision to keep policy unchanged underscores the majority’s preference to move policy in a ‘cautious and predictable’ manner. Provided the quarterly inflation data continues to indicate that inflation is on track to return to the mid-point of the target range, as we anticipate, August remains the most likely timing for the next rate cut.
Later in the week, Governor Bullock delivered a speech that largely reiterated the messaging from the decision statement and the minutes, but explored more detail in other areas. In this week’s essay, Chief Economist Luci Ellis delves into the RBA’s current thinking on the interaction between the supply and demand-sides of the economy and its implications for productivity.
Before moving offshore, our latest industry report puts the spotlight on Australian agriculture, assessing current trends for production and costs, the outlook for selected key commodities, and how well the industry is placed to weather the impact from US tariffs.
Globally, market participants continue to focus on US trade policy rumours and announcements. To date this week, the Trump administration has announced a 19% tariff on the Philippines and 15% for Japan, the former a touch higher than Liberation Day, the latter modestly below. Notably the 15% tariff rate for Japan applies to automobiles instead of the standard 25% rate, putting Japanese vehicle manufacturers at a significant advantage to those from South Korea and Europe who are yet to come to terms with the US on a deal.
Securing Japan’s improved terms was a commitment by the nation to invest USD550bn in the US economy through a fund that will reportedly provide equity financing, loans and other support to manufacturing plants, infrastructure and other investments in the US, according to Commerce Secretary Howard Lutnick. The significance of the deal for Japan was evident in the strong equity rally for Japanese automotive producers over the week.
Also of significance for Japan, ahead of the trade agreement announcement, the LDP–Komeito coalition experienced a historic loss, winning just 47 of the 50 seats required in Japan’s upper house election to maintain a majority. This comes after the coalition lost its majority in the lower house last year. The outcome reflects voter frustration amid compounding cost-of-living pressures, including a doubling of rice prices, and perceived government mismanagement. A multi-party coalition to unseat the LDP–Komeito alliance remains unlikely, but the resulting split government will make it more difficult for Japan to implement reforms aimed at boosting domestic demand and stabilising inflation at target.
For monetary policy and data, Europe was the focus this week. The ECB's Governing Council kept its policy rates unchanged at the July meeting. In the statement, they highlighted that "Domestic price pressures have continued to ease, with wages growing more slowly" while "the economy has so far proven resilient overall in a challenging global environment". On the outlook for policy, President Lagarde continued to emphasise that the Council is "well positioned" and "will follow a data-dependent and meeting-by-meeting approach to determining the appropriate monetary policy stance".
"Risks to economic growth remain tilted to the downside. Among the main risks are a further escalation in global trade tensions and associated uncertainties, which could dampen exports and drag down investment and consumption.” Moreover, a " stronger euro could bring inflation down further than expected…. [and] inflation could turn out to be lower if higher tariffs lead to lower demand for euro area exports and induce countries with overcapacity to reroute their exports to the euro area”. This skew in risks leads us to believe the ECB will likely deliver another 25bp cut at the September policy meeting and thereafter remain on hold at the lower-end of its neutral range, absent a material shock to activity or inflation.
The ECB bank lending survey for Q2 2025 also favours further easing, reporting "broadly unchanged credit standards for loans to firms amid geopolitical uncertainty and trade tensions" while "Credit standards tightened slightly for housing loans and more markedly for consumer credit". "Firms’ demand for loans increased slightly in net terms but remained weak overall.” Meanwhile, “Demand for housing loans continued to increase substantially... [but] demand for consumer credit increased only slightly". In sum, uncertainty over the outlook continues to limit the benefit of policy easing to economic growth.