
Sample Category Title
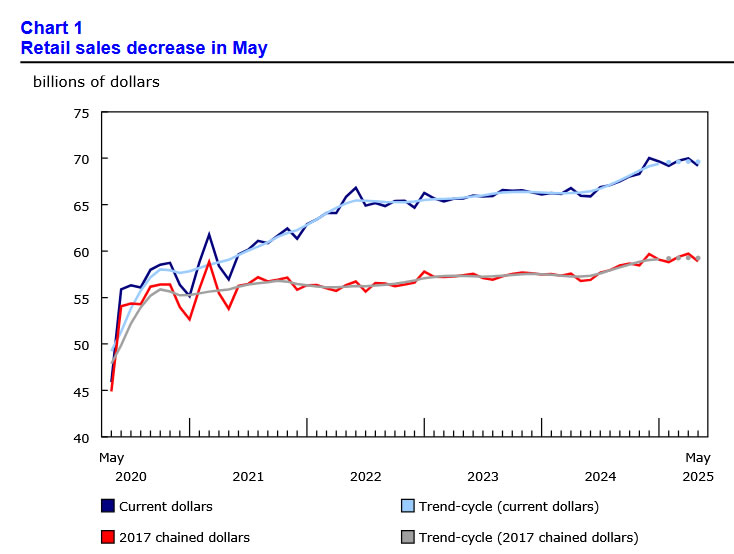
Canada: Retail Sales Plunge as Auto Sales Pull-Back in May
Retail sales contracted by 1.1% month-on-month (m/m) in May, matching Statistics Canada's advanced estimate.
After adjusting for inflation, the volume of retail sales declined 1.4% m/m.
The sharp pull-back was led by auto sales, which fell by 3.6% m/m as the tariff-driven front-loading seen in the prior two months reversed course. Ex-autos, sales were down 0.2%.
Receipts at gas stations and fuel vendors plunged by -2.7%, reflecting the second consecutive monthly decline in fuel prices due to the removal of the consumer carbon tax.
Excluding auto sales and receipts at gas stations, core retail sales were flat in May. Sales at food and beverage stores – the biggest contributor to core sales – declined by 1.2% m/m in May. Most other categories rose, with building material and garden equipment and supplies dealers leading with 1.9% gain.
E-commerce sales declined by 1.7% m/m in May.
Statistics Canada's advanced estimate suggests a rebound in June, with a gain of 1.6%.
Key Implications
The two-month surge in auto sales came to an abrupt halt in May. While we expect some rebound in June, the reversal will likely be limited. Core sales activity remains soft. On a real per capita basis – a metric that gained attention last year as a recession signal when adjusted for rapid population growth – sales are now in contraction for the second straight month.
Consumer caution remains the dominant theme. Despite some recovery in traditional confidence measures, Canadians appear to be treading carefully as they assess the impact of tariffs. The Bank of Canada’s new sentiment index declined in Q2, weighed down by soft consumer spending data. Similarly, our internal Spend data suggests only a weak recovery in June, with quarterly momentum still muted. This persistent weakness in household demand will weigh on growth in the second quarter.
GBP/USD Mid-Day Outlook
Daily Pivots: (S1) 1.3535; (P) 1.3560; (R1) 1.3604; More...
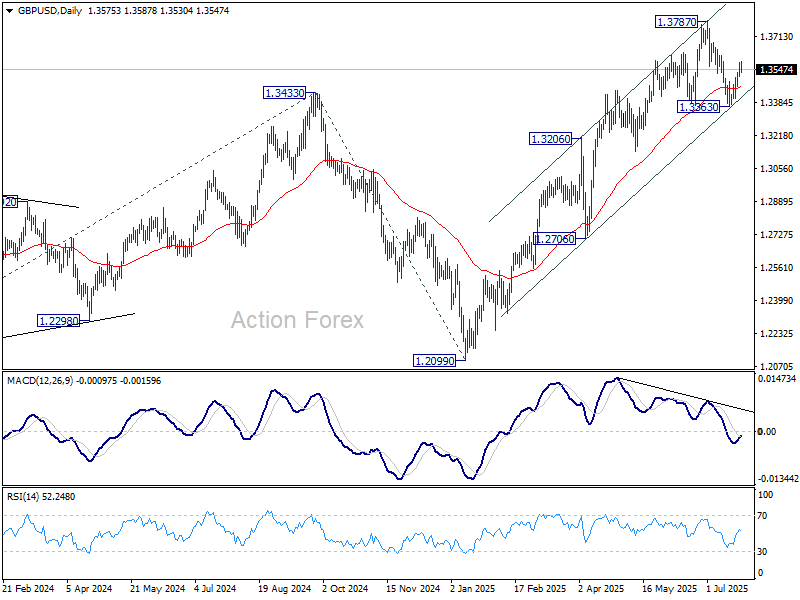
Intraday bias in GBP/USD is turned neutral first with current retreat. Some consolidations could be seen but risk will stay on the upside as long as 1.3363 support holds. On the upside, above 1.3587 will target a retest on 1.3787 high first. Firm break there will resume whole rally from 1.2099 to 1.4004 fibonacci level.

In the bigger picture, up trend from 1.3051 (2022 low) is in progress. Next medium term target is 61.8% projection of 1.0351 to 1.3433 from 1.2099 at 1.4004. Outlook will now stay bullish as long as 55 W EMA (now at 1.3017) holds, even in case of deep pullback.
EUR/USD Mid-Day Outlook
Daily Pivots: (S1) 1.1730; (P) 1.1753; (R1) 1.1794; More...
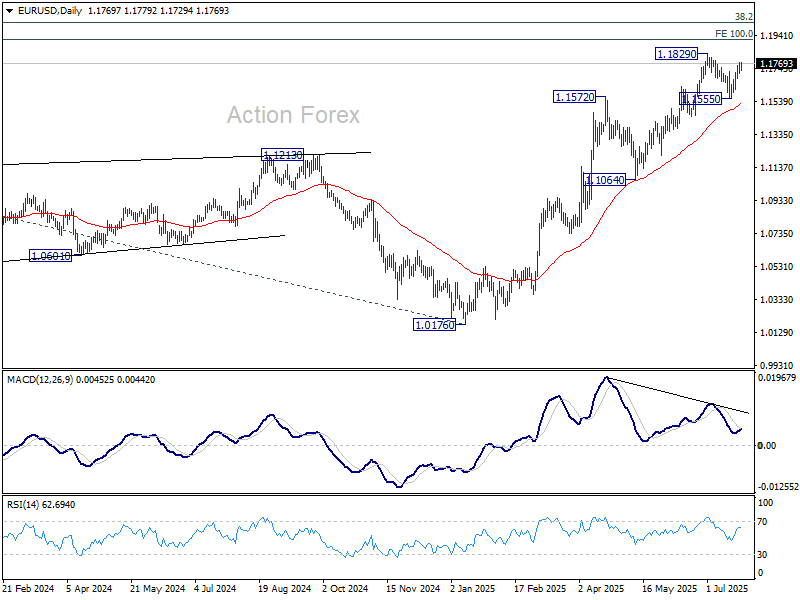
Intraday bias in EUR/USD remains on the upside at this point. Rise from 1.1555 is in progress for retesting 1.1829 high. Firm break there will resume whole rally from 1.0176, and target 1.1916 projection level. However, break of 1.1677 will delay the bullish case, and turn intraday bias neutral, with more consolidations below 1.1829 first.
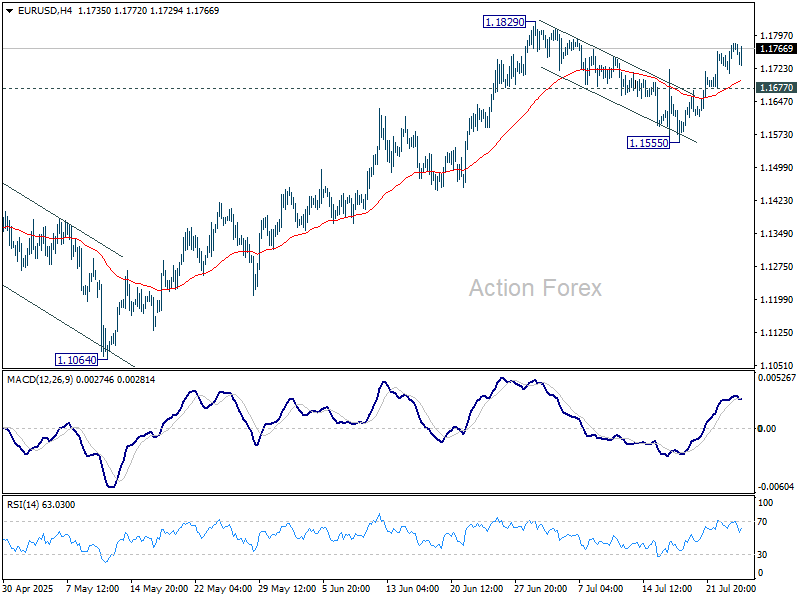
In the bigger picture, rise from 0.9534 long term bottom could be correcting the multi-decade downtrend or the start of a long term up trend. In either case, further rise should be seen to 100% projection of 0.9534 to 1.1274 from 1.0176 at 1.1916. This will remain the favored case as long as 1.1604 support holds.
Euro Steady as ECB Holds, Lagarde Signals Comfort with Current Stance
ECB held its deposit rate at 2.00% as widely expected, with President Christine Lagarde delivering a message of cautious optimism. Euro was little changed following the decision, as Lagarde emphasized in the press conference that inflation is at 2% and the economy is evolving in a “relatively favorable” manner.
Lagarde acknowledged progress on wages, which are now “slowing as expected,” and said inflation expectations remain “firmly anchored” in both the short and longer term. Although some ECB members remain concerned about the risk of undershooting the inflation target, Lagarde made clear that the central bank sees no immediate pressure to act.
She also reiterated that the ECB will continue to rely on a broad set of economic data in shaping its policy, not individual datapoints. That suggests a steady hand into the September meeting, when updated economic projections could guide the next move. Market speculation of a final rate cut persists, but the ECB appears to be in no rush.
Currency markets remained broadly aligned with the recent risk-on sentiment. Aussie continues to outperform for the week so far. Yen and kiwi also post broadly gains. Dollar remains the weakest performer, followed by Loonie and Swiss Franc. Euro and sterling are holding in the mid-pack.
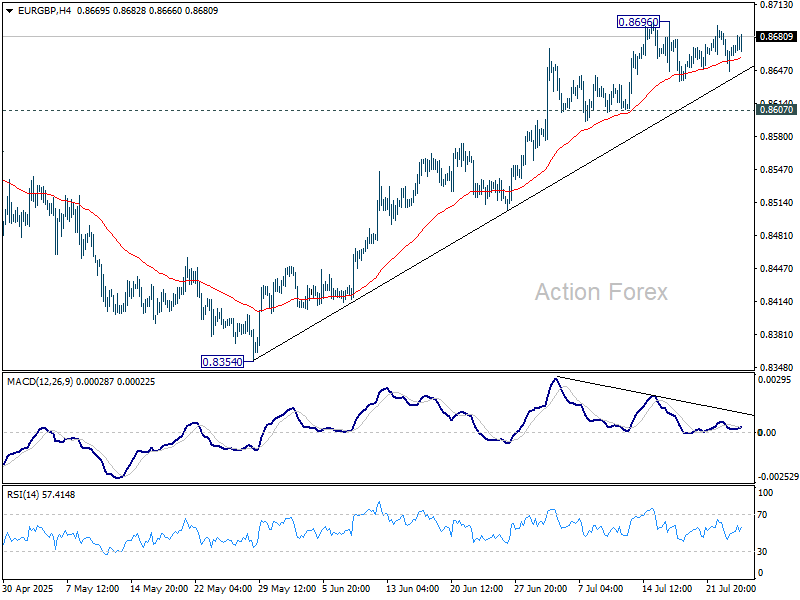
Technically, EUR/GBP's consolidations from 0.8696 continue today but based on the structure, it should be completing soon. Firm break of 0.8696 will resume the rally from 0.8354 to retest 0.8737 resistance.
In Europe, at the time of writing, FTSE is up 0.90%. DAX is up 0.31%. CAC is down -0.36%. UK 10-year yield is up 0.027 at 4.675. Germany 10-year yield is up 0.069 at 2.709. Earlier in Asia, Nikkei rose 1.59%. Hong Kong HSI rose 0.51%. China Shanghai SSE rose 0.65%. Singapore Strait Times rose 0.99%. Japan 10-year JGB yield rose 0.006 to 1.603.
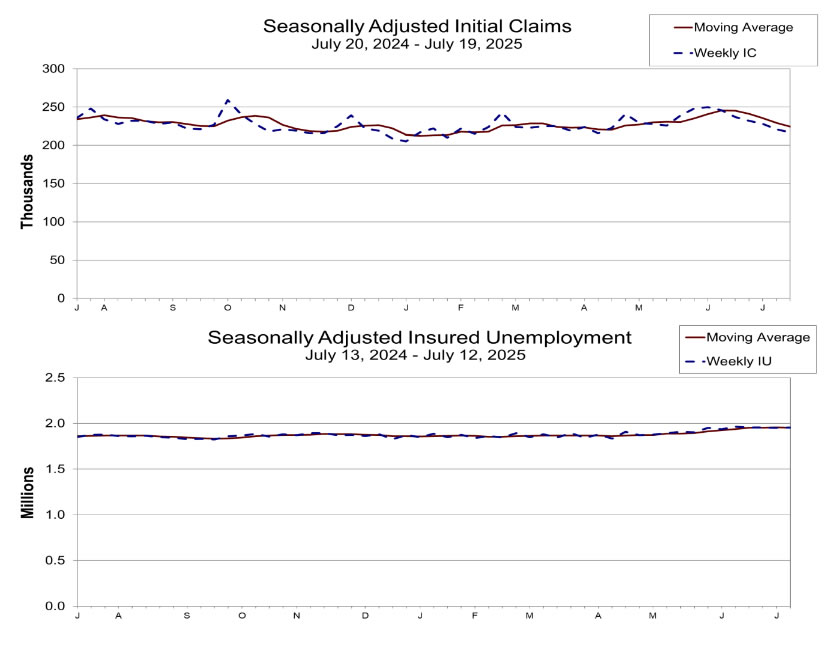
US initial jobless claims fall to 217k vs exp 230k
US initial jobless claims fell -4k to 217k in the week ending July 19, below expectation of 230k. Four-week moving average of initial claims fell -5k to 224.5k. Continuing claims rose 4k to 1955k in the week ending July 12. Four-week moving average of continuing claims fell -2k to 1954k.
Canadian retail sales fall -1.1% mom in May, but rebound seen ahead
Canadian retail sales fell -1.1% mom to CAD 69.2B in May, with the decline driven largely by -3.6% mom drop at motor vehicle and parts dealers. While the headline figure disappointed, core retail sales—which exclude autos and gasoline—were flat, suggesting underlying consumption was more stable than the headline suggests.
Looking ahead, Statistics Canada’s advance estimate points to a 1.6% mom rebound in June sales, which could help ease fears of weakening domestic demand.
ECB holds at 2.00%, not pre-committing to any rate path
The ECB held its deposit rate steady at 2.00% today, as expected, pausing its easing cycle after a string of cuts since June 2024. In its statement, the central bank reiterated that it will remain "data-dependent" and take a "meeting-by-meeting". It emphasized that approach, the Governing Council is "not pre-committing to a particular rate path".
Policymakers noted that incoming data is "broadly in line" with prior assessments, with domestic price pressures continuing to ease and wage growth slowing. However, the ECB flagged "exceptionally uncertain" global conditions, citing persistent trade disputes as a key risk.
UK PMI composite falls to 51, BoE cut pressure builds
The UK economy showed signs of losing momentum in July, with Composite PMI falling from 52.0 to 51.0. A modest rise in Manufacturing PMI to 48.2 from 47.7 failed to offset a sharp slowdown in services activity, which dropped from 52.8 to 51.2. Overall, the data point to a fragile expansion at the start of Q3.
Chris Williamson at S&P Global Market Intelligence warned that output growth is now consistent with just a 0.1% quarterly GDP gain, and that “risks are tilted to the downside.” Persistent job shedding across sectors underscores the underlying weakness, raising concerns about near-term demand conditions.
With growth stalling and the labor market softening, Williamson said that will add pressure to the BoE to deliver another rate cut in August. While recent inflation data surprised to the upside, the BoE could “look through” those pressures and prioritize support for a struggling economy.
Eurozone PMI composite hit 11-month high, gradually regaining momentum
Eurozone private sector activity accelerated in July, with Composite PMI rising from 50.6 to 51.0—its highest level in 11 months. Manufacturing PMI improved slightly from 49.5 to 49.8, a 36-month high, edging closer to the 50-mark that separates expansion from contraction. Services PMI climbed to a six-month high of 51.2, from 50.5, pointing to broad-based improvement across sectors.
Cyrus de la Rubia, Chief Economist at Hamburg Commercial Bank, said the data suggests the Eurozone economy is "gradually regaining momentum." The manufacturing recession is "coming to an end," while services growth has picked up. Their GDP Nowcast model indicates the region is on track for “robust economic growth” in Q3, with Germany likely to show slight expansion while France may post a mild contraction, partly due to its domestic political uncertainty.
For the ECB, the data offers some relief. Services inflation—a key focus for policymakers—continued to ease in July. While goods prices stabilized, a stronger Euro and ongoing US tariffs are expected to put downward pressure on price levels in the months ahead.
German GfK consumer sentiment dips to -21.5 as saving preference rises
German consumer confidence took another step back heading into August, with GfK Consumer Climate index falling to -21.5, down from -20.3 and missing expectations of -19.
The decline highlights persistent caution among households, delaying any meaningful rebound in consumer spending. According to Rolf Bürkl at NIM, the rise in saving appetite reflects a broader reluctance to commit to major purchases amid lingering uncertainty and elevated prices.
A durable improvement in sentiment, he emphasized, will require clearer signs of stability to reduce uncertainty and unlock household demand.
Japan's PMI composite unchanged at 51.5, inflation to ease over the summer
Japan’s Composite PMI was unchanged at 51.5 in July. Services drove growth, rising from 51.7 to 53.5, while Manufacturing slipped into contraction at 48.8, down from 50.1.
S&P Global noted that manufacturers saw weaker output and new orders, weighed down by tariff uncertainty and cautious customer behavior. Confidence weakened across the board, with optimism falling to the second-lowest level since August 2020. Firms responded by slowing hiring to the weakest pace in 18 months.
On the positive side, cost pressures eased, with input inflation at a four-year low—suggesting headline "inflation may ease further over the summer".
RBA's Bullock flags slower disinflation, sticks with gradual easing bias
RBA Governor Michele Bullock signaled in a speech caution over the inflation outlook, warning that the fall in trimmed mean inflation in Q2 "may not be quite as much as we forecast". While headline CPI is expected to dip into the lower half of the 2–3% target range, Bullock stressed that temporary cost-of-living relief is playing a role, and underlying pressures may prove more persistent. The RBA still anticipates inflation drifting toward 2.5%, but Bullock emphasized "we are looking for data to support this expectation".
On the labor market, Bullock dismissed surprise around the recent rise in unemployment to 4.3%, saying the outcome was in line with RBA’s May forecasts. Although the June monthly figure saw a noticeable uptick, vacancy rates remain stable and leading indicators "are not pointing to further significant increases in the unemployment rate in the near term."
Overall, she reaffirmed that a “measured and gradual” policy approach remains appropriate, especially with global risks—such as the trade war—showing signs of easing. Her remarks suggest the RBA remains on track for further easing, but will move cautiously, with the pace largely dictated by data flow—particularly the upcoming Q2 CPI print.
Australia PMI composite surges to 53.6, but inflation concerns linger
Australia’s private sector expanded more strongly in July, with the S&P Global Composite PMI rising from 51.6 to 53.6. Services led the way with a sharp rise from 51.8 to 53.8. Manufacturing returned to firmer growth at 51.6, up from 50.6.
S&P Global noted that business activity growth "hastened" at the start of Q3, supported by one of the fastest paces of new manufacturing orders in over two-and-a-half years.
However, the upbeat data came with warning signs. Business confidence slipped to an eight-month low, while manufacturers cut back on purchasing and slowed hiring. More critically, price pressures "intensified" during the month, pointing to renewed upside risks for inflation and "adding to the uncertainty for the interest rate outlook."
RBNZ’s Conway: Tariff fallout to cool NZ inflation
Speaking today, RBNZ Chief Economist Paul Conway said rising global tariffs and economic uncertainty are likely to "reduce medium-term inflation pressures" in New Zealand, and drag on the country’s economic rebound through mid-2026. While the US faces rising costs from tariff-induced supply chain disruptions, Conway said New Zealand is more likely to experience disinflation due to lower global growth and falling import prices.
He highlighted that strong export prices—particularly for dairy and beef—alongside lower domestic interest rates are supporting the economy for now. But widespread uncertainty is causing both consumers and firms to take a wait-and-see approach, which is curbing spending and delaying investment decisions.
Given this backdrop, Conway confirmed that the RBNZ retains a dovish tilt. If inflation continues to ease as expected, there is "scope to lower the OCR further".
EUR/USD Mid-Day Outlook
Daily Pivots: (S1) 1.1730; (P) 1.1753; (R1) 1.1794; More...
Intraday bias in EUR/USD remains on the upside at this point. Rise from 1.1555 is in progress for retesting 1.1829 high. Firm break there will resume whole rally from 1.0176, and target 1.1916 projection level. However, break of 1.1677 will delay the bullish case, and turn intraday bias neutral, with more consolidations below 1.1829 first.
In the bigger picture, rise from 0.9534 long term bottom could be correcting the multi-decade downtrend or the start of a long term up trend. In either case, further rise should be seen to 100% projection of 0.9534 to 1.1274 from 1.0176 at 1.1916. This will remain the favored case as long as 1.1604 support holds.
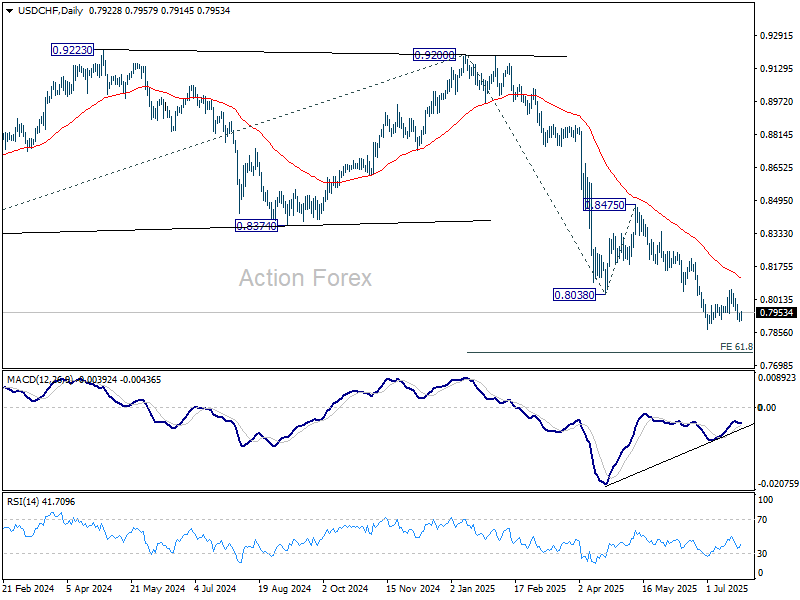
USD/CHF Mid-Day Outlook
Daily Pivots: (S1) 0.7907; (P) 0.7929; (R1) 0.7946; More….
Intraday bias in USD/CHF is turned neutral first with current recovery. Below 0.7910 will bring retest of 0.7871 support. Firm break there will resume larger down trend and target 61.8% projection of 0.9200 to 0.8038 from 0.8475 at 0.7757. On the upside, break of 0.7990 minor resistance will bring stronger rebound to extend the corrective pattern from 0.7871.
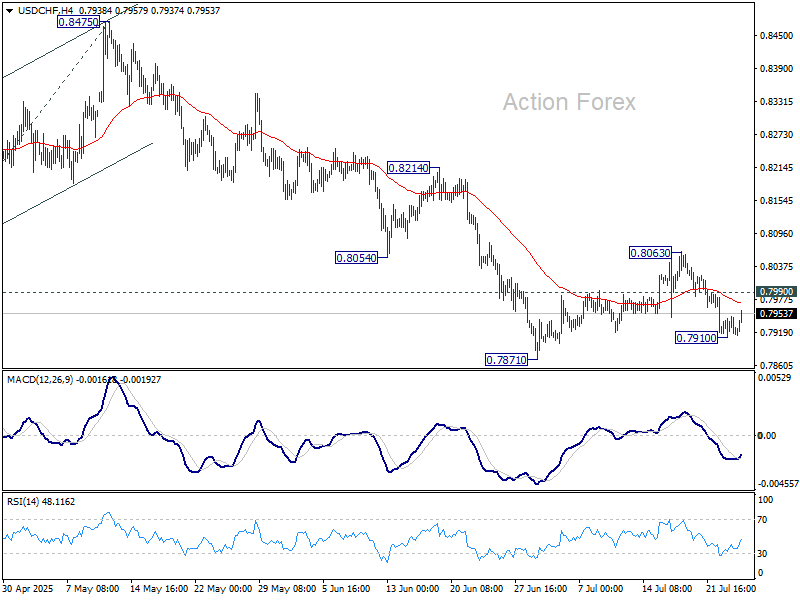
In the bigger picture, long term down trend from 1.0342 (2017 high) is still in progress. Next target is 100% projection of 1.0146 (2022 high) to 0.8332 from 0.9200 at 0.7382. In any case, outlook will stay bearish as long as 0.8475 resistance holds.
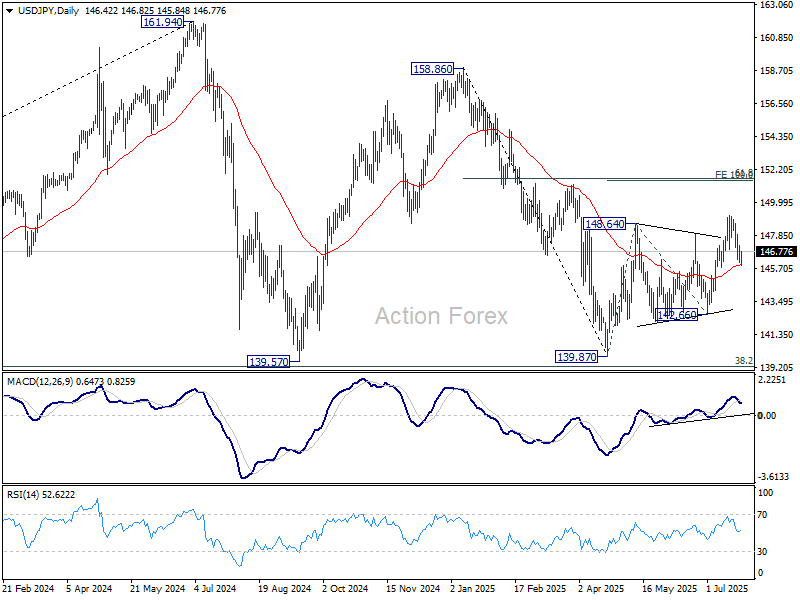
USD/JPY Mid-Day Outlook
Daily Pivots: (S1) 146.02; (P) 146.62; (R1) 147.12; More...
Outlook in USD/JPY is unchanged and intraday bias stays neutral. As long as 55 D EMA (now at 145..91 ) holds, further rally is still expected. On the upside, above 147.94 minor resistance will bring retest of 149.17. Firm break there will target 100% projection of 139.87 to 148.64 from 142.66 at 151.43. That is close to 61.8% retracement of 158.86 to 139.87 at 151.22. However, sustained trading below 55 D EMA will argue that the whole rebound from 139.87 might have completed and target 142.66 support for confirmation.
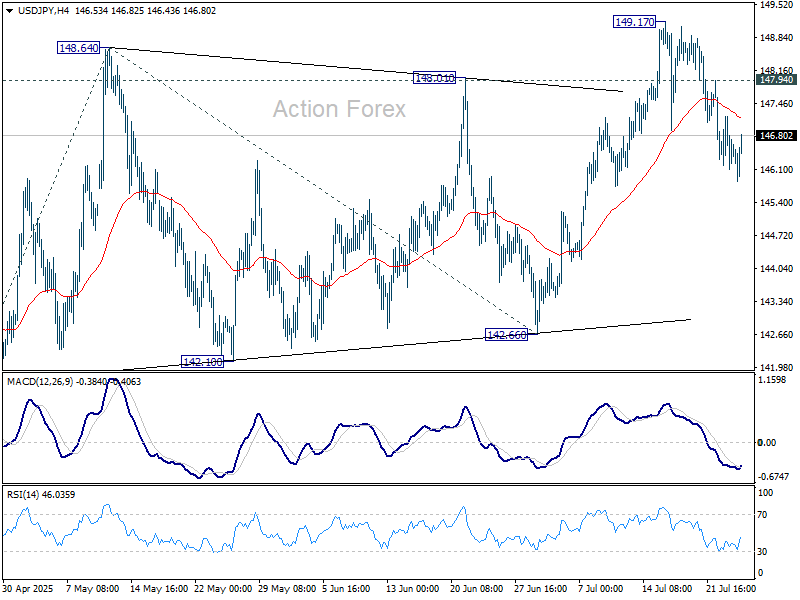
In the bigger picture, price actions from 161.94 (2024 high) are seen as a corrective pattern to rise from 102.58 (2021 low). There is no clear sign that the pattern has completed yet. But still, strong support is expected from 38.2% retracement of 102.58 to 161.94 at 139.26 to bring rebound. in case of another fall.
Canadian retail sales fall -1.1% mom in May, but rebound seen ahead
Canadian retail sales fell -1.1% mom to CAD 69.2B in May, with the decline driven largely by -3.6% mom drop at motor vehicle and parts dealers. While the headline figure disappointed, core retail sales—which exclude autos and gasoline—were flat, suggesting underlying consumption was more stable than the headline suggests.
Looking ahead, Statistics Canada’s advance estimate points to a 1.6% mom rebound in June sales, which could help ease fears of weakening domestic demand.
US initial jobless claims fall to 217k vs exp 230k
US initial jobless claims fell -4k to 217k in the week ending July 19, below expectation of 230k. Four-week moving average of initial claims fell -5k to 224.5k.
Continuing claims rose 4k to 1955k in the week ending July 12. Four-week moving average of continuing claims fell -2k to 1954k.
ECB holds at 2.00%, not pre-committing to any rate path
The ECB held its deposit rate steady at 2.00% today, as expected, pausing its easing cycle after a string of cuts since June 2024. In its statement, the central bank reiterated that it will remain "data-dependent" and take a "meeting-by-meeting". It emphasized that approach, the Governing Council is "not pre-committing to a particular rate path".
Policymakers noted that incoming data is "broadly in line" with prior assessments, with domestic price pressures continuing to ease and wage growth slowing. However, the ECB flagged "exceptionally uncertain" global conditions, citing persistent trade disputes as a key risk.
(ECB) Monetary policy decisions
24 July 2025
The Governing Council today decided to keep the three key ECB interest rates unchanged. Inflation is currently at the 2% medium-term target. The incoming information is broadly in line with the Governing Council’s previous assessment of the inflation outlook. Domestic price pressures have continued to ease, with wages growing more slowly. Partly reflecting the Governing Council’s past interest rate cuts, the economy has so far proven resilient overall in a challenging global environment. At the same time, the environment remains exceptionally uncertain, especially because of trade disputes.
The Governing Council is determined to ensure that inflation stabilises at its 2% target in the medium term. It will follow a data-dependent and meeting-by-meeting approach to determining the appropriate monetary policy stance. In particular, the Governing Council’s interest rate decisions will be based on its assessment of the inflation outlook and the risks surrounding it, in light of the incoming economic and financial data, as well as the dynamics of underlying inflation and the strength of monetary policy transmission. The Governing Council is not pre-committing to a particular rate path.
Key ECB interest rates
The interest rates on the deposit facility, the main refinancing operations and the marginal lending facility will remain unchanged at 2.00%, 2.15% and 2.40% respectively.
Asset purchase programme (APP) and pandemic emergency purchase programme (PEPP)
The APP and PEPP portfolios are declining at a measured and predictable pace, as the Eurosystem no longer reinvests the principal payments from maturing securities.
***
The Governing Council stands ready to adjust all of its instruments within its mandate to ensure that inflation stabilises at its 2% target in the medium term and to preserve the smooth functioning of monetary policy transmission. Moreover, the Transmission Protection Instrument is available to counter unwarranted, disorderly market dynamics that pose a serious threat to the transmission of monetary policy across all euro area countries, thus allowing the Governing Council to more effectively deliver on its price stability mandate.
The President of the ECB will comment on the considerations underlying these decisions at a press conference starting at 14:45 CET today.