Sample Category Title
Trump Indicates Base Case is for Reciprocal Tariffs Between 15% and 50%.
Markets
The Japan-US trade deal set the tone for global trading yesterday. The agreement including a broad (reciprocal) tariff of 15% with commitments on investment and opening up domestic markets for US exports, was seen as a blueprint for deals with other major trading patterns, potentially also with EU. The prospect of trade uncertainty moving to background triggered a risk rally specially among US trading partners. The EuroStoxx 50 closed 1.02% higher. The S&P 500 (6358.91; +0.78%) finished at a record. Sentiment even was further supported by a FT report after the close of European equity markets indicating that the EU and the US indeed were closing in a trade deal. The headlines also triggered a sharp rise in EMU (and to a lesser extent US) yields. German yields rose between 3.2 bps (2-y) and 5.6 bps (30-y). The underperformance at the long end suggests that the topic of fiscal sustainability is still in play. US yields added between 4.7 bps (2-y) and 1.8 bps (30-y). LT US yields eased modestly after a decent US 20-y bond sale. Trade optimism (despite higher US yields) helped non-USD currencies. DXY extended this week’s decline (close 97.2). EUR/USD finished at 1.177. Cyclical currencies like the Aussie dollar also were well bid (AUD/USD jumped north of 0.66). Even de yen, still haunted by fiscal/political uncertainty, slightly underperformed the USD (USD/JPY 146.5).
Overnight, president Trump indicated that the US base case is for reciprocal tariffs between 15% and 50%. So the floor might be higher than the 10% than some hoped for. For now, these comments don’t dent trade driven market optimism. Most Asian equity indices continue yesterday’s rally. The dollar still trades in the defensive (EUR/USD 1.1775, USD/JPY 146.0). Japanese and US yields also gain modestly. Trade related headlines most likely will dominate market sentiment also today. At the same time, the (US & EMU) PMI’s and the ECB policy decision are also worth keeping an eye on. The EMU composite PMI is expected to hold just north of the 50 barrier (expected 50.7). PMI’s are providing an insight on the EMU eco momentum ‘on the eve’ of a potential US-EU trade deal. The US PMI is expected to hold at a solid 52.8. Even more than is the case for Europe, we keep a close eye the price indictors in the US PMI. The ECB, after reducing the policy rate to 2% early June, indicated that it was in a good place to assess upcoming developments, including trade risks. This put the bank in data-dependent wait-and-see modus. With recent inflation data coming in close to expectations and no concrete trade deal available, the GC today has every reason to keep that wait-and-see approach and not commit on if/when they wat might consider a final easing step for this cycle. The September forecasts will provide the next evaluation point. Yields might continue their (trade-related, risk-on driven) rise. The dollar is holding in the defensive.
News & Views
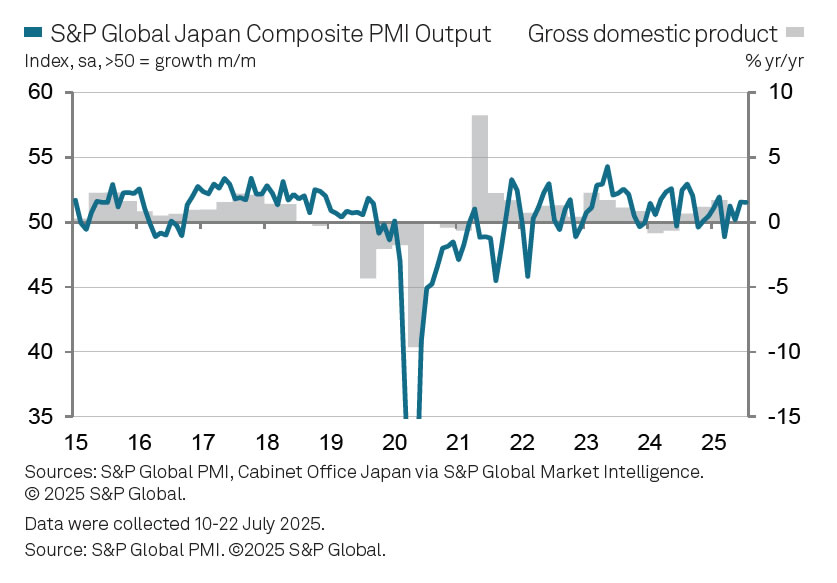
Japanese PMI’s in July diverged with the manufacturing gauge easing from 50.1 to 48.8 but the services one improving from 51.7 to the second-highest reading of the year so far at 53.5. The composite figure matched June’s 51.5. Increased services activity was linked to firmer demand conditions and client numbers while lingering uncertainty over future US trade policy was one of the key elements weighing down on the industry. The latter, of course, may be less of an issue in coming readings thanks to the freshly closed trade deal. Services companies recorded a sustained rise in new work while orders continued to decline in the factories. Japanese private firms adopted a more cautious stance regarding hiring, with the weakest increase in 1.5 years. This comes amid lower business confidence for the year ahead, across sectors, hitting the second-lowest since August 2020 (after April 2025) on trade-related uncertainty. Input cost inflation eased to the weakest in four years but remained sharp overall on higher labour, fuel and raw material costs. Companies as a result increased selling prices again in July at a solid rate.
South Korea’s economy expanded at a faster-than-expected clip of 0.6% q/q in Q2 of this year, bouncing back from a 0.2% contraction in Q1 and bringing GDP 0.6% higher than one year ago. Growth was driven by the services sector (+0.6% q/q), suggesting private consumption at work. Manufacturing grew 2.7% q/q while construction (-4.4%) and the utility sector (-3.2%) weighed on the economy. The upbeat numbers limit the probability of a near-term (ie August) rate cut by the Bank of Korea, which is likely to revise its growth forecasts higher at the next meeting. The Korean won strengthens to USD/KRW 1365.5 this morning with first KRW resistance at 1350 coming closer.
GBP/USD Daily Outlook
Daily Pivots: (S1) 1.3535; (P) 1.3560; (R1) 1.3604; More...
GBP/USD's break of 1.3561 support turned resistance suggests that correction from 1.3787 has completed at 1.3363 already. Intraday bias is back on the upside for retesting 1.3787. Firm break there will resume whole rally from 1.2099 to 1.4004 fibonacci level. For now, risk will stay on the upside as long as 1.3363 support holds, in case of retreat.
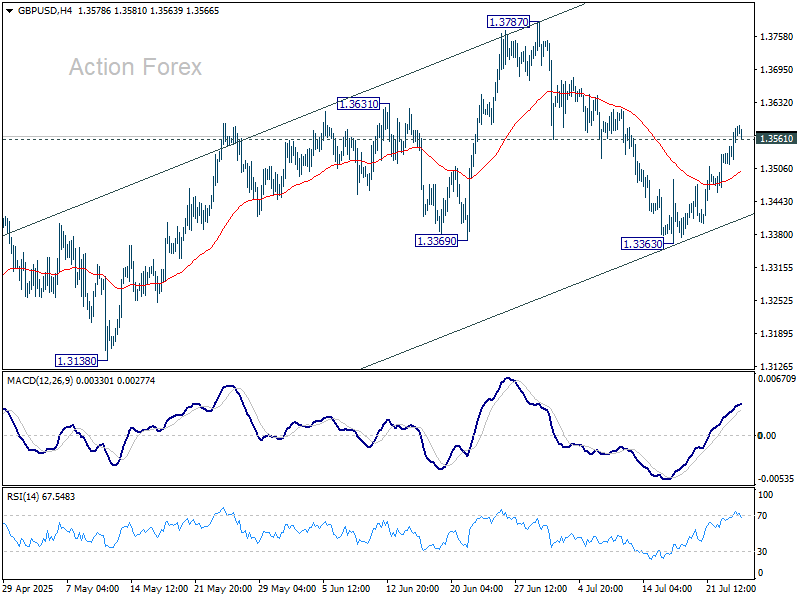
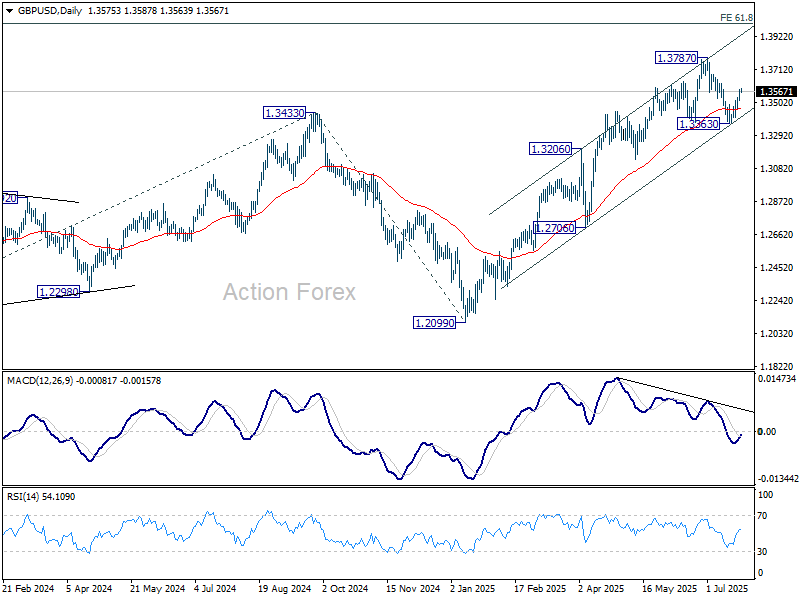
In the bigger picture, up trend from 1.3051 (2022 low) is in progress. Next medium term target is 61.8% projection of 1.0351 to 1.3433 from 1.2099 at 1.4004. Outlook will now stay bullish as long as 55 W EMA (now at 1.3017) holds, even in case of deep pullback.
Focus Shifts to ECB and Trump’s Fed Visit as Markets Cheer Trade Progress
Global risk appetite extended higher, with S&P 500 and NASDAQ both setting new record highs overnight. DOW also surged over 500 pts, driven by optimism following the US-Japan trade deal. In Asia, Japan’s Nikkei continued its charge, with current momentum suggesting a record high could be imminent. The breakthrough between Washington and Tokyo boosted hopes for similar progress in other key trade relationships. The worst-case tariff scenarios seem to be receding quickly, even though uncertainty still lingers.
In the currency markets, Yen has outperformed this week so far, with Aussie not far behind. Australian Dollar was supported by both risk-on flows and cautious remarks from RBA Governor Bullock, who refrained from confirming an August cut. Kiwi is also firm, while Dollar is the week’s laggard, followed by Loonie and Swiss Franc. Euro and Sterling sit mid-pack.
The ECB takes center stage today, though few surprises are expected. Deposit are expected to remain unchanged at 2.00%, and President Christine Lagarde will probably avoid strong forward guidance given global uncertainties. September, with its updated projections and clearer trade outlook, is likely to bring a more decisive signal from the central bank. For now, today’s decision is seen largely as a placeholder.
Meanwhile, US President Donald Trump is set to visit the Fed, marking the first time in nearly two decades that a president makes an official appearance at the central bank. The symbolic move raises concerns about Fed independence, especially amid Trump’s repeated criticisms of Chair Jerome Powell. While speculation over Powell’s removal has circulated, Treasury Secretary Bessent said a successor will only be nominated near year-end, helping to dampen immediate fears.
On the trade front, in South Korea, hopes for a last-minute trade agreement were dealt a blow as the key 2+2 meeting with US officials was postponed. With tariffs looming from August 1, Seoul’s window to reach a deal is closing fast. The best outcome now may be an extension of negotiations.
Meanwhile, in Beijing, EU leaders met with Chinese President Xi Jinping to mark 50 years of relations. But with tensions over trade and the Ukraine war, expectations were low. European Commission President Ursula von der Leyen stressed rebalancing in trade, while Chinese President Xi Jinping urged “strategic choices” and deeper cooperation. The summit was cut to one day amid rising geopolitical and economic frictions, highlight the fragile state of EU-China relations.
In Asia, at the time of writing, Nikkei is up 1.81%. Hong Kong HSI is up 0.37%. China Shanghai SSE is up 0.48%. Singapore Strait Times is up 0.75%. Japan 10-year JGB yield is up 0.004 at 1.601. Overnight, DOW rose 1.14%. S&P 500 rose 0.78%. NASDAQ rose 0.61%. 10-year yield rose 0.052 to 4.388.
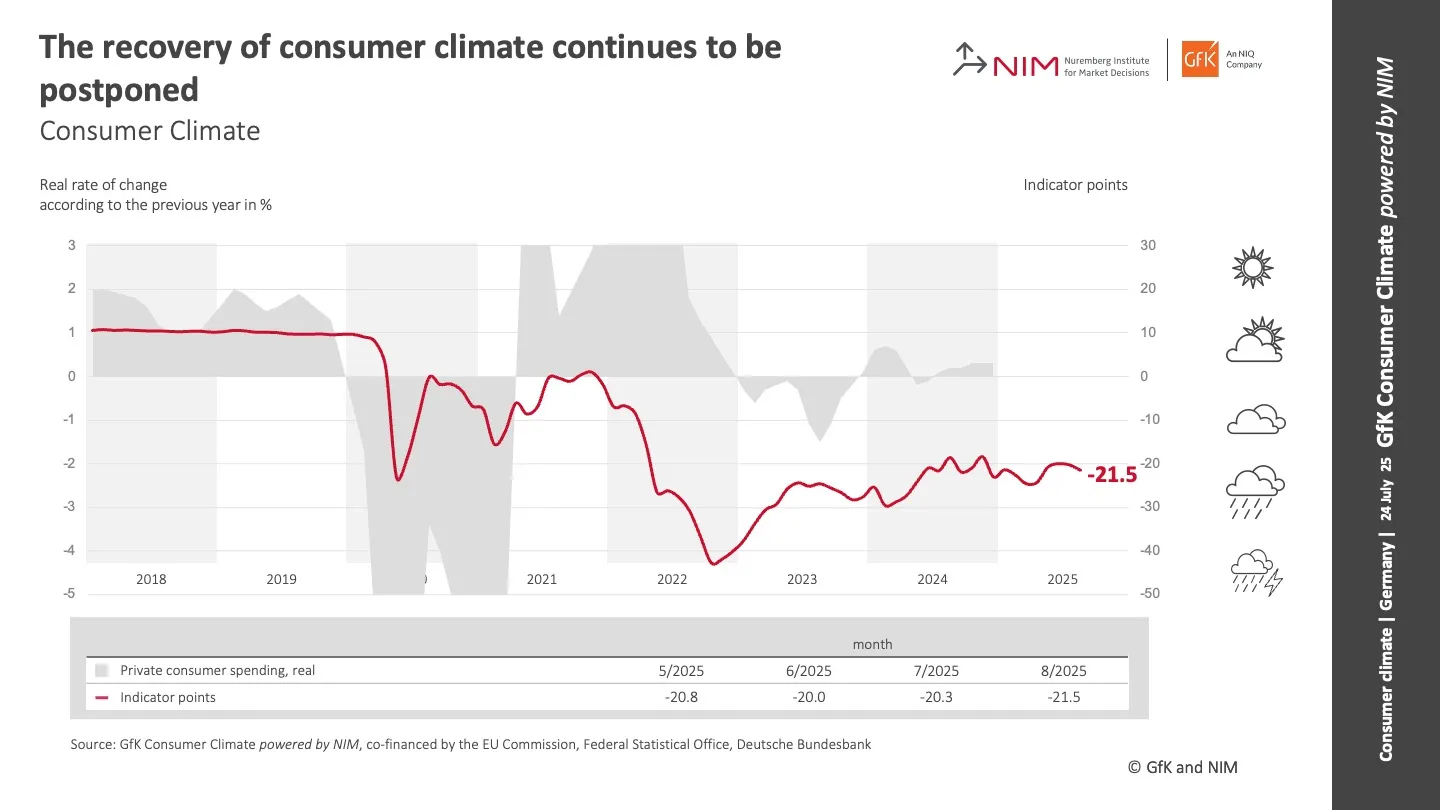
German GfK consumer sentiment dips to -21.5 as saving preference rises
German consumer confidence took another step back heading into August, with GfK Consumer Climate index falling to -21.5, down from -20.3 and missing expectations of -19.
The decline highlights persistent caution among households, delaying any meaningful rebound in consumer spending. According to Rolf Bürkl at NIM, the rise in saving appetite reflects a broader reluctance to commit to major purchases amid lingering uncertainty and elevated prices.
A durable improvement in sentiment, he emphasized, will require clearer signs of stability to reduce uncertainty and unlock household demand.
Japan's PMI composite unchanged at 51.5, inflation to ease over the summer
Japan’s Composite PMI was unchanged at 51.5 in July. Services drove growth, rising from 51.7 to 53.5, while Manufacturing slipped into contraction at 48.8, down from 50.1.
S&P Global noted that manufacturers saw weaker output and new orders, weighed down by tariff uncertainty and cautious customer behavior. Confidence weakened across the board, with optimism falling to the second-lowest level since August 2020. Firms responded by slowing hiring to the weakest pace in 18 months.
On the positive side, cost pressures eased, with input inflation at a four-year low—suggesting headline "inflation may ease further over the summer".
RBA's Bullock flags slower disinflation, sticks with gradual easing bias
RBA Governor Michele Bullock signaled in a speech caution over the inflation outlook, warning that the fall in trimmed mean inflation in Q2 "may not be quite as much as we forecast". While headline CPI is expected to dip into the lower half of the 2–3% target range, Bullock stressed that temporary cost-of-living relief is playing a role, and underlying pressures may prove more persistent. The RBA still anticipates inflation drifting toward 2.5%, but Bullock emphasized "we are looking for data to support this expectation".
On the labor market, Bullock dismissed surprise around the recent rise in unemployment to 4.3%, saying the outcome was in line with RBA’s May forecasts. Although the June monthly figure saw a noticeable uptick, vacancy rates remain stable and leading indicators "are not pointing to further significant increases in the unemployment rate in the near term."
Overall, she reaffirmed that a “measured and gradual” policy approach remains appropriate, especially with global risks—such as the trade war—showing signs of easing. Her remarks suggest the RBA remains on track for further easing, but will move cautiously, with the pace largely dictated by data flow—particularly the upcoming Q2 CPI print.
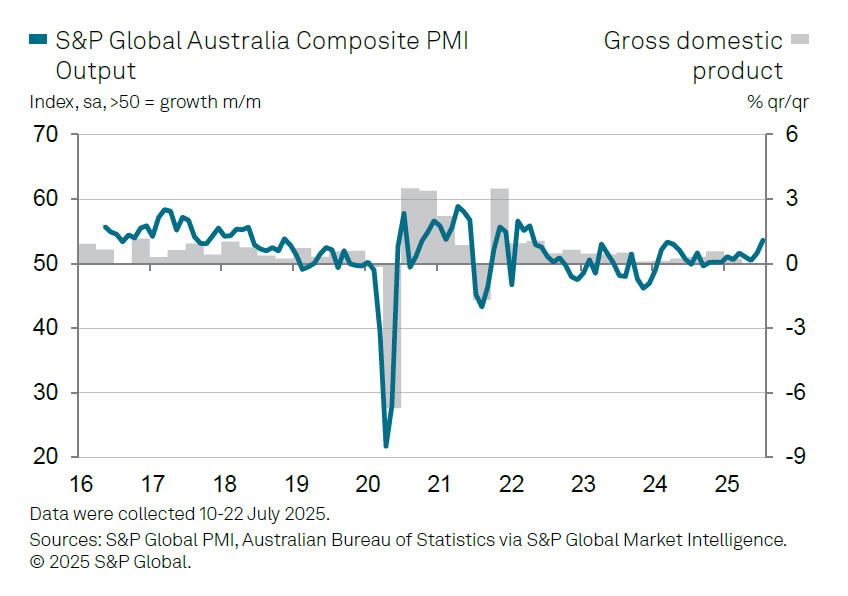
Australia PMI composite surges to 53.6, but inflation concerns linger
Australia’s private sector expanded more strongly in July, with the S&P Global Composite PMI rising from 51.6 to 53.6. Services led the way with a sharp rise from 51.8 to 53.8. Manufacturing returned to firmer growth at 51.6, up from 50.6.
S&P Global noted that business activity growth "hastened" at the start of Q3, supported by one of the fastest paces of new manufacturing orders in over two-and-a-half years.
However, the upbeat data came with warning signs. Business confidence slipped to an eight-month low, while manufacturers cut back on purchasing and slowed hiring. More critically, price pressures "intensified" during the month, pointing to renewed upside risks for inflation and "adding to the uncertainty for the interest rate outlook."
RBNZ’s Conway: Tariff fallout to cool NZ inflation
Speaking today, RBNZ Chief Economist Paul Conway said rising global tariffs and economic uncertainty are likely to "reduce medium-term inflation pressures" in New Zealand, and drag on the country’s economic rebound through mid-2026. While the US faces rising costs from tariff-induced supply chain disruptions, Conway said New Zealand is more likely to experience disinflation due to lower global growth and falling import prices.
He highlighted that strong export prices—particularly for dairy and beef—alongside lower domestic interest rates are supporting the economy for now. But widespread uncertainty is causing both consumers and firms to take a wait-and-see approach, which is curbing spending and delaying investment decisions.
Given this backdrop, Conway confirmed that the RBNZ retains a dovish tilt. If inflation continues to ease as expected, there is "scope to lower the OCR further".
GBP/USD Daily Outlook
Daily Pivots: (S1) 1.3535; (P) 1.3560; (R1) 1.3604; More...
GBP/USD's break of 1.3561 support turned resistance suggests that correction from 1.3787 has completed at 1.3363 already. Intraday bias is back on the upside for retesting 1.3787. Firm break there will resume whole rally from 1.2099 to 1.4004 fibonacci level. For now, risk will stay on the upside as long as 1.3363 support holds, in case of retreat.
In the bigger picture, up trend from 1.3051 (2022 low) is in progress. Next medium term target is 61.8% projection of 1.0351 to 1.3433 from 1.2099 at 1.4004. Outlook will now stay bullish as long as 55 W EMA (now at 1.3017) holds, even in case of deep pullback.
German GfK consumer sentiment dips to -21.5 as saving preference rises
German consumer confidence took another step back heading into August, with GfK Consumer Climate index falling to -21.5, down from -20.3 and missing expectations of -19.
The decline highlights persistent caution among households, delaying any meaningful rebound in consumer spending. According to Rolf Bürkl at NIM, the rise in saving appetite reflects a broader reluctance to commit to major purchases amid lingering uncertainty and elevated prices.
A durable improvement in sentiment, he emphasized, will require clearer signs of stability to reduce uncertainty and unlock household demand.
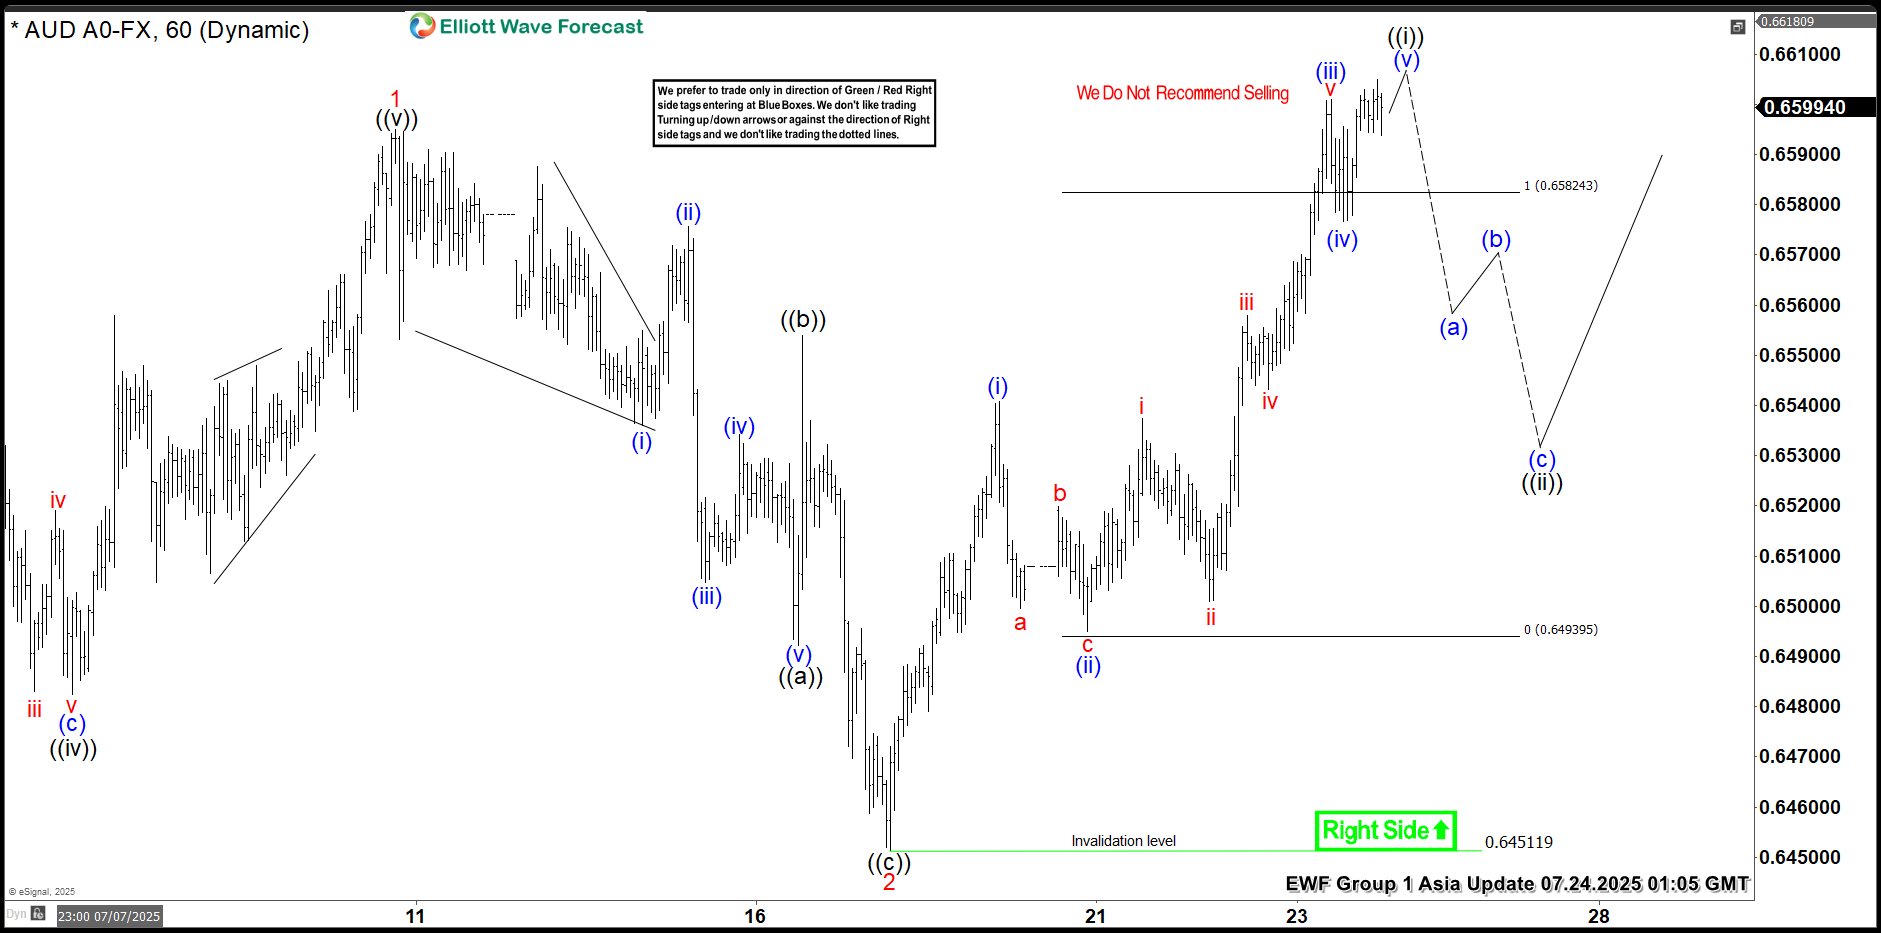
AUDUSD Elliott Wave Outlook: Impulse Pattern Approaching To End
The AUDUSD pair is showing higher high from 4.09.2025 low, expecting rally to continue from 5.12.2025 low. It favors zigzag corrective bounce from April-2025 low & should continue rally against 0.6451 low. In daily, it started corrective bounce from 4.09.2025 low & may extend towards 0.6720 – 0.6955 area in next few weeks. Above 4.09.2025 low, it ended (A) at 0.6515 high of 5.06.2025, (B) at 0.6354 low of 5.12.2025 & favors upside in (C). Ideally, (C) can extend towards 0.6955 or higher levels, while pullback holds above 5.12.2025 low. Within (C), it placed 1 at 0.6595 high, 2 at 0.6451 low in corrective pullback & favors upside in 3. Within 1, it ended ((i)) at 0.6552 high, ((ii)) at 0.6369 low, ((iii)) at 0.6590 high, ((iv)) at 0.6451 low & ((v)) at 0.6595 high in overlapping diagonal. Below 1 high, it ended 2 in zigzag correction at extreme area before resume rally in 3.
It placed ((a)) of 2 at 0.6492 low in 5 swings, ((b)) at 0.6554 high & ((c)) at 0.6451 low in 5 swings. Wave 2 pullback ended at 0.618 Fibonacci retracement of 1. Within 3, it favors impulse in ((i)) started from 7.17.2025 low. It placed (i) of ((i)) at 0.6540 high, (ii) at 0.6495 low, (iii) at 0.6601 high, (iv) at 0.6576 low & favor upside in (v) targeting in to 0.6606 – 0.6637 area to finish it. It already reached minimum area, but can see more upside above 0.6593 low. Alternatively, the current move even can be (iii) of ((i)) followed by small pullback in (iv) & higher in (v). Later, it expects ((ii)) to correct in 3, 7 or 11 swings against 7.17.2025 low & find support from extreme area to continue rally. Wave 3 should extend in to 0.6692 – 0.6841 area in 5 swings before correcting in 4 of (C). We like to buy the pullback in 3, 7 or 11 swings at extreme area against 7.17.2025 low.
AUDUSD – 60-Minute Elliott Wave Technical Chart:
AUDUSD Elliott Wave Technical Video:
https://www.youtube.com/watch?v=S0Yb29upmlM
RBA’s Bullock flags slower disinflation, sticks with gradual easing bias
RBA Governor Michele Bullock signaled in a speech caution over the inflation outlook, warning that the fall in trimmed mean inflation in Q2 "may not be quite as much as we forecast". While headline CPI is expected to dip into the lower half of the 2–3% target range, Bullock stressed that temporary cost-of-living relief is playing a role, and underlying pressures may prove more persistent. The RBA still anticipates inflation drifting toward 2.5%, but Bullock emphasized "we are looking for data to support this expectation".
On the labor market, Bullock dismissed surprise around the recent rise in unemployment to 4.3%, saying the outcome was in line with RBA’s May forecasts. Although the June monthly figure saw a noticeable uptick, vacancy rates remain stable and leading indicators "are not pointing to further significant increases in the unemployment rate in the near term."
Overall, she reaffirmed that a “measured and gradual” policy approach remains appropriate, especially with global risks—such as the trade war—showing signs of easing. Her remarks suggest the RBA remains on track for further easing, but will move cautiously, with the pace largely dictated by data flow—particularly the upcoming Q2 CPI print.
Ethereum Cools After Rally, But Bulls Eye $4K in Post-Pullback Surge
Key Highlights
- Ethereum gained over 25% and tested the $3,850 resistance zone.
- ETH is now well above a connecting bullish trend line with support at $3,150 on the daily chart.
- Bitcoin price is consolidating gains below the $120,000 resistance.
- XRP rallied toward the $3.65 resistance before trimming some gains.
Ethereum Technical Analysis
Ethereum started a major increase above the $2,650 and $2,800 resistance levels. ETH cleared the $3,000 barrier and rallied above $3,500 before facing hurdles.
Looking at the daily chart, the price settled above the $3,500 level and the 100-day simple moving average (red). A high was formed at $3,856 and the price is now consolidating gains. On the downside, Ethereum might find support near the $3,500 level.
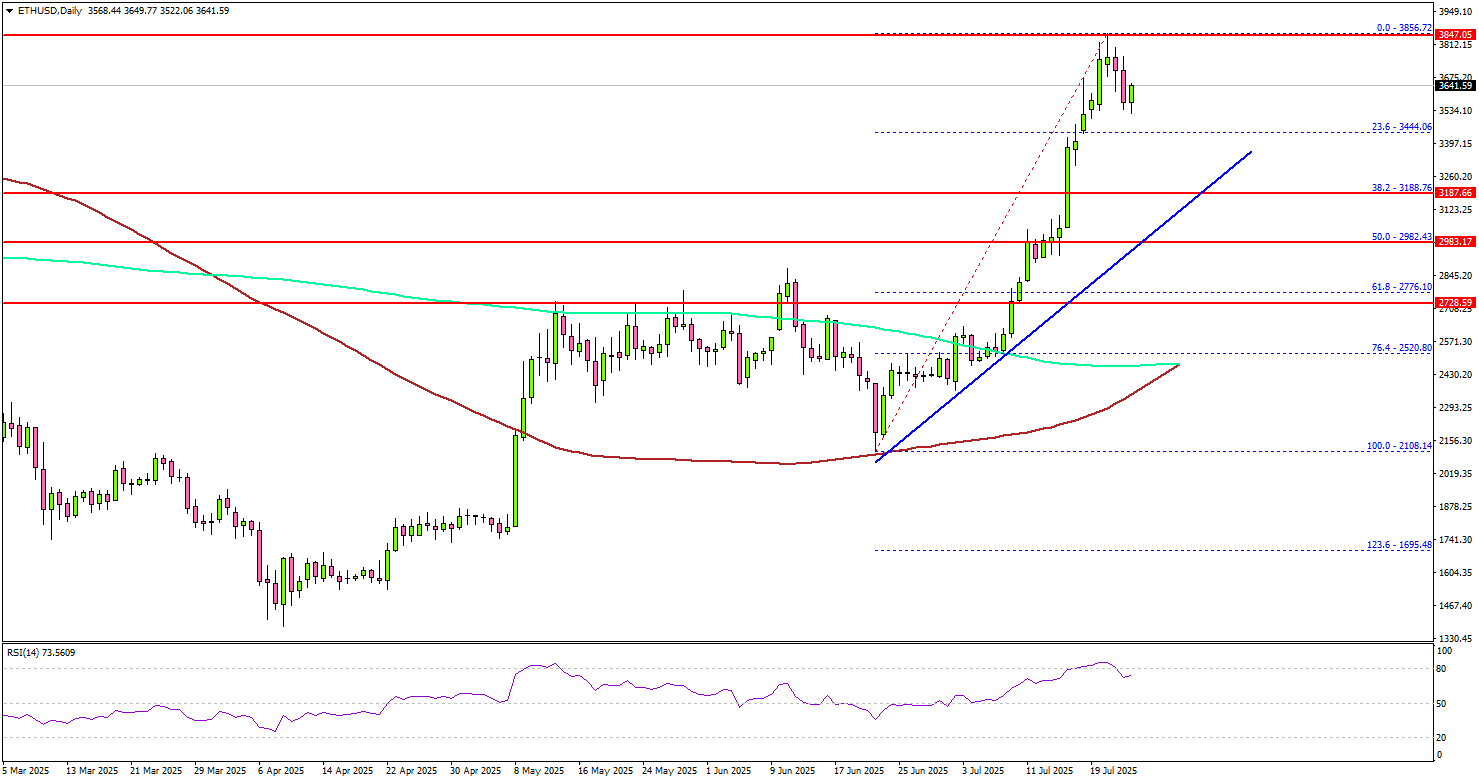
The next major support is $3,450 or the 23.6% Fib retracement level of the upward move from the $2,108 swing low to the $3,856 high, below which the price could slide toward $3,200.
There is also a connecting bullish trend line forming with support at $3,150 on the same chart. Any more losses might call for a move toward the $3,000 level or the 50% Fib retracement level of the upward move from the $2,108 swing low to the $3,856 high.
On the upside, the price is facing hurdles near the $3,800 level. The next major resistance is near the $3,850 level. A daily close above the $3,850 resistance zone could start another steady increase. In the stated case, the price may perhaps rise toward the $4,000 level. The next stop for the bulls may perhaps be $4,200.
Looking at Bitcoin, there was a steady increase above the $118,000 level but the bulls struggled to keep the price above the $120,500 level.
Economic Releases
- US Manufacturing PMI for July 2025 (Preliminary) – Forecast 52.5, versus 52.0 previous.
- US Services PMI for July 2025 (Preliminary) – Forecast 53.0, versus 52.9 previous.
- US Initial Jobless Claims - Forecast 227K, versus 221K previous.
RBNZ’s Conway: Tariff fallout to cool NZ inflation
Speaking today, RBNZ Chief Economist Paul Conway said rising global tariffs and economic uncertainty are likely to "reduce medium-term inflation pressures" in New Zealand, and drag on the country’s economic rebound through mid-2026. While the US faces rising costs from tariff-induced supply chain disruptions, Conway said New Zealand is more likely to experience disinflation due to lower global growth and falling import prices.
He highlighted that strong export prices—particularly for dairy and beef—alongside lower domestic interest rates are supporting the economy for now. But widespread uncertainty is causing both consumers and firms to take a wait-and-see approach, which is curbing spending and delaying investment decisions.
Given this backdrop, Conway confirmed that the RBNZ retains a dovish tilt. If inflation continues to ease as expected, there is "scope to lower the OCR further".
Japan’s PMI composite unchanged at 51.5, inflation to ease over the summer
Japan’s Composite PMI was unchanged at 51.5 in July. Services drove growth, rising from 51.7 to 53.5, while Manufacturing slipped into contraction at 48.8, down from 50.1.
S&P Global noted that manufacturers saw weaker output and new orders, weighed down by tariff uncertainty and cautious customer behavior. Confidence weakened across the board, with optimism falling to the second-lowest level since August 2020. Firms responded by slowing hiring to the weakest pace in 18 months.
On the positive side, cost pressures eased, with input inflation at a four-year low—suggesting headline "inflation may ease further over the summer".
Australia PMI composite surges to 53.6, but inflation concerns linger
Australia’s private sector expanded more strongly in July, with the S&P Global Composite PMI rising from 51.6 to 53.6. Services led the way with a sharp rise from 51.8 to 53.8. Manufacturing returned to firmer growth at 51.6, up from 50.6.
S&P Global noted that business activity growth "hastened" at the start of Q3, supported by one of the fastest paces of new manufacturing orders in over two-and-a-half years.
However, the upbeat data came with warning signs. Business confidence slipped to an eight-month low, while manufacturers cut back on purchasing and slowed hiring. More critically, price pressures "intensified" during the month, pointing to renewed upside risks for inflation and "adding to the uncertainty for the interest rate outlook."