Sample Category Title
This Week Kicks Off With Inflation Figures
In focus today
Today's focus turns to inflation figures from Denmark and Norway. We forecast Norway's core inflation to come in at 3.0% y/y (prior: 3.1%), while Denmark's CPI is expected to register at 1.7% y/y (prior: 1.9%).
As summer winds down, this week brings several key data releases. On Tuesday, focus shifts to US July CPI, the Reserve Bank of Australia's rate decision, and the German August ZEW. Thursday brings the Norges Bank meeting, while Friday concludes the week with retail sales figures for the US and China.
Economic and market news
What happened over the weekend
In the US, Fed's Bowman was on the wire reiterating her support for three interest rate cuts in 2025, citing a weakening labour market with rising unemployment and easing inflation risks.
In the Ukraine-Russia war, President Trump announced plans to meet President Putin in Alaska on Friday, 15 August, to discuss a potential peace deal. Late on Saturday, European leaders issued a joint statement emphasising that Ukraine must be included in any negotiations and reaffirmed their opposition to territorial concessions.
In Sweden, production data showed growth, aligning with preliminary GDP data. Manufacturing production bounced markedly by 12.8% y/y, which will likely reverse in coming months. Household consumption increased by 0.6% m/m, in line with expectations and figures for retail sales. However, the outlook remains weak heading into autumn, with risks still tilted to the downside.
In China, July's producer price index dropped by 3.6% y/y (cons: -3.3% y/y), while CPI data came in flat (cons: -0.1%), according to the National Bureau of Statistics. The NBS chief statistician attributed the price declines in certain industries to extreme weather and global trade uncertainties.
Equities: Friday concluded a strong week for equities. US led the gains, with S&P 500 closing 0.8% higher and Stoxx 600 a meagre 0.2%. This summarized to a 2-2.5% advance for the week for most regions, including risk on dynamics: Cyclicals beat defensives by 2p.p. and growth outperformed value. As such, equities have recouped the losses from the non-farm payroll surprise two weeks ago. US gains were concentrated to the Mag 7 names, with small caps underperforming for the fourth week in a row. Small caps have done considerably better in Europe. Following three years of underperformance, small caps have outperformed large caps by 4p.p. so far this year.
European and US markets performed on par last week. Equal weighted S&P 500 was even -0.5% lower, so from a median perspective, European markets did substantially better. From a median stock performance perspective, US and European markets have not diverged much the last month. This flies with the macro input: European momentum is stronger than in the US (visible in Citi's Economic Surprise Index). This has been balanced by a stronger earnings trend in the US (helped by FX). Instead, the big delta in the European and US performance has been sector composition, leaving S&P 500 2.5 p.p. better off during the last month. US big tech preference is partly due to strong earnings but has also been helped by a 15bp drop in yields from the US job revisions.
FI and FX: Global yields drifted higher into Friday's close. In the US, Treasuries ended the week roughly 3bp higher across the curve, with the market holding on to last Friday's post-jobs report rally. In Europe, the German 2Y yield rose 3bp, while the 10Y and 30Y Bund yields gained 5bp, resulting in a mild curve steepening. In FX, GBP was the standout G10 performer last week following the hawkish BoE cut, while safe havens CHF and JPY were the two weakest performers. CHF underperformed as Switzerland has yet to secure a trade deal with the US in the wake of the substantial 39% tariff. JPY weakness was partly driven by diminished prospects for another BoJ hike after real wages declined more than expected. NOK also struggled, weighed down by oil prices hovering near year-to-date lows. EUR/USD has consolidated in the 1.16-1.17 range ahead of tomorrow's US CPI print.
EUR/CHF Daily Outlook
Daily Pivots: (S1) 0.9397; (P) 0.9409; (R1) 0.9423; More....
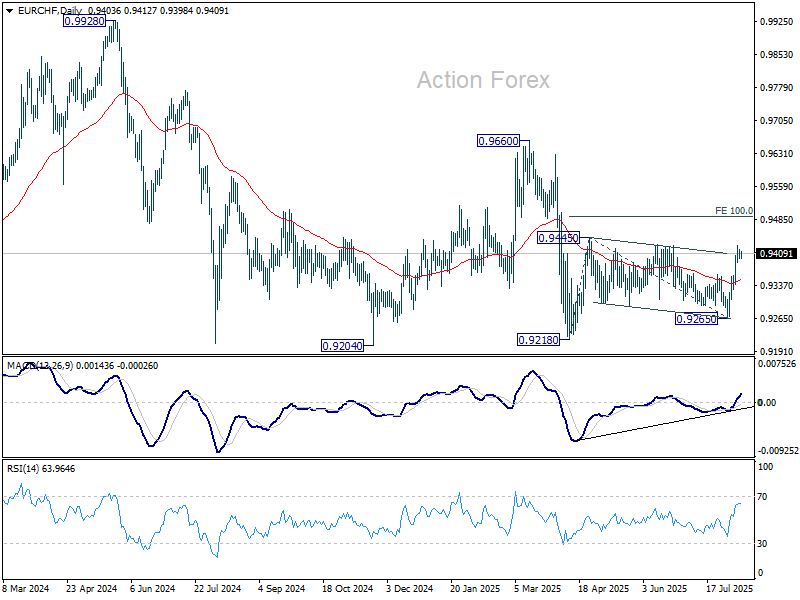
Intraday bias in EUR/CHF remains neutral and more consolidations could be seen below 0.9426 temporary top. As noted before, corrective pattern from 0.9445 should have completed with three waves to 0.9265. Firm break of 0.9428 should confirm this bullish case, and target 0.9445 and then 100% projection of 0.9218 to 0.9445 from 0.9265 at 0.9492. However, sustained trading below 55 4H EMA (now at 0.9362) with extend the corrective pattern with another falling leg.
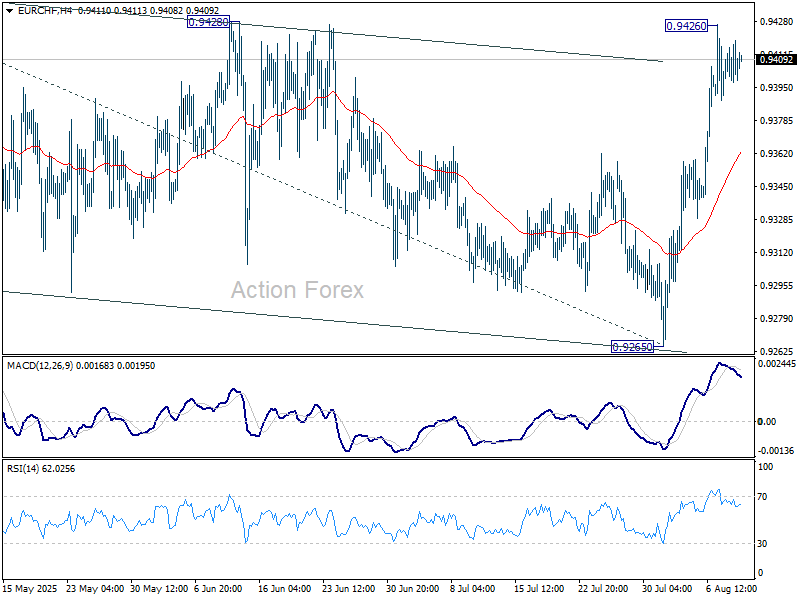
In the bigger picture, the down trend from 0.9204 (2018 high) might still be in progress considering that EUR/CHF is staying well inside the long term falling channel. However, with bullish convergence condition in W MACD, downside position should be limited in case of another fall. Instead, firm break of 0.9660 resistance will be an important sign of medium term bullish trend reversal.
Cautious Start as US-China Trade Deadline Nears; RBA Cut, US CPI Ahead
Markets began the week in tight ranges, with traders reluctant to take big positions. The August 12 deadline for a US–China trade deal is a major headline risk. For now, markets are betting heavily on an extension, with another 90-day truce seen as the most probable outcome.
Still, the threat of escalation lingers. US President Donald Trump has floated the idea of higher tariffs on Chinese goods linked to Beijing’s purchases of Russian oil — mirroring his 25% additional tariffs on India for similar ties. Such measures would raise the stakes in the talks, though most expect them to stay on hold this week.
Diplomacy may play a role in that calculation. A meeting between Trump and Russian President Vladimir Putin is set for Friday in Alaska, where efforts to broker a Russia–Ukraine ceasefire will be in focus. Trump could hold off on targeting China until after gauging the outcome of that meeting.
On the economic front, traders face a packed schedule: an RBA rate cut on Tuesday, US inflation readings, UK GDP, and jobs data. The overlap of geopolitical and macro drivers creates a backdrop where range trading could give way to sharp moves if headlines surprise.
FX performance this month reflects a cautious tone. Dollar sits at the bottom of the leaderboard but remains above last month's lows, followed by Swiss Franc and Loonie. Euro is the top performer, ahead of Yen and Sterling, with Aussie and Kiwi stuck n the middle. Nevertheless, outside of EUR/CHF, all major pairs and crosses are still trapped in last month’s ranges.
In Asia, Japan is on holiday. Hong Kong HSI is up 0.12%. China Shanghai SSE is up 0.45%. Singapore Strait Times is down -0.15%.
Fed's Bowman urges proactive rate cuts, sees three reductions this year
Fed Governor Michelle Bowman signaled strong support for beginning interest rate cuts soon, saying in a speech over the weekend that tariff-driven price increases are a "one-time effect" and should fade without derailing the path back to 2% inflation. She argued that policy should “look through” temporary inflation spikes to avoid damaging the labor market.
She called for a gradual move toward the neutral rate, warning that delaying action risks a sharper deterioration in employment and slower economic growth. Bowman stressed that a "proactive approach" now would help avoid the need for larger policy corrections later if labor conditions worsen.
Bowman’s own Summary of Economic Projections still calls for three rate cuts this year, a view she has held since December. She noted that recent labor market data reinforce this stance, while reiterating that policy is not on a preset path. Bowman was one of two Fed governors to dissent last month against holding rates at 4.25%–4.50%, along with Christopher Waller.
China's CPI flat in July, Core at 17-month high
China’s headline CPI registered 0.0% yoy in July, slipping from June’s 0.1% yoy but avoiding the small -0.1% yoy decline economists had forecast. Core inflation picked up to 0.8% yoy, the highest since February 2023, driven largely by firmer service prices which went up 0.5% yoy. Food prices fell -1.6% yoy.
On a monthly basis, CPI rose 0.4% mom, with the statistics bureau noting visible results from measures to expand domestic demand.
PPI stayed deep in deflation at -3.6% yoy for a second month, extending its contraction streak to 34 months. The NBS attributed the weakness to seasonal factors and global trade uncertainties. On a monthly basis, PPI slipped -0.2% mom.
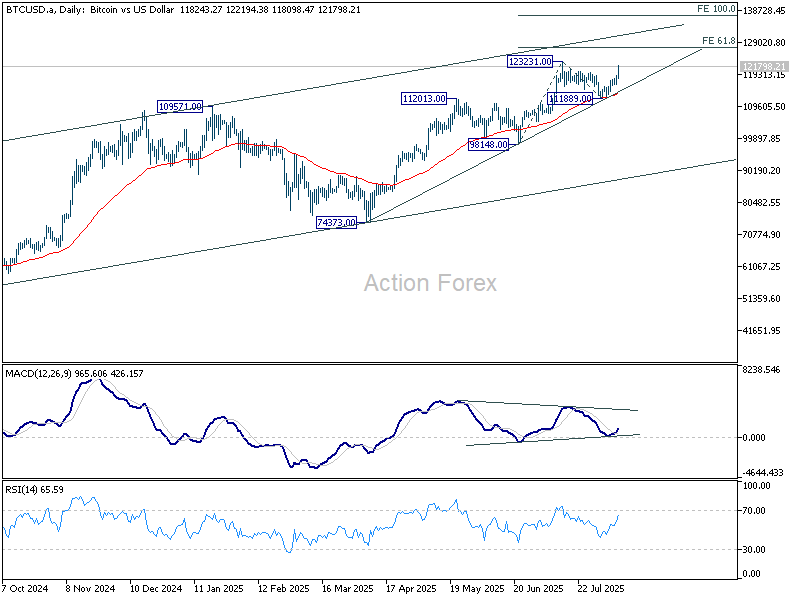
Bitcoin pushes for record high, fifth-wave rally faces 130k cap
Bitcoin surges past 120,000 today and is closing in on new record. Market dynamics points to a powerful short squeeze as a large liquidity pool near current levels is forcing traders with bearish bets to buy back at higher prices, adding fuel to an already rapid climb. Short sellers appear increasingly vulnerable as momentum accelerates.
Behind the rally is a significant policy shift from Washington. Last Thursday, US President Donald Trump signed an executive order permitting cryptocurrencies and other alternative assets in 401(k) retirement accounts. The decision could, in theory, unlock trillions in retirement capital for Bitcoin and other digital assets, bolstering the longer-term demand outlook.
Technically, Bitcoin is on track to break through 123,231 and extend toward the 61.8% projection of 98,418 to 123,231 from 111,889 at 127,390.
However, the current advance from 111,889 could be the fifth wave of the entire rally from 74,373. In Elliott Wave theory, wave three is almost always the strongest and cannot be the shortest of the three upward waves. That places a logical cap on upside below 100% projection at 136,927.
Medium-term channel resistance near 131,580 reinforces this potential ceiling. The 130k zone will be a critical inflection point that could limit the current rally.
RBA to cut again - finally; Heavy weight US and UK data in focus
The RBA is widely expected to trim the cash rate by 25bps to 3.60% on Tuesday, reversing last month’s surprise hold. At the July meeting, policymakers argued for a pause to assess Q2 inflation, which later showed the disinflation trend intact. Meanwhile, the sharp rise in unemployment to 4.3% in June — a three-year high — has erased lingering doubts about the need for fresh easing.
The key question now is how much more easing lies ahead. Reuters polling indicates a strong consensus for a second 25bps cut in November, taking the cash rate to 3.35% by year-end. Australia’s big four banks offer a range of forecasts. CBA and ANZ expect two cuts — August and November — to 3.35%. NAB projects three cuts extending to February, to 3.10%. Westpac foresees four by May, to 2.85%. This divergence reflects different views on how quickly unemployment will rise and how persistent inflation risks will remain.
Thursday’s July Australian employment data will be closely watched. Consensus looks for a 25.3k rise in jobs and unemployment steady at 4.3%. Any deeper labor market deterioration could shift market sentiment toward more aggressive easing expectations, though the RBA is unlikely to accelerate beyond its “measured” approach without several months of soft data.
Globally, a heavy US data calendar will dominate mid-week, with CPI, PPI, retail sales, and the University of Michigan sentiment survey. For the Fed, expectations are locked in for two 25bps cuts this year — in September and December — in line with the June dot plot. Barring a major upside surprise in this week’s CPI, there is little to stop the Fed from delivering in September.
That said, there will be one more CPI and nonfarm payrolls report before the September FOMC meeting. Those readings will capture the early economic effects of the August tariff escalation, making them pivotal in shaping the Fed’s updated projections and its rate path into 2026. For now, speculation beyond a September cut risks running ahead of the data.
In the UK, the BoE’s latest 5–4 vote to cut to 4.00% underlined the depth of division on the MPC. The interplay between growth resilience and inflation persistence will continue to dominate the BoE debate. A stronger June UK GDP and firm labor market data this week could reinforce the case for maintaining the existing pace, even as doves argue for faster cuts to counter stagnation.
Other events to watch this week include , Germany ZEW, Japan GDP, BoC's summary of deliberation, and a batch growth data from China.
Here are some highlights for the week:
- Tuesday: Australia NAB business confidence, RBA rate decision; UK employment; Germany ZEW economic sentiment; US CPI.
- Wednesday: Japan PPI; Australia wage price index; Germany CPI final; BoC summary of deliberations.
- Thursday: Australia employment; UK GDP; Swiss PPI; Eurozone GDP revision, industrial production; US PPI, jobless claims.
- Friday: New Zealand BNZ manufacturing; Japan GDP; China industrial production, retail sales, fixed asset investment; Canada manufacturing and wholesale sales; US retail sales, Empire state manufacturing, import prices, industrial production, UoM consumer sentiment.
EUR/CHF Daily Outlook
Daily Pivots: (S1) 0.9397; (P) 0.9409; (R1) 0.9423; More....
Intraday bias in EUR/CHF remains neutral and more consolidations could be seen below 0.9426 temporary top. As noted before, corrective pattern from 0.9445 should have completed with three waves to 0.9265. Firm break of 0.9428 should confirm this bullish case, and target 0.9445 and then 100% projection of 0.9218 to 0.9445 from 0.9265 at 0.9492. However, sustained trading below 55 4H EMA (now at 0.9362) with extend the corrective pattern with another falling leg.
In the bigger picture, the down trend from 0.9204 (2018 high) might still be in progress considering that EUR/CHF is staying well inside the long term falling channel. However, with bullish convergence condition in W MACD, downside position should be limited in case of another fall. Instead, firm break of 0.9660 resistance will be an important sign of medium term bullish trend reversal.
EUR/USD Aims Breakout But Can The Bulls Deliver?
Key Highlights
- EUR/USD started a fresh increase from the 1.1400 zone.
- A major bearish trend line is forming with resistance at 1.1680 on the 4-hour chart.
- GBP/USD recovered losses and climbed above 1.3400.
- Gold is attempting a fresh increase above the $3,375 resistance.
EUR/USD Technical Analysis
The Euro found support near 1.1400 and recovered against the US Dollar. EUR/USD climbed above the 1.1450 and 1.1550 resistance levels.
Looking at the 4-hour chart, the pair cleared the 61.8% Fib retracement level of the downward move from the 1.1788 swing high to the 1.1391 low. There was a close above the 100 simple moving average (red, 4-hour) and the pair tested the 200 simple moving average (green, 4-hour).
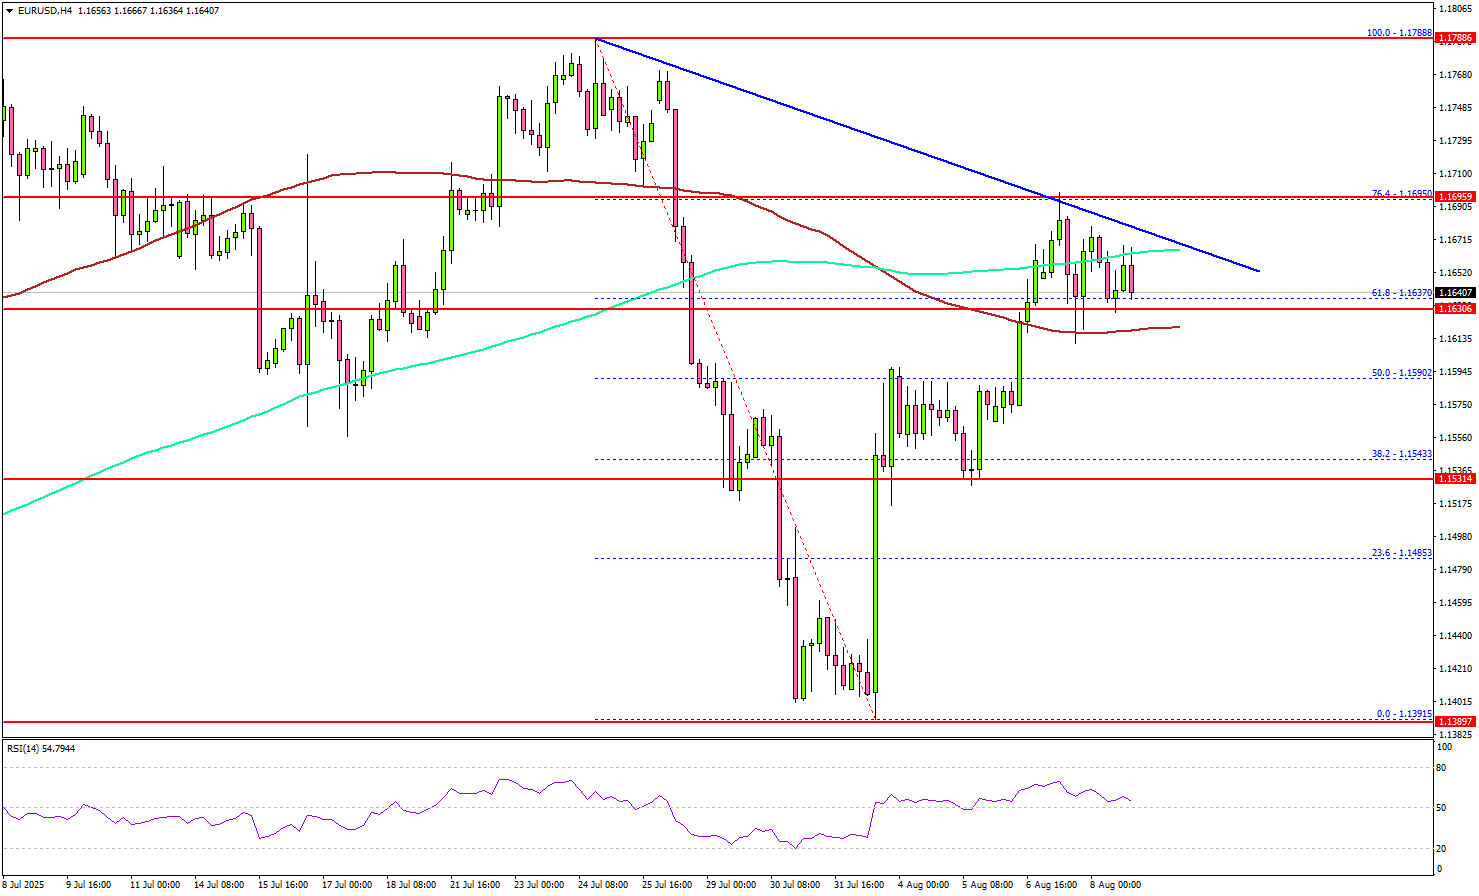
On the upside, the pair now faces resistance near the 1.1680 level and the 200 simple moving average (green, 4-hour). There is also a major bearish trend line forming with resistance at 1.1680 on the same chart.
The next key resistance sits near the 1.1720 level. A close above the 1.1720 level could set the pace for another increase. In the stated case, the pair could rise toward the 1.1750 resistance, above which the bulls could aim for a move toward 1.1840.
On the downside, immediate support is near the 1.1600 level. The next key support sits near 1.1580. Any more losses could send the pair toward the 1.1550 support zone.
Looking at GBP/USD, the pair started a recovery wave, and the bulls might soon aim for a move toward the 1.3550 level.
Upcoming Key Economic Events:
- US 3-Month Bill Auction.
- US 6-Month Bill Auction.
Bitcoin pushes for record high, fifth-wave rally faces 130k cap
Bitcoin surges past 120,000 today and is closing in on new record. Market dynamics points to a powerful short squeeze as a large liquidity pool near current levels is forcing traders with bearish bets to buy back at higher prices, adding fuel to an already rapid climb. Short sellers appear increasingly vulnerable as momentum accelerates.
Behind the rally is a significant policy shift from Washington. Last Thursday, US President Donald Trump signed an executive order permitting cryptocurrencies and other alternative assets in 401(k) retirement accounts. The decision could, in theory, unlock trillions in retirement capital for Bitcoin and other digital assets, bolstering the longer-term demand outlook.
Technically, Bitcoin is on track to break through 123,231 and extend toward the 61.8% projection of 98,418 to 123,231 from 111,889 at 127,390.
However, the current advance from 111,889 could be the fifth wave of the entire rally from 74,373. In Elliott Wave theory, wave three is almost always the strongest and cannot be the shortest of the three upward waves. That places a logical cap on upside below 100% projection at 136,927.
Medium-term channel resistance near 131,580 reinforces this potential ceiling. The 130k zone will be a critical inflection point that could limit the current rally.
China’s CPI flat in July, Core at 17-month high
China’s headline CPI registered 0.0% yoy in July, slipping from June’s 0.1% yoy but avoiding the small -0.1% yoy decline economists had forecast. Core inflation picked up to 0.8% yoy, the highest since February 2023, driven largely by firmer service prices which went up 0.5% yoy. Food prices fell -1.6% yoy.
On a monthly basis, CPI rose 0.4% mom, with the statistics bureau noting visible results from measures to expand domestic demand.
PPI stayed deep in deflation at -3.6% yoy for a second month, extending its contraction streak to 34 months. The NBS attributed the weakness to seasonal factors and global trade uncertainties. On a monthly basis, PPI slipped -0.2% mom.
Fed’s Bowman urges proactive rate cuts, sees three reductions this year
Fed Governor Michelle Bowman signaled strong support for beginning interest rate cuts soon, saying in a speech over the weekend that tariff-driven price increases are a "one-time effect" and should fade without derailing the path back to 2% inflation. She argued that policy should “look through” temporary inflation spikes to avoid damaging the labor market.
She called for a gradual move toward the neutral rate, warning that delaying action risks a sharper deterioration in employment and slower economic growth. Bowman stressed that a "proactive approach" now would help avoid the need for larger policy corrections later if labor conditions worsen.
Bowman’s own Summary of Economic Projections still calls for three rate cuts this year, a view she has held since December. She noted that recent labor market data reinforce this stance, while reiterating that policy is not on a preset path. Bowman was one of two Fed governors to dissent last month against holding rates at 4.25%–4.50%, along with Christopher Waller.
Markets Await Breakout with Tariffs and Fed Chair Decision in Spotlight
The market continued to analyze the previous week’s poor U.S. employment data, which boosted expectations for a Fed rate cut in September. Focus then turned to tariff negotiations as President Trump announced new duties on multiple countries, including Switzerland and Brazil. Switzerland’s gold exports to the U.S. will now face a 39% tariff, driving safe-haven demand and pushing gold higher. Trump’s team is also searching for the next Fed Chair, with speculation that the choice will favor lower interest rates. U.S. PMI data beat expectations, providing support for the dollar.
In the UK, the Bank of England cut interest rates by 0.25% as anticipated, but the decision was closer than expected, with several policymakers opposing the move. This surprise dissent helped the pound strengthen despite the cut. Meanwhile, U.S. equities staged a strong recovery, led by gains in technology stocks on optimism surrounding artificial intelligence.
The U.S. dollar tested lower, continuing the weakness from the U.S. employment data, but found support late in the week and closed near its highs. Gold extended gains on the Swiss tariff news, while risk sentiment improved as investors balanced ongoing trade tensions with positive U.S. earnings reports.
Markets This Week
U.S. Stocks
U.S. equities recovered last week, reversing the losses from the weak employment data as better-than-expected earnings eased fears over new tariffs. Many companies producing in the U.S. were exempted from the harshest measures, while expectations for potential Federal Reserve interest rate cuts also supported sentiment. The rebound is encouraging, but the Dow continues to lag behind the S&P 500 and Nasdaq, with the 10-day moving average still pointing lower. Sideways movement in the Dow is likely to continue in the near term. Resistance levels are at 44,000, 44,500, and 45,000, while support lies at 44,000, 43,000, 42,000, and 41,750.
Japanese Stocks
The Nikkei 225 surged over 4% last week, returning close to historical highs as optimism grew that trade with the U.S. will be more favorable for the Japanese economy than initially expected. Strong earnings, particularly from SoftBank, also helped lift the index. The strength of the rally surprised the market and is positive for the medium-term outlook. However, in the short term the market appears overbought and remains below key resistance at historical highs, making it preferable to wait for a pullback before buying. Resistance is seen at 42,474円 and 43,000円, while support lies at 41,500円, 41,000円, and 40,000円.
USD/JPY
USD/JPY spent the week trading sideways as the shock of the poor U.S. employment data kept volatility low. The market is now focused on signals of when Japan might raise interest rates and when the U.S. could start lowering rates. Support held last week, with the 10-day moving average pointing sideways. Range trading remains the preferred strategy this week, with U.S. inflation data in focus. Resistance is at 148, 149, and 150, while support is at 147, 146, and 145.
Gold
It was a strong week for gold prices as expectations of lower U.S. interest rates and ongoing tariff tensions encouraged buying. The latest gains were driven largely by the U.S. decision to impose steep tariffs—up to 39%—on certain Swiss gold bars, pushing U.S. gold futures to record highs. Gold remains within the wide $3,250 to $3,450 range but shows signs of breaking resistance in the coming sessions, making buying on dips the preferred strategy. Resistance is at $3,450, while support is at $3,350, $3,300, and $3,250.
Crude Oil
WTI crude closed below the key $65 support last week, falling every day on concerns over weaker global demand from new U.S. tariffs, ongoing geopolitical uncertainties, and fears of oversupply following OPEC+ output increases. Hopes for a potential diplomatic resolution between the U.S. and Russia over the Ukraine conflict also encouraged selling. With the market now below $65, a test of $60 and potentially lower is expected. Conditions are slightly oversold, so selling into strength remains the preferred strategy. Resistance is seen at $65, $70, and $75, while support is at $60 and $55.
Bitcoin
Bitcoin rose over the week as buying support emerged near the previous record highs around $112,000, helped by improved risk sentiment. While new tariffs are seen as a negative for Bitcoin, the 10-day moving average is pointing sideways, suggesting limited upside in the short term. However, the medium-term outlook remains positive, making buying on weakness the preferred strategy. Resistance is at $120,000, $125,000, and $150,000, with support at $112,000, $110,000, and $105,000.
This Week’s Focus
- Tuesday: Australia RBA Interest Rate Decision, U.K. Unemployment Rate, E.U. ZEW Economic Sentiment, U.S. CPI
- Thursday: Australian Unemployment Rate, U.K. GDP, E.U. GDP, U.S. PPI, U.S. Jobless Claims
- Friday: Japan GDP, Japan Industrial Production, U.S. Retail Sales, U.S. Industrial Production, U.S. Michigan Consumer Sentiment
This week, traders will be watching important U.S. economic data, with both inflation and retail sales reports expected to have a big impact on market direction. Another key focus is the U.S.–China trade situation, as the two countries have not yet agreed to extend their 90-day tariff truce, which is due to expire on August 12. This deadline, and any new trade headlines, could quickly change market sentiment and drive sharp moves.
Markets are also paying close attention to discussions over the next U.S. Federal Reserve Chair, as President Trump looks to influence the Fed’s approach to interest rates. With prices stuck in a range last week, the mix of key data releases, trade deadlines, and political developments means this could be an active week with plenty of short-term trading opportunities as the market searches for a breakout.
Ethereum Wave Analysis
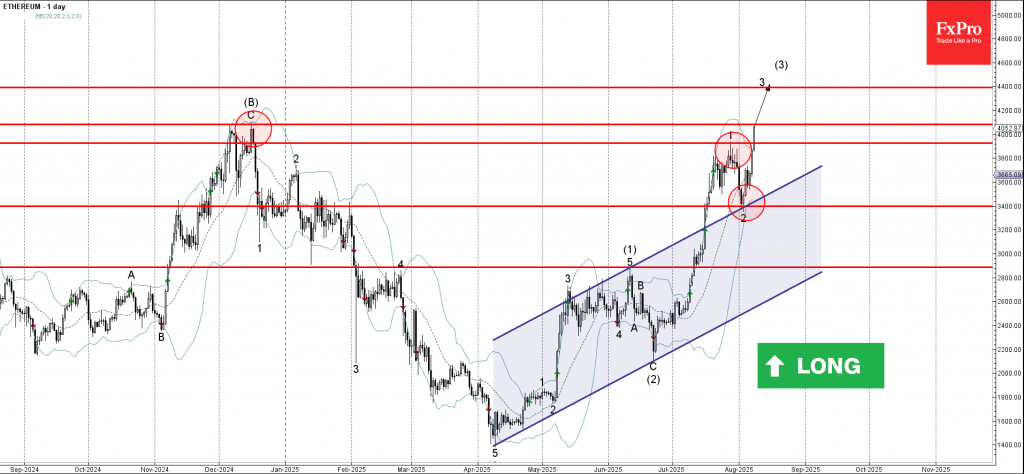
Ethereum: ⬆️ Buy
- Ethereum broke the resistance level 3925.00
- Likely to rise to resistance level 4108.00
Ethereum cryptocurrency recently broke the resistance level 3925.00 (which stopped the previous impulse wave 1 at the end of July).
The breakout of the resistance level 3925.00 continues the active impulse wave 3, which started earlier from the support zone lying at the intersection of the support level 3400.00 and the upper trendline of the daily up channel from April.
Given the clear daily uptrend, Ethereum cryptocurrency can be expected to rise to the next resistance level 4108.00 (multi-month high from December) – the breakout of which can lead to further gains toward 4400.00.