Sample Category Title
Germany DAX Technical: Potential Recovery in Progress After 5% Sell-Off
The price actions of the Germany 30 CFD Index (a proxy of the DAX futures) have staged a corrective decline of 5% from its current all-time high of 24,655 on 10 July 2025 to 1 August 2025 intraday low of 23,385.
Several key technical elements are now advocating for a potential recovery to kickstart a new impulsive up move sequence within its major uptrend phase.
Let’s now examine the Germany 30 CFD Index from a technical analysis perspective and construct a short-term (multi-day) trading set-up.
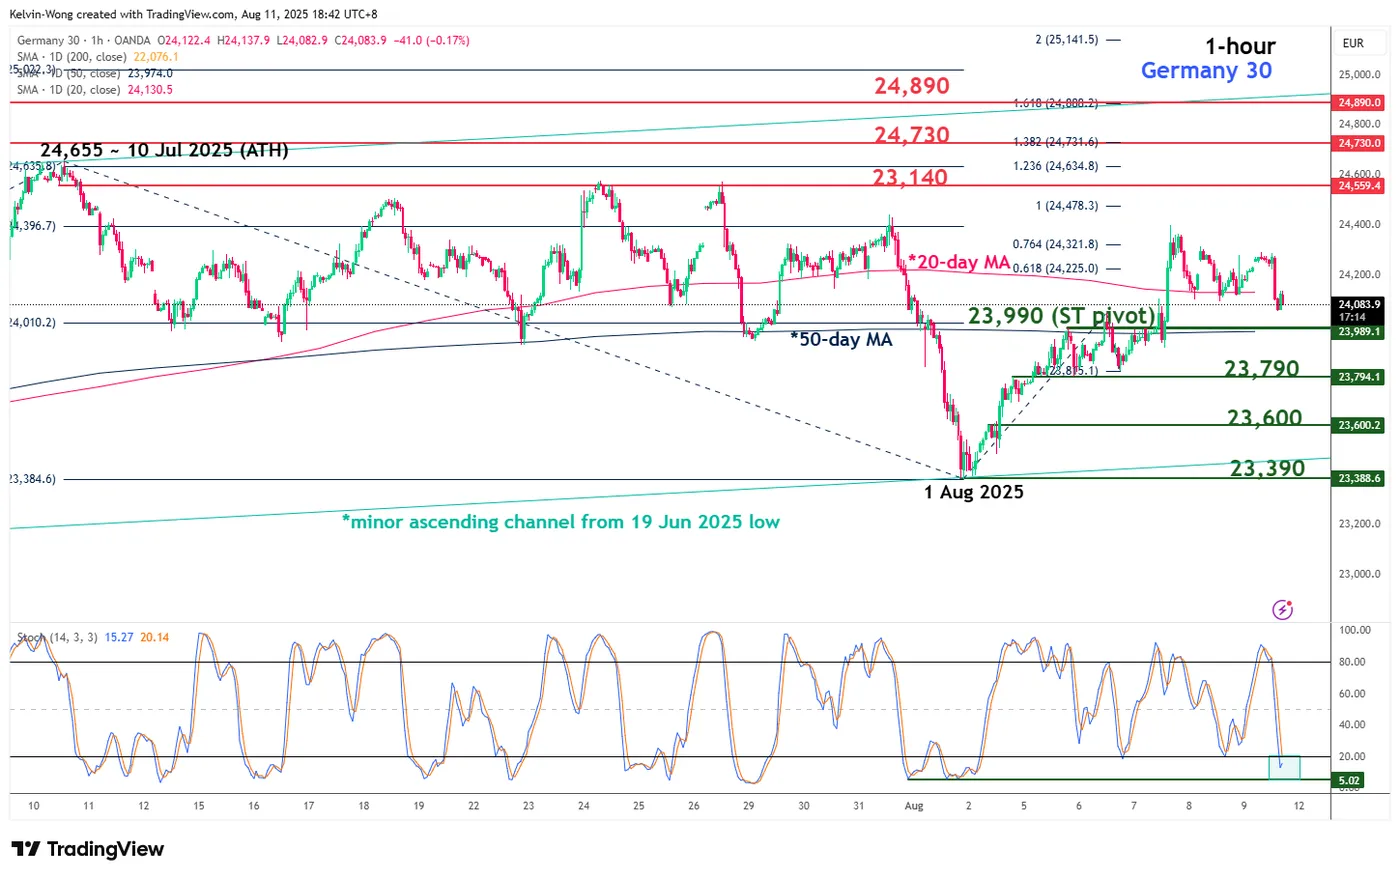
Fig.1: Germany 30 CFD Index short-term trend as of 11 Aug 2025 (Source: TradingView)
Percentage of STOXX 600 component stocks above 50-day moving average
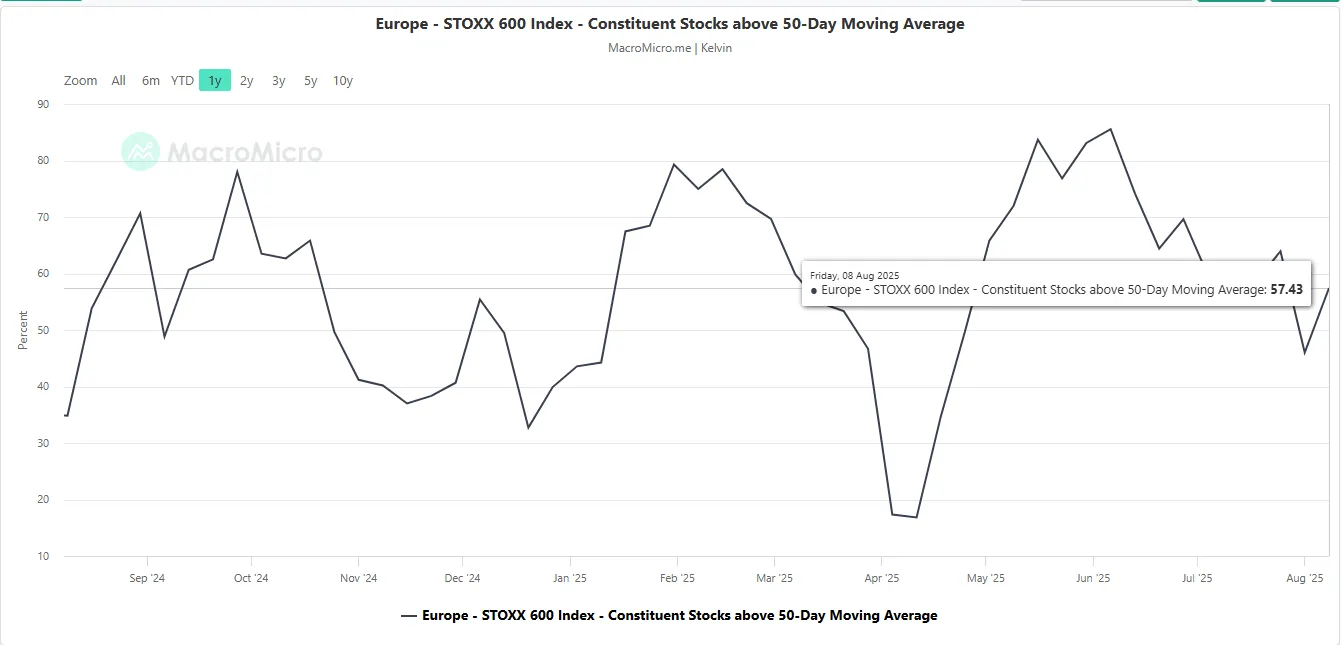
Fig. 2: Percentage of STOXX 600 component stocks above 200-day MA as of 8 Aug 2025 (Source: MacroMicro)
Preferred trend bias (1-3 days)
Bullish bias with 23,990 as key short-term bullish bias with next resistances at 23,140 (minor swing highs of 24/28 July 2025), 24,730 (Fibonacci extension), and 24,890 (Fibonacci extension and upper boundary of minor ascending channel from 19 June 2025 low).
Key elements
- The price actions of the Germany 30 CFD Index have reintegrated back above the 20-day and 50-day moving averages, which suggests the potential end of the recent minor corrective decline from the 10 July 2025 high to the 1 August 2025 low.
- The hourly Stochastic oscillator has dipped back into its oversold region (below 20).
- Market breadth condition in the broader European benchmark STOXX 600 has improved as the percentage of STOXX 600 component stocks trading above their respective 50-day moving averages has jumped to 57.4% as of last Friday, 8 August, from 46% on 1 August (see Fig. 2).
Alternative Trend Bias (1 to 3 days)
On the other hand, failure to hold at the 23,990 key support negates the bullish tone for another round of slide to retest the next intermediate supports at 23,790 and 23,600.
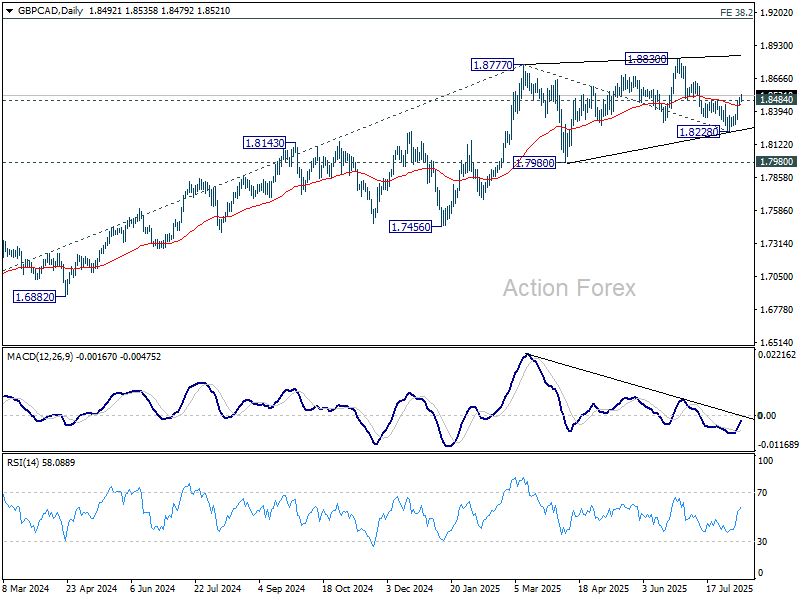
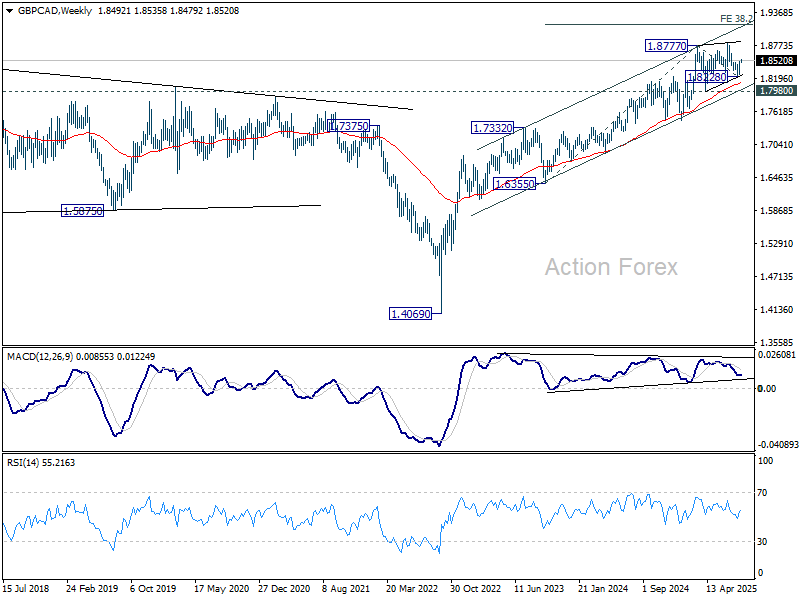
GBP/CAD rising towards 1.8830 as UK jobs and GDP awaited
GBP/CAD built on last week’s strong rebound as trading opened this week, with technical signals pointing to a retest of the recent high at 1.8830 as next step. The near-term direction will hinge partly on UK data, with employment figures due Tuesday and June GDP on Thursday.
Last week’s narrow 5–4 BoE vote to cut the Bank Rate to 4.00% highlighted the divide within the MPC, and the interplay between economic resilience and sticky inflation will remain the key driver.
Market consensus still favors a gradual “one cut per quarter” easing path from the BoE. A solid GDP print combined with firm labor market data — especially upside surprises in wage growth — could strengthen the hawkish camp’s argument to keep the pace steady, if not slower.
Technically, GBP/CAD’s break of 1.8484 resistance confirms that the fall from 1.8830 bottomed at 1.8228. The corrective pattern from 1.8777 also appears to have completed a three-wave correction at that low. Further rise should be seen to retest 1.8830 next. Firm break there will resume larger up trend to 38.2% projection of 1.6355 to 1.1877 from 1.8228 at 1.9153.
EURUSD Bullish Turn: Analyzing the Blue Box Area Reaction
In this technical blog, we will look at the past performance of the 4-hour Elliott Wave Charts of EURUSD. In which, the rally from Sep 2022 low is unfolding as impulse sequence & showed a higher high sequence therefore, called for an extension higher to take place. We knew that the structure in EURUSD should remain supported & extend higher. So, we advised members not to sell the pair & buy the dips in 3, 7, or 11 swings at the blue box areas. We will explain the structure & forecast below:
EURUSD 4-Hour Elliott Wave Chart From 7.30.2025
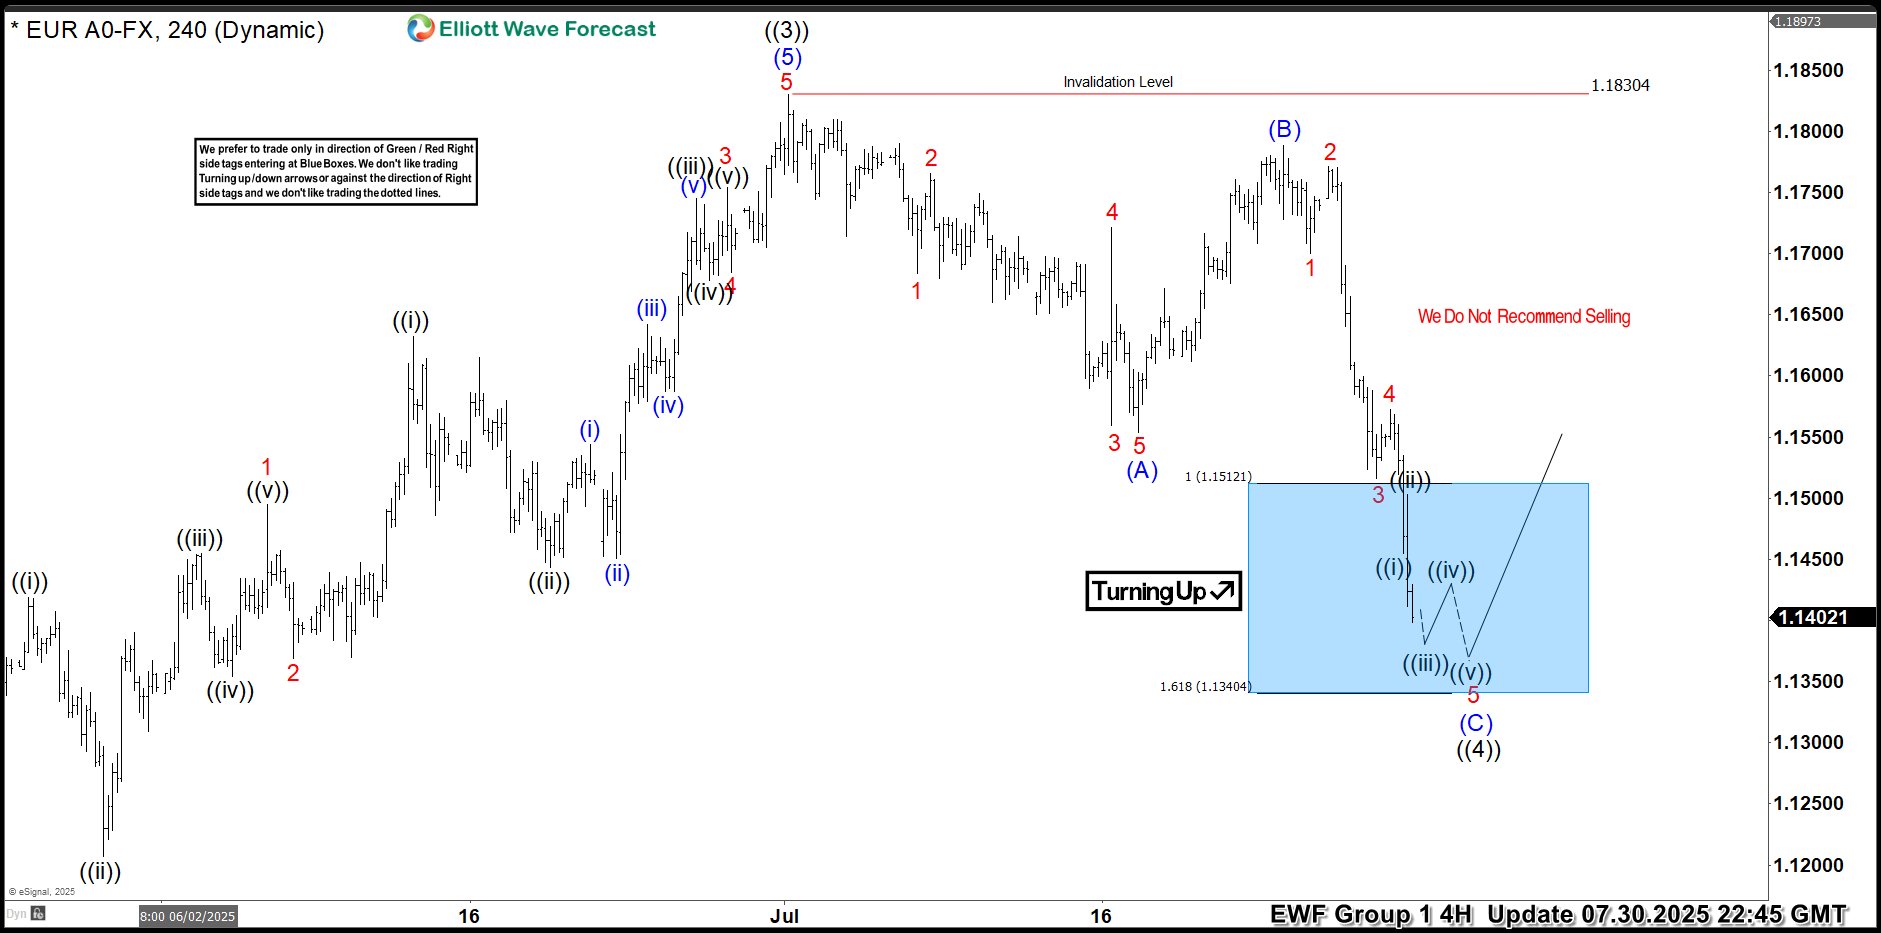
Here’s the 4-hour Elliott wave Chart from the 7.30.2025 update. In which, the rally to $1.1830 high completed wave ((3)) & made a pullback in wave ((4)). The internals of that pullback unfolded as Elliott wave zigzag correction where wave (A) ended at $1.1554 low. Then a rally to $1.1788 high-ended wave (B) bounce. Then started the next leg lower in wave (C) towards $1.1512- $1.1340 blue box area. From there, buyers were expected to appear looking for new highs ideally or for a 3-wave bounce minimum.
EURUSD Latest 4-Hour Elliott Wave Chart From 8.09.2025
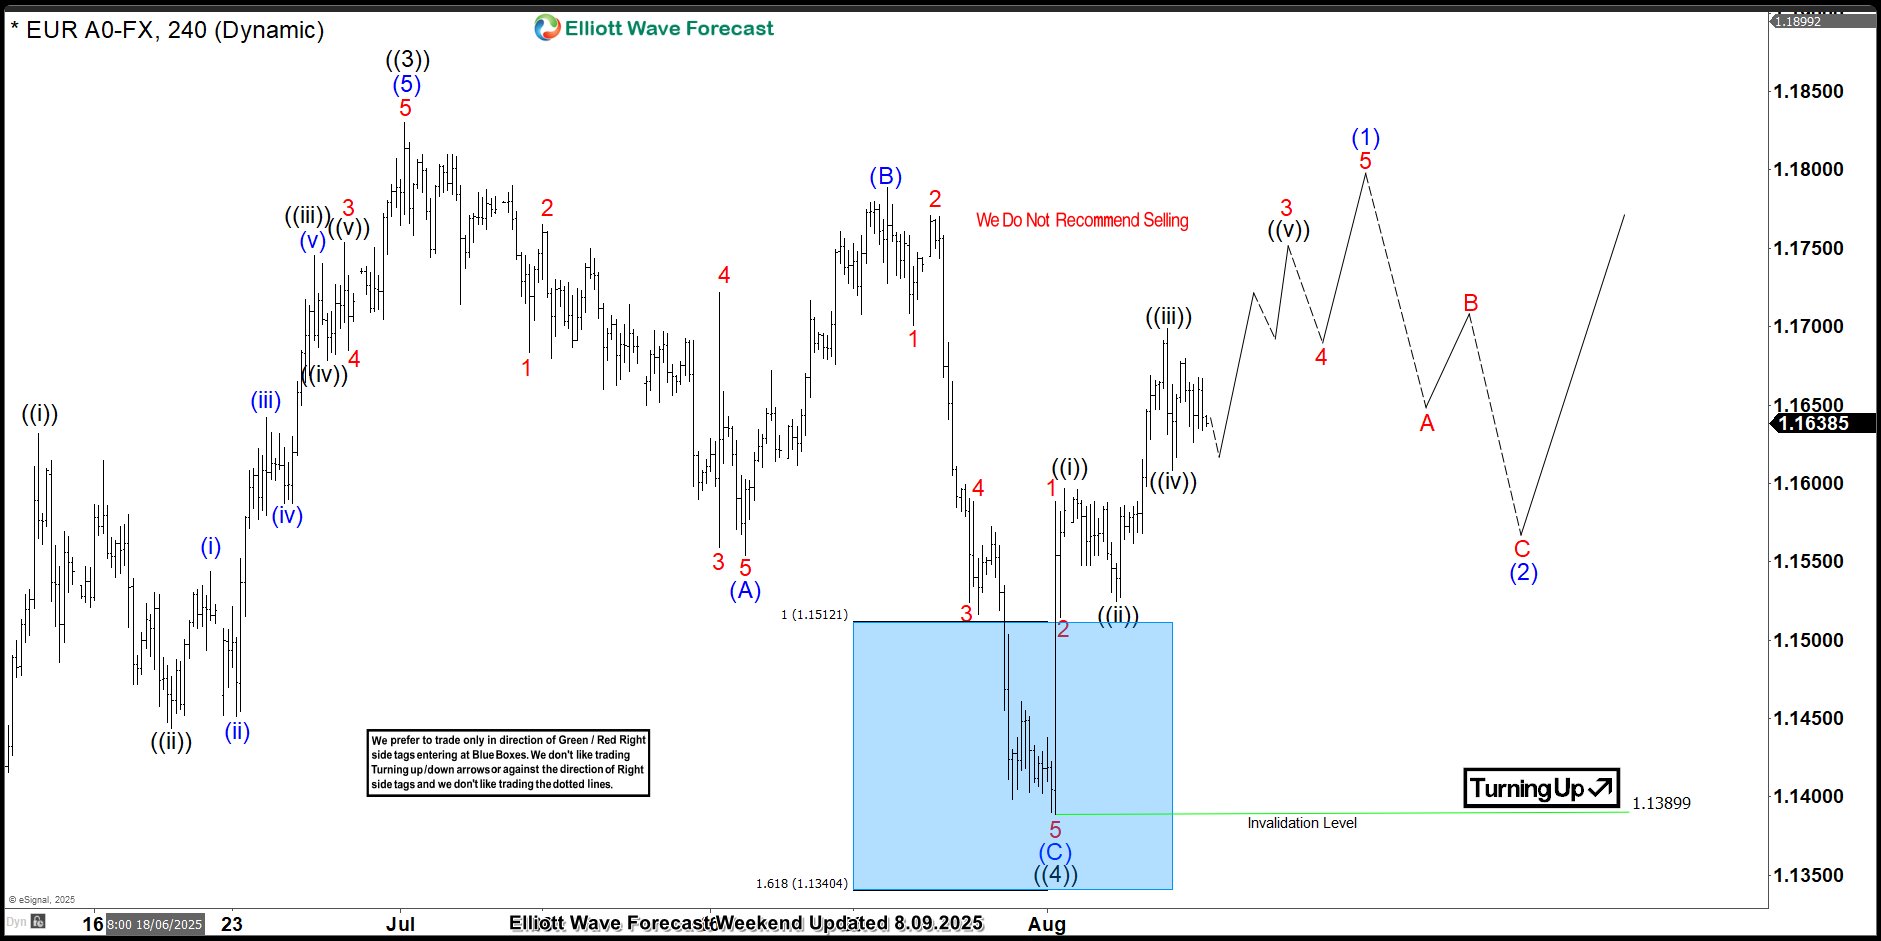
This is the latest 4-hour Elliott wave Chart from the 8.09.2025 Weekend update. In which the pair is showing a strong reaction higher taking place, right after ending the correction within the blue box area. Allowed members to create a risk-free position shortly after taking the long position at the blue box area. However, a break above $1.1830 high is needed to confirm the next extension higher & avoid double correction lower.
RBA Poised to Lower Rates, Australian Dollar in Holding Pattern
The Australian dollar is coming off a strong week, gaining almost 1% against the US dollar. In Monday's European session, AUD/USD is almost unchanged at 0.6521.
RBA widely expected to cut rates
The Reserve Bank of Australia is virtually certain to lower rates at Tuesday's meeting. This would be the third cut of 2025 and would lower the cash rate to 3.60%, its lowest level since April 2023. This indicates a gradual, cautious approach to lowering rates.
The RBA had a trick up its sleeve in July, when it opted to hold rates. The markets had widely expected a rate cut but the RBA said that it wanted to see additional inflation data before delivering a rate cut.
Inflation has been cooling, as CPI for the second quarter nudged down to 2.1% y/y, down from 2.4% in Q1. This strongly supports the case for a rate cut as CPI has fallen close to the lower band of the RBA's 2%-3% target. Core inflation has also been easing lower. As well, the labor market is showing signs of cooling and the central bank wants to avoid a sharp deterioration in employment data.
With today's move practically a given, investors will be looking for hints about further cuts. Governor Bullock has sounded cautious, noting that inflation remains sticky and there is continuing uncertainty over US tariffs.
Australian goods face a low 10% US tariff, which is not expected to have a significant impact on the economy. However, US tariffs on China, which is Australia's largest trading partner, could weigh on economic growth.
In the US, it's a very light calendar with no tier-1 events. On Tuesday, the US releases CPI for July, which is expected to tick up to 2.8% from 2.7% in June.
AUD/USD Technical
- AUD/USD is testing support at 0.6414. Below, there is support at 0.6506
- There is resistance at 0.6529 and 0.6536
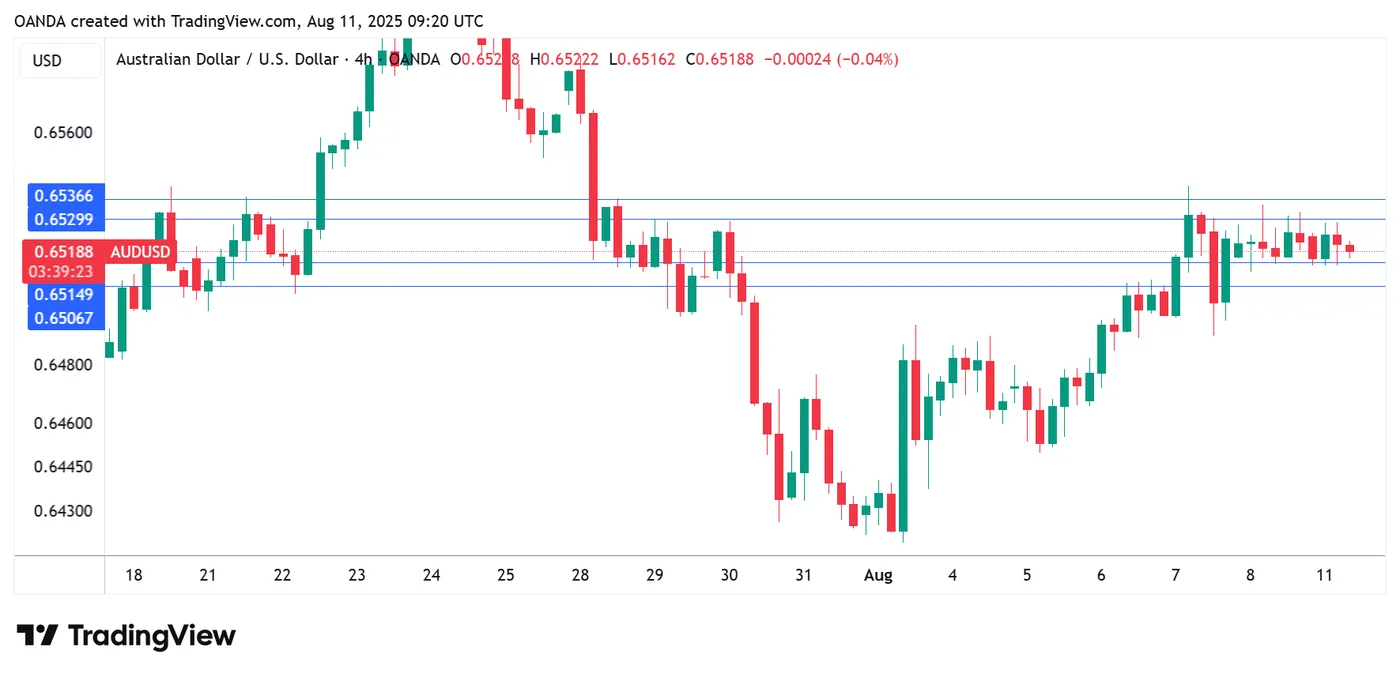
AUD/USD 4-Hour Chart, Aug. 11, 2025
AUD/USD Technical: Further Potential Aussie Strength Towards Range Resistance as RBA Looms
After Australia’s central bank (RBA) shocked market participants with its prior monetary policy decision in July to stand pat on its short-term cash interest rate at 3.85% in defiance of overwhelming expectations of a rate cut, the consensus forecast now is a 25 basis points cut to lower the cash interest rate to 3.6% on Tuesday meeting, 12 August as inflation pressures subsided.
Q2’s trimmed mean gauge of inflation in Australia cooled to 2.7% from 2.9% in Q1, inching down closer to the midpoint of RBA’s 2%-3% inflation target. Even the monthly CPI rose by 1.9% y/y in June, easing from May’s print of 2.1%.
Hence, RBA’s third interest rate this year, which is set for Tuesday’s monetary policy meeting, is likely to have been fully priced in.
Let’s decipher the short-term movements of the AUD/USD from a technical analysis perspective.
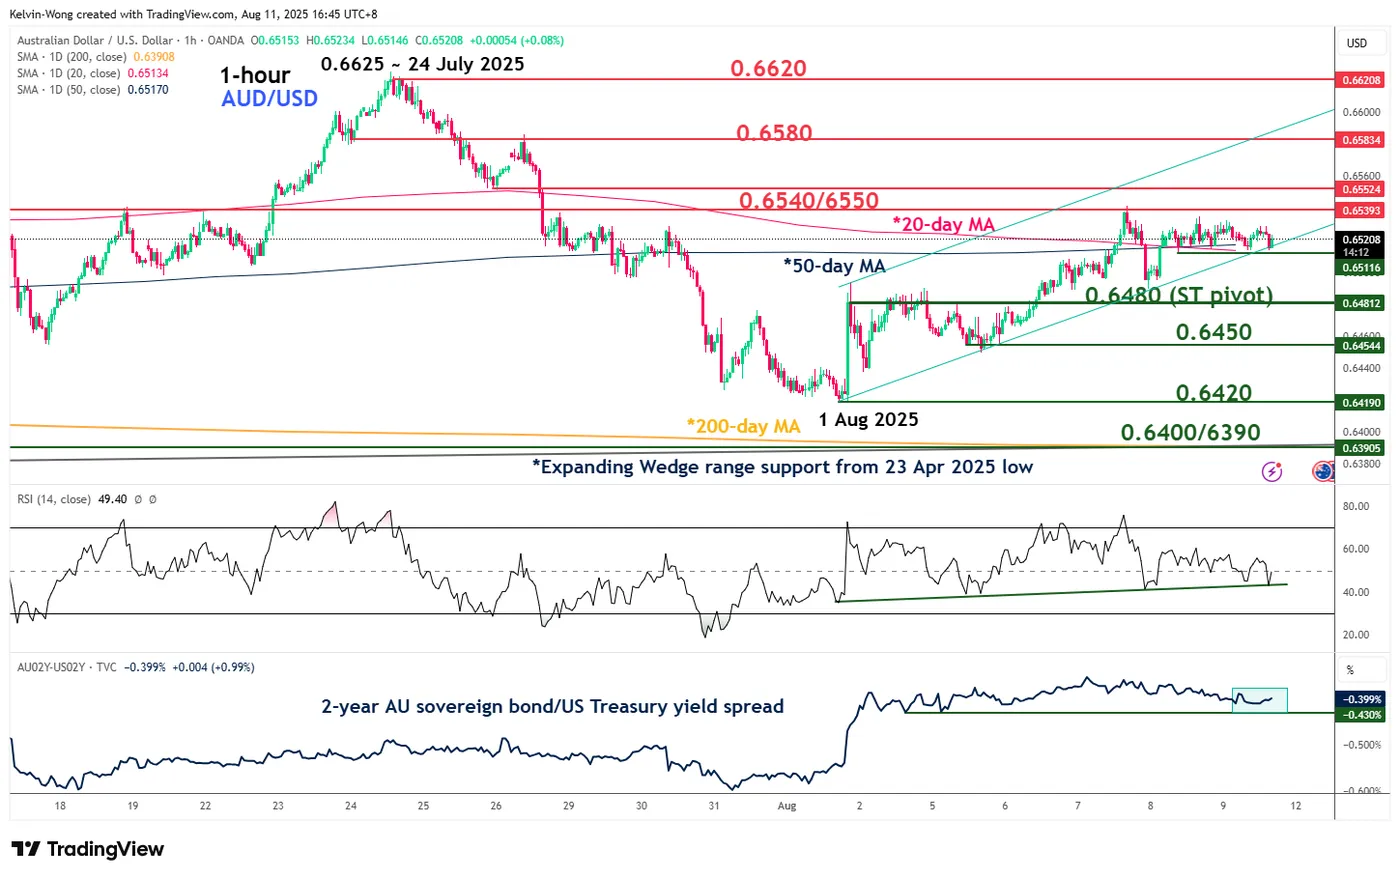
Fig. 1: AUD/USD minor trend as of 11 Aug 2025 (Source: TradingView)
Preferred trend bias (1-3 days)
The recent 205-pip minor corrective decline seen in the AUD/USD from the 24 July 2025 high to the 1 August 2025 low stalled right above its key 200-day moving average, and the lower boundary of a medium-term “Expanding Wedge” range configuration in place since the 23 April 2025 low.
Bullish bias with 0.6480 as key short-term pivotal support for the next intermediate resistances to come in at 0.6540/6550 and 0.6580 (also the upper boundary of the minor ascending channel).
Key elements
- The AUD/USD has been evolving within a minor ascending channel in place since the 1 August 2025 low of 0.6420, which suggests an ongoing minor uptrend phase. Also, price actions have managed to hold above the 20-day moving average since last Friday, 8 August 2025.
- The hourly RSI momentum indicator has managed to stage a bounce at a parallel ascending support at the 43 level.
- The discount yield spread between the 2-year Australian sovereign bond and US Treasury note has continued to narrow since 1 August 2025, from -0.55% to -0.44% which may in turn support further potential upside in AUD/USD as the 2-year Treasury note is getting less attractive to own in terms of yield differential.
Alternative trend bias (1 to 3 days)
A break below 0.6480 invalidates the bullish tone to open up scope for another round of choppy corrective decline to expose the next intermediate supports at 0.6450, and 0.6420.
AUD/USD & NZD/USD Much Higher—Uptrend Shows Strength
AUD/USD started a decent increase above the 0.6480 and 0.6500 levels. NZD/USD is also rising and might aim for more gains above 0.5970.
Important Takeaways for AUD/USD and NZD/USD Analysis Today
- The Aussie Dollar started a decent increase above the 0.6450 level against the US Dollar.
- There is a connecting bearish trend line forming with resistance at 0.6530 on the hourly chart of AUD/USD at FXOpen.
- NZD/USD is consolidating gains above the 0.5940 zone.
- There is a short-term declining channel forming with resistance at 0.5960 on the hourly chart of NZD/USD at FXOpen.
AUD/USD Technical Analysis
On the hourly chart of AUD/USD on FXOpen, the pair started a fresh increase from the 0.6450 support. The Aussie Dollar was able to clear the 0.6470 resistance to move into a positive zone against the US Dollar.
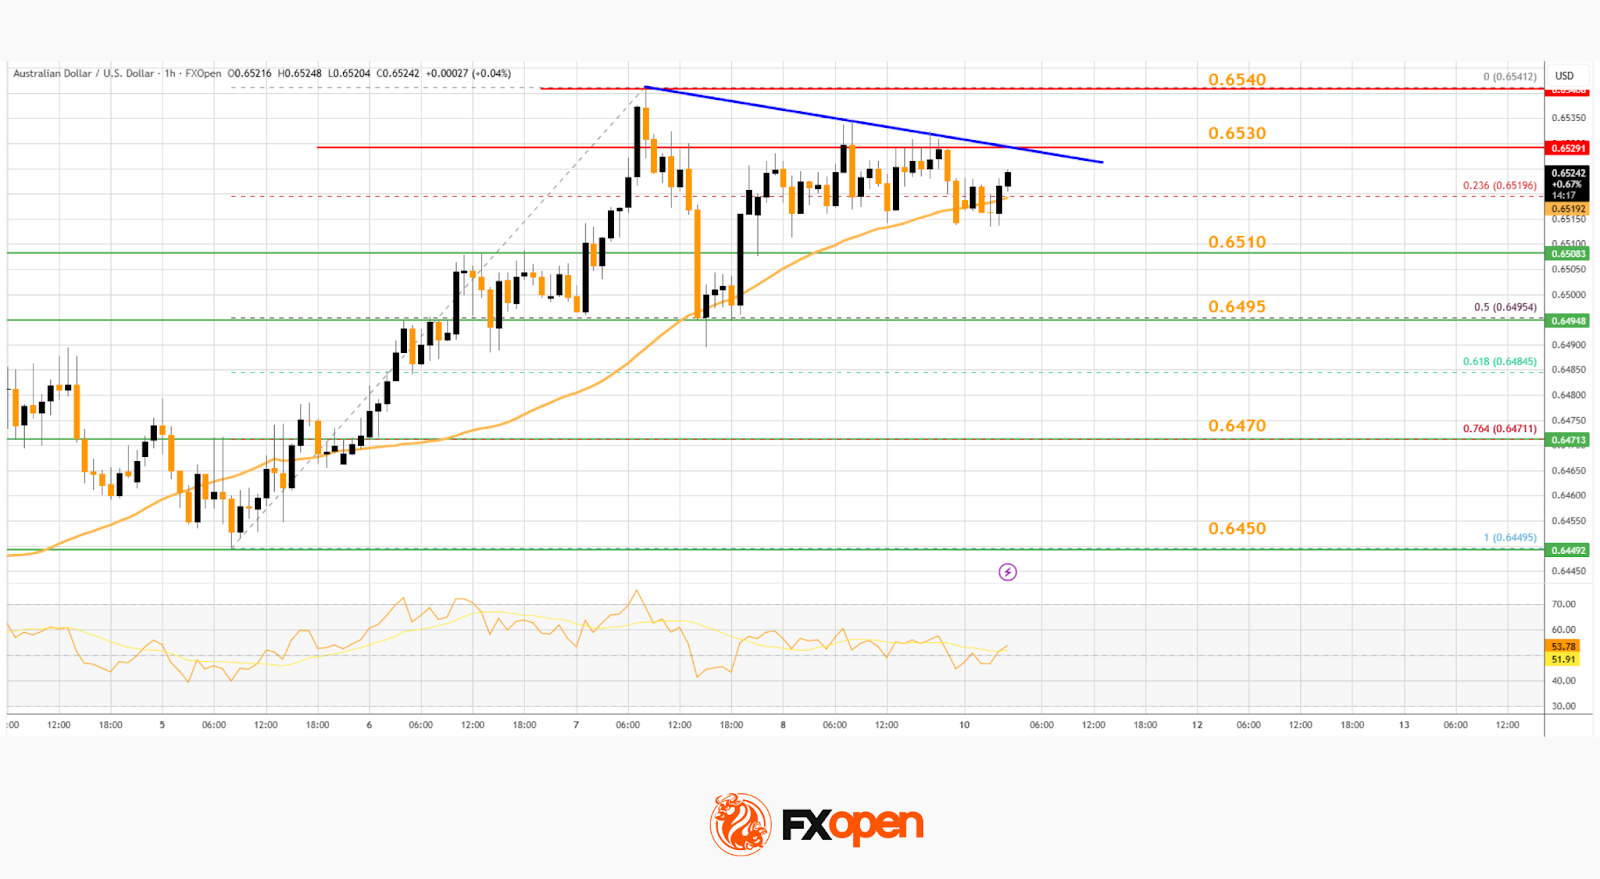
There was a close above the 0.6500 resistance and the 50-hour simple moving average. Finally, the pair tested the 0.6540 zone. A high was formed near 0.6541 and the pair recently started a consolidation phase.
There was a move below the 23.6% Fib retracement level of the upward move from the 0.6449 swing low to the 0.6541 high. On the downside, initial support is near the 0.6510 level.
The next major support is near the 0.6495 zone or the 50% Fib retracement level. If there is a downside break below 0.6495, the pair could extend its decline toward the 0.6470 level. Any more losses might signal a move toward 0.6450.
On the upside, the AUD/USD chart indicates that the pair is now facing resistance near 0.6530. There is also a connecting bearish trend line forming with resistance at 0.6530.
The first major resistance might be 0.6540. An upside break above it might send the pair further higher. The next major resistance is near the 0.6580 level. Any more gains could clear the path for a move toward the 0.6600 resistance zone.
NZD/USD Technical Analysis
On the hourly chart of NZD/USD on FXOpen, the pair started a steady increase from the 0.5880 zone. The New Zealand Dollar broke the 0.5925 resistance to start the recent increase against the US Dollar.
The pair settled above 0.5940 and the 50-hour simple moving average. It tested the 0.5970 zone and is currently consolidating gains. There was a move below the 23.6% Fib retracement level of the upward move from the 0.5881 swing low to the 0.5971 high.
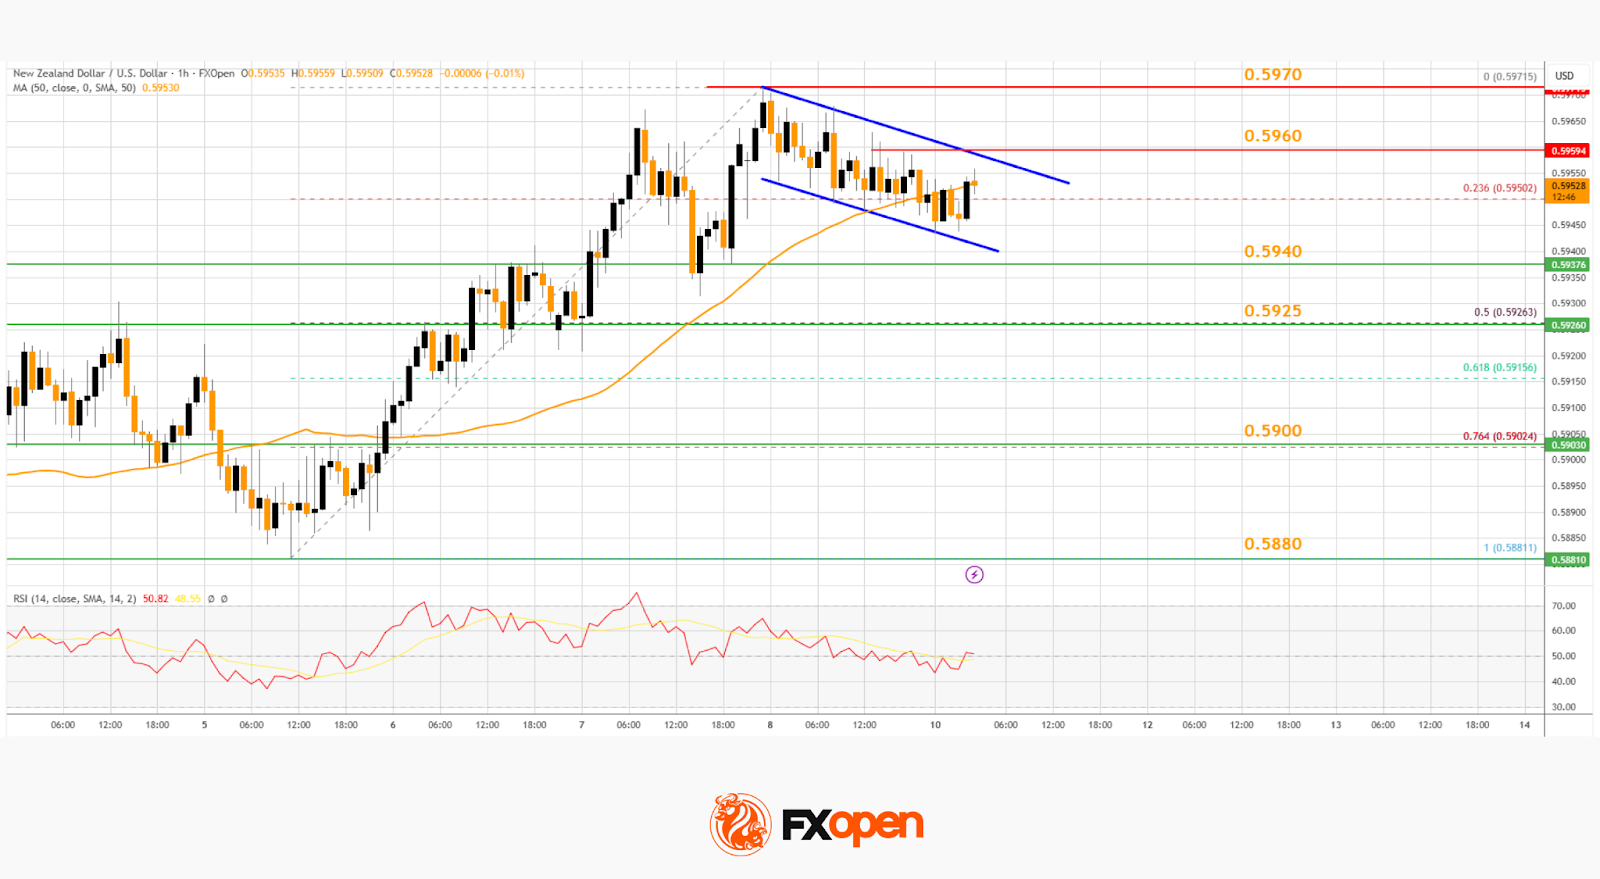
The NZD/USD chart suggests that the RSI is stable above 50. On the upside, the pair might struggle near 0.5960. There is also a short-term declining channel forming with resistance at 0.5960.
The next major resistance is near the 0.5970 level. A clear move above the 0.5970 level might even push the pair toward the 0.6000 level. Any more gains might clear the path for a move toward the 0.6020 resistance zone in the coming days.
On the downside, immediate support is near the 0.5940 level. The first key support is near the 0.5925 level. It is close to the 50% Fib retracement level of the upward move from the 0.5881 swing low to the 0.5971 high.
The next major support is near the 0.5900 level. If there is a downside break below it, the pair might slide toward 0.5880. Any more losses could lead NZD/USD to 0.5820.
Trade over 50 forex markets 24 hours a day with FXOpen. Take advantage of low commissions, deep liquidity, and spreads from 0.0 pips. Open your FXOpen account now or learn more about trading forex with FXOpen.
This article represents the opinion of the Companies operating under the FXOpen brand only. It is not to be construed as an offer, solicitation, or recommendation with respect to products and services provided by the Companies operating under the FXOpen brand, nor is it to be considered financial advice.
Gold Weakens Amid Improved Risk Appetite
Gold opened the week lower, slipping below 3,380 USD per troy ounce on Monday, as easing geopolitical tensions reduced demand for the metal as a safe-haven asset.
On Friday, US President Donald Trump announced plans to meet Russian President Vladimir Putin in Alaska on 15 August to negotiate a ceasefire. A successful outcome could diminish the likelihood of further US sanctions against Moscow.
Despite the decline, prices found some support from lingering trade risks and growing expectations of a Fed rate cut by year-end. Last Thursday, higher US tariffs on imports from several countries came into effect, prompting the affected trade partners to seek urgent concessions.
This week, investors will focus on key US economic data, including CPI and PPI inflation figures and retail sales, to gauge the Fed’s next policy moves.
Adding to market uncertainty, the White House’s stance on gold bullion tariffs remains unclear. Last week, the US government confirmed that gold imports are subject to duties, while upcoming inflation data could influence the Fed’s rate decision.
Technical Analysis: XAU/USD
H4 Chart:
The XAU/USD pair is consolidating broadly around 3,383 USD, with recent swings extending between 3,408 USD (upper bound) and 3,367 USD (lower bound). Today, we anticipate a rise towards 3,420 USD, potentially stretching to 3,425 USD, followed by a fresh downward wave targeting 3,345 USD. A break below this level could extend losses to 3,255 USD. This outlook is supported by the MACD indicator, where the signal line remains above zero and points firmly upward.
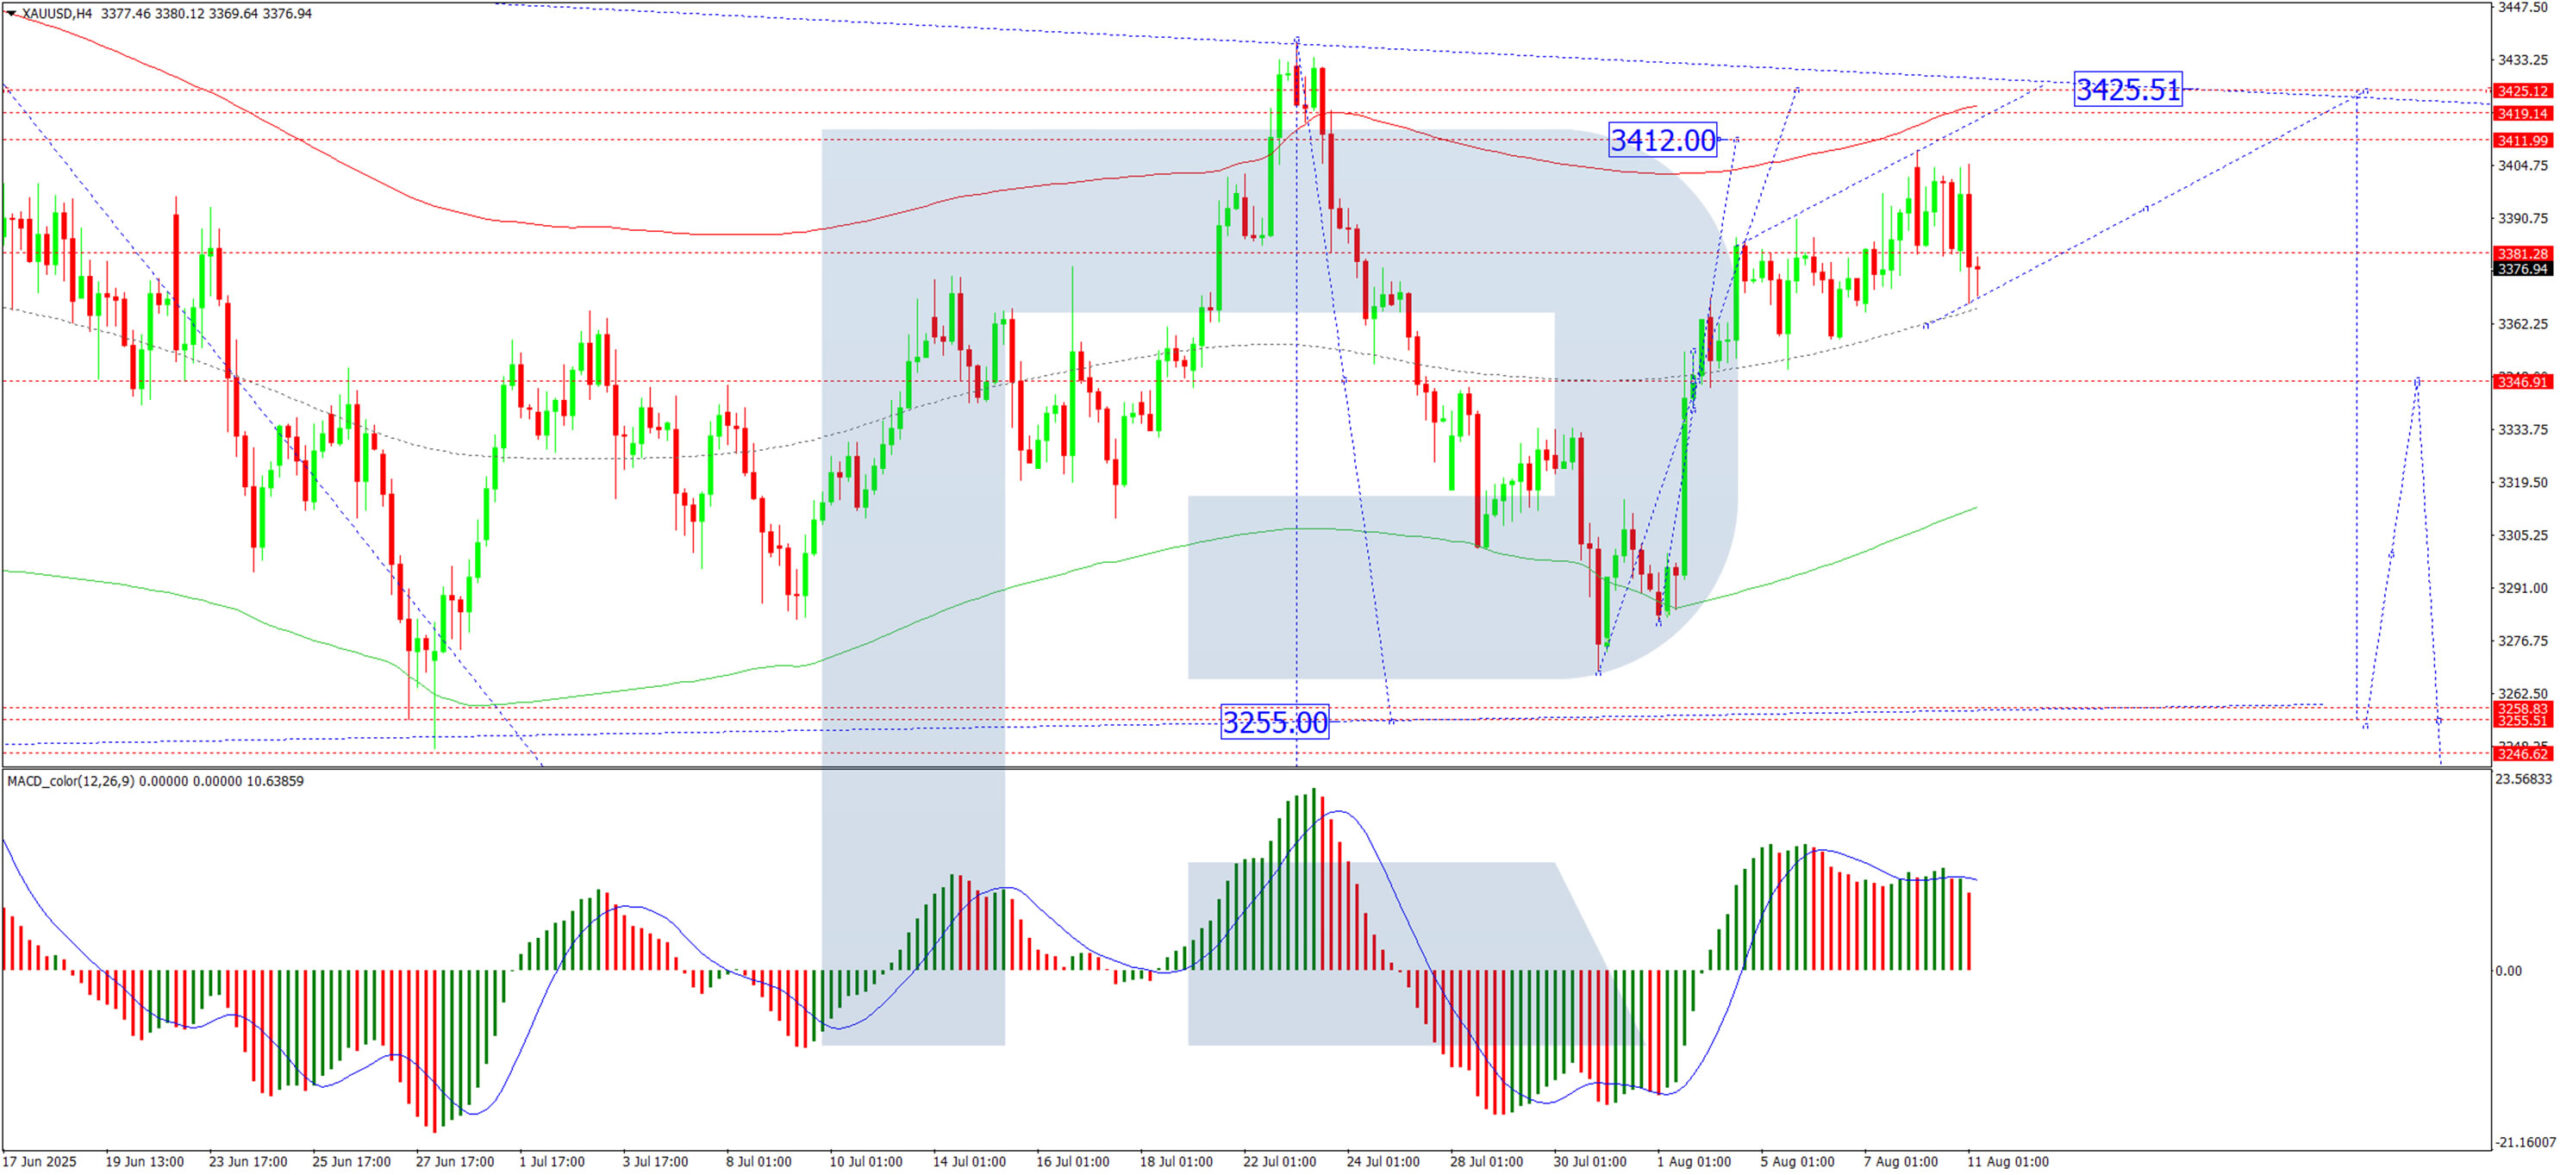
H1 Chart:
The pair has completed an upward structure to 3,408 USD, with a subsequent correction to 3,368 USD. Today, we expect a rebound towards 3,393 USD, effectively marking the consolidation range. An upside breakout could propel prices towards 3,420 USD, while a downside breakout may trigger a decline to 3,313 USD. The Stochastic oscillator corroborates this view, with its signal line below 50 and trending downward towards 20.
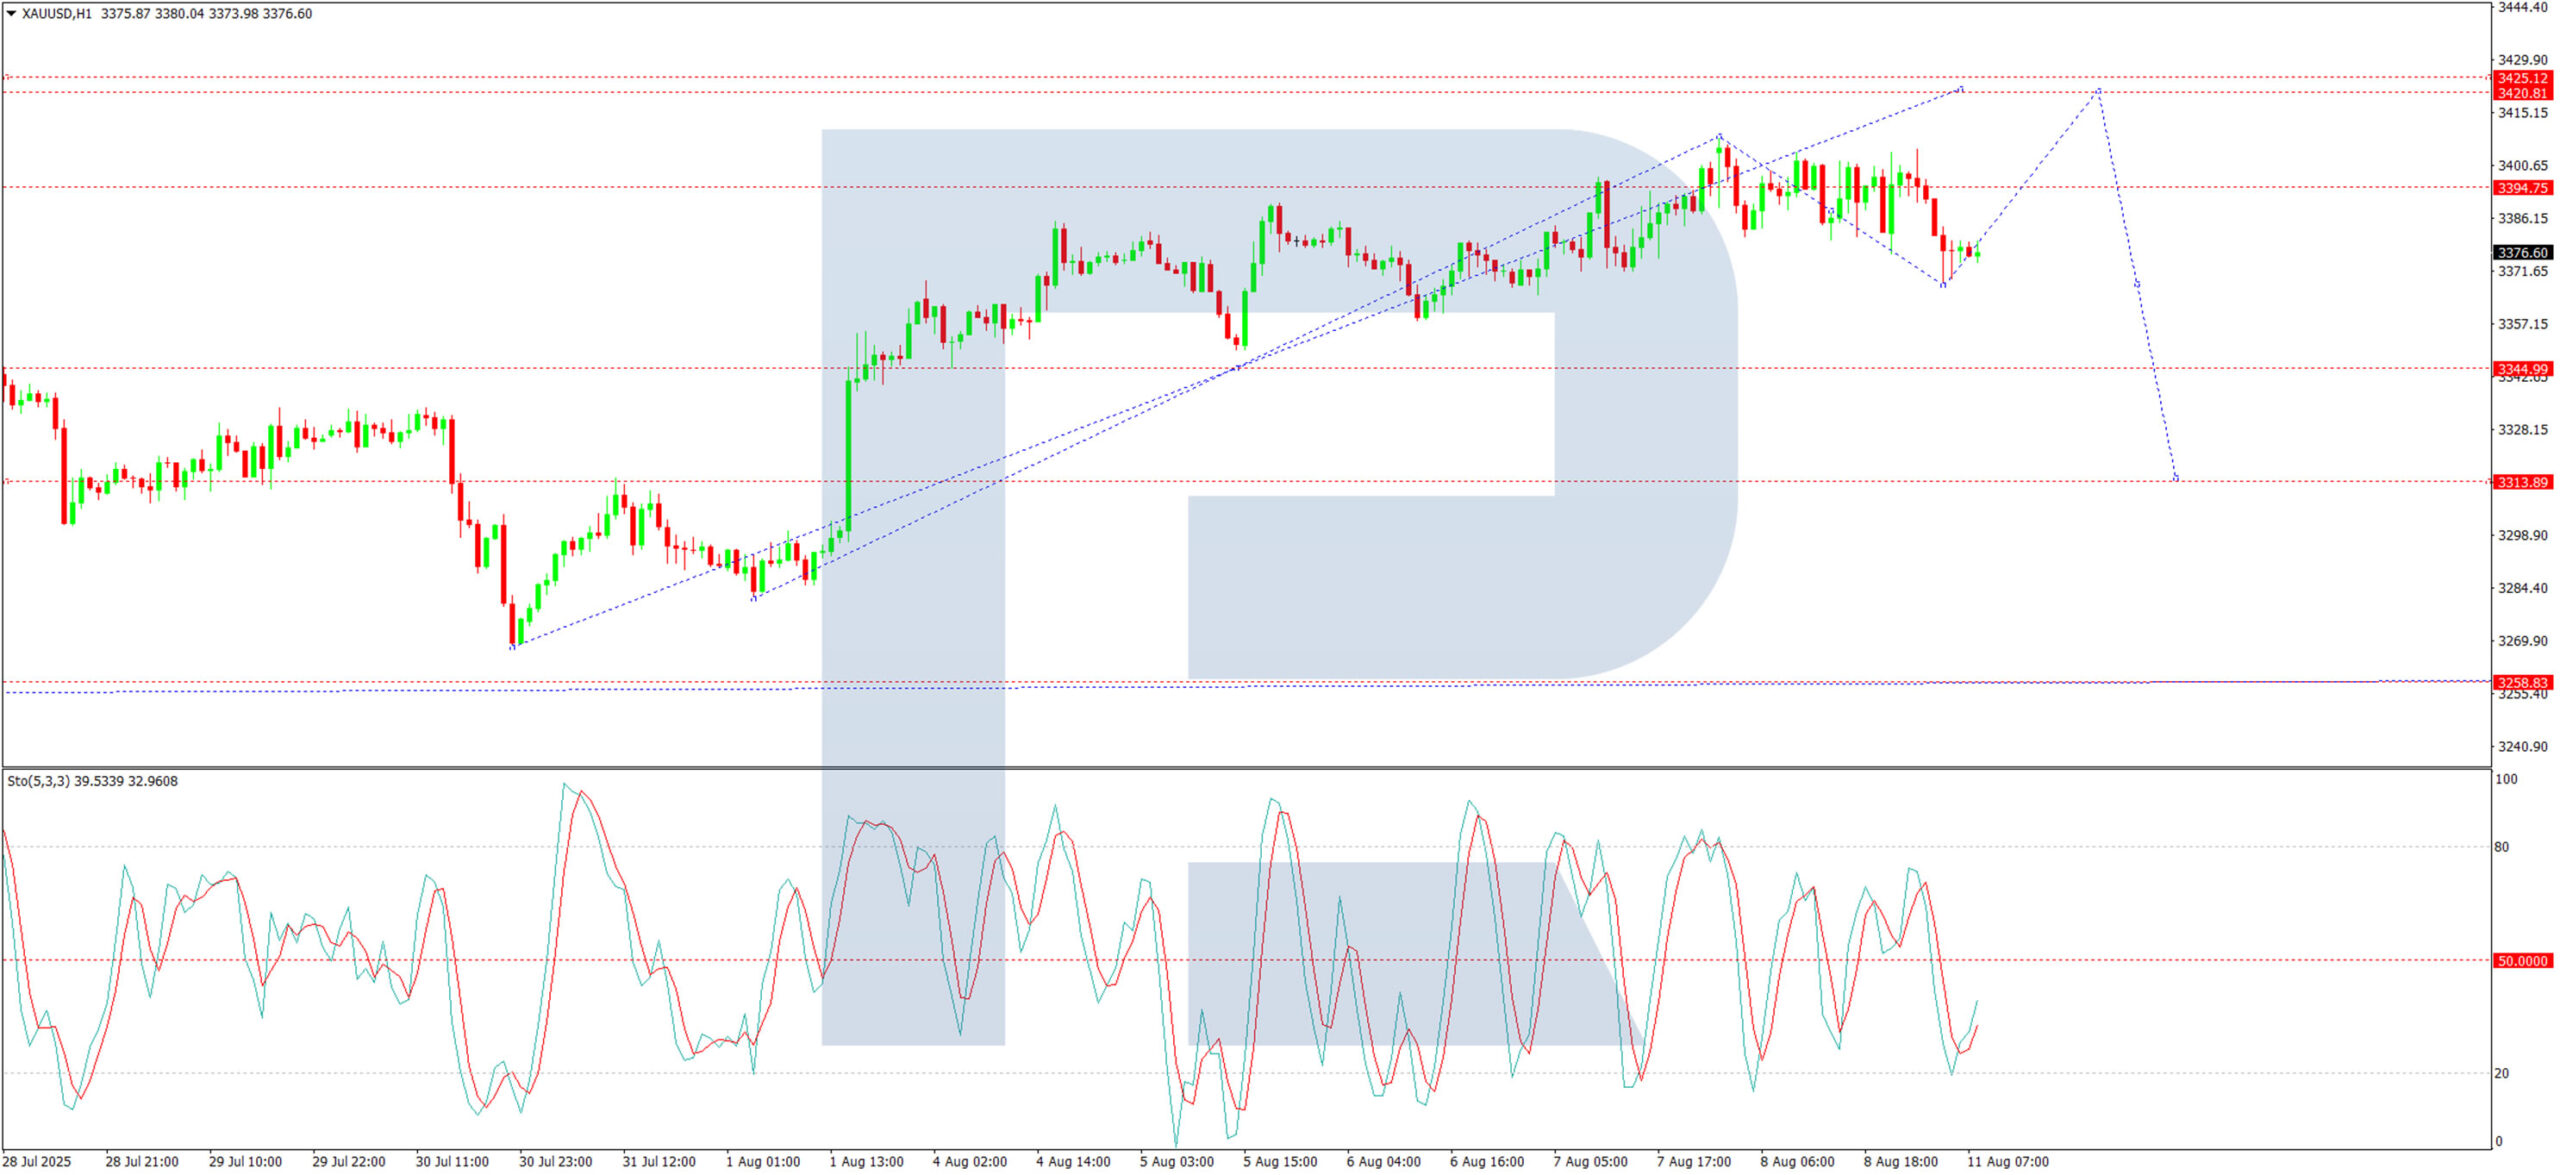
Conclusion
Gold remains under pressure amid reduced safe-haven demand, although trade tensions and Fed rate cut expectations provide some support. Technically, the metal faces key resistance near 3,420 USD, with a bearish reversal likely upon failure to sustain momentum.
Bitcoin and Ethereum Racing to the Top
Market Overview
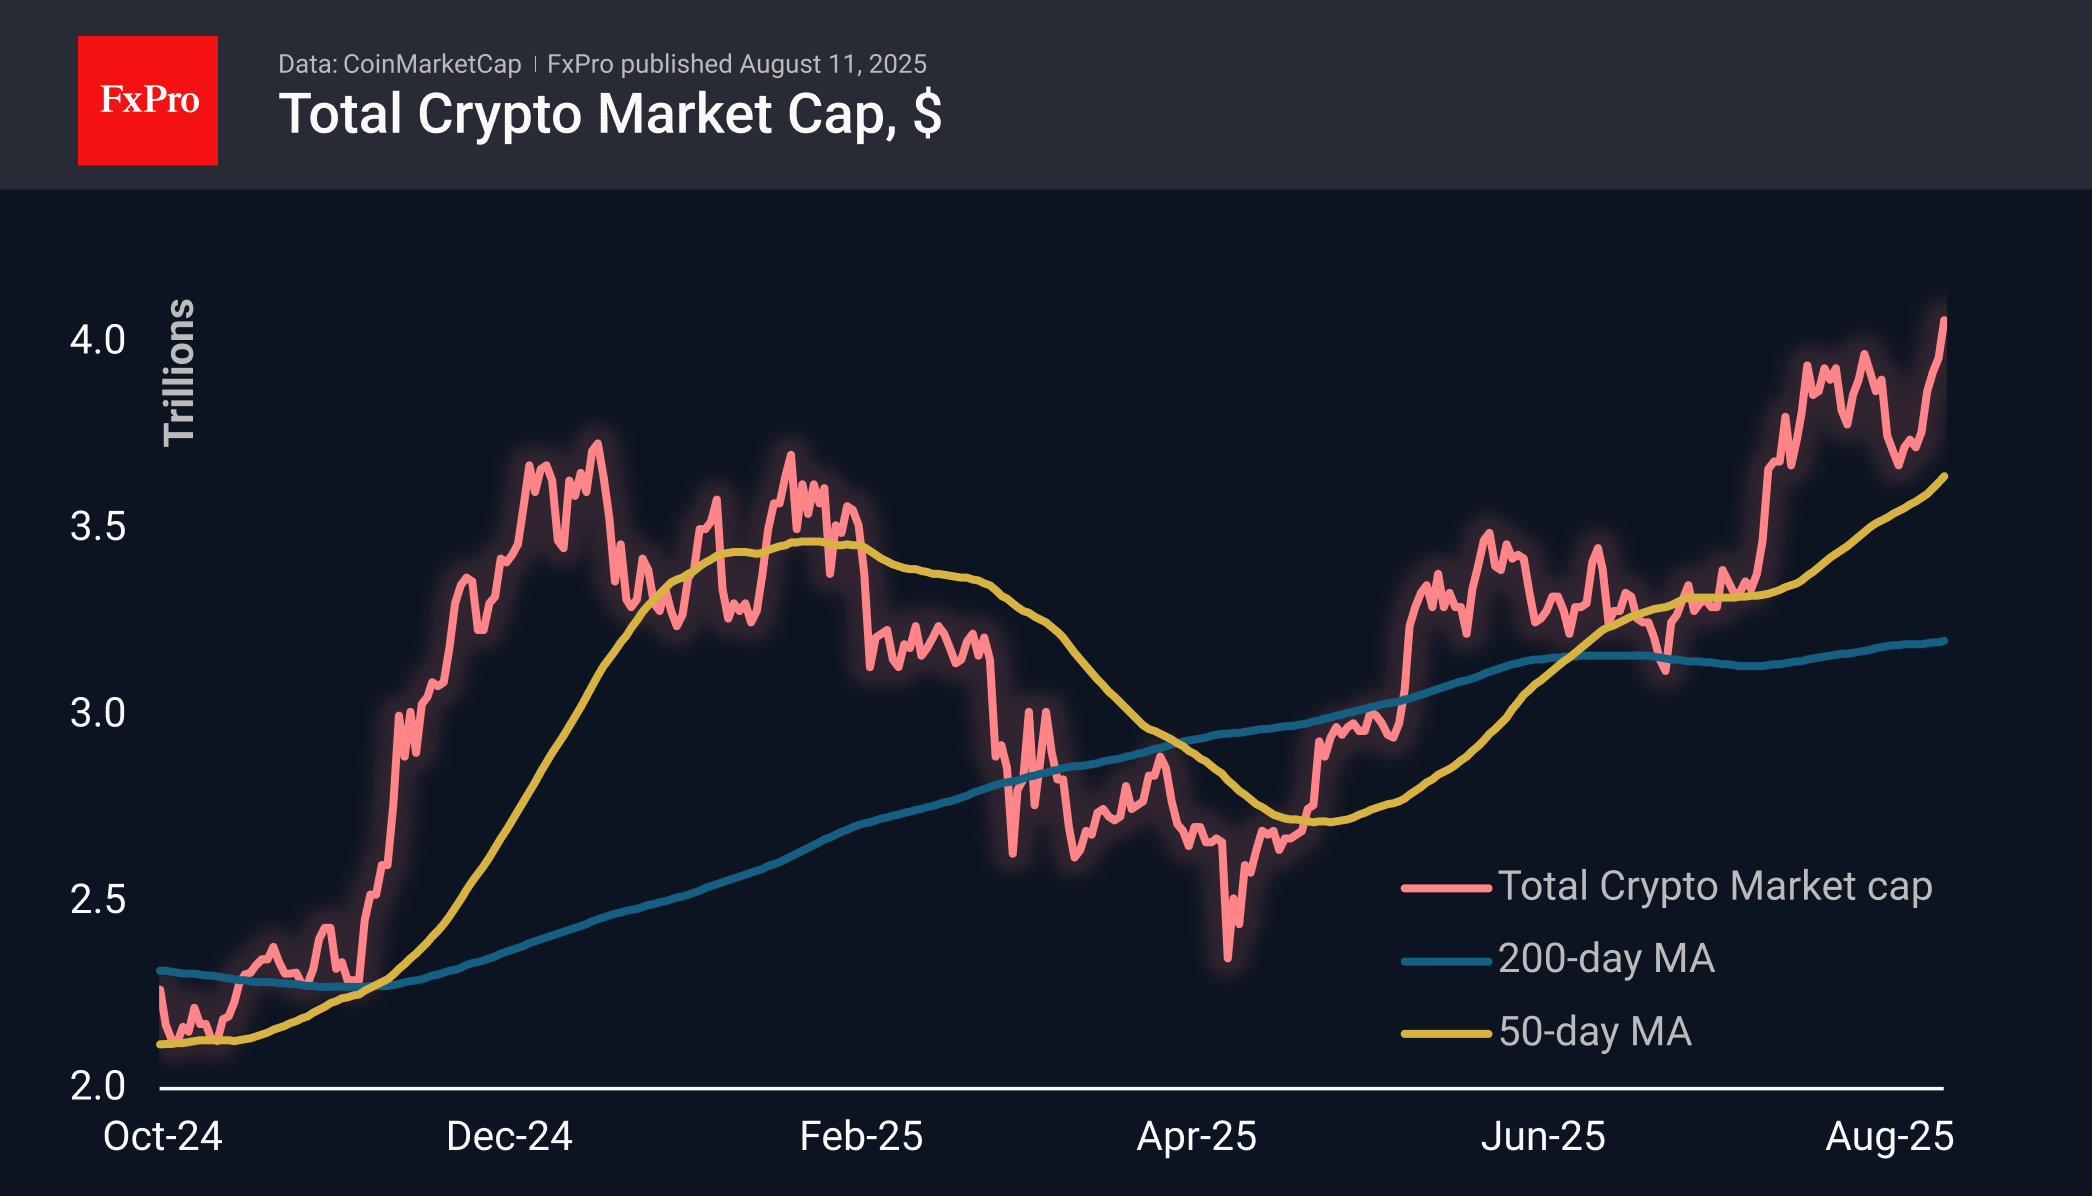
The cryptocurrency market cap is updating its historical highs, reaching $4.06 trillion thanks to Bitcoin’s rally since the start of the day on Monday. Altcoins are mostly staying out of this race for now, taking a break after last week’s rally. This is one of the few times when a rally in major altcoins has inspired BTC to break through. It’s usually the other way around.
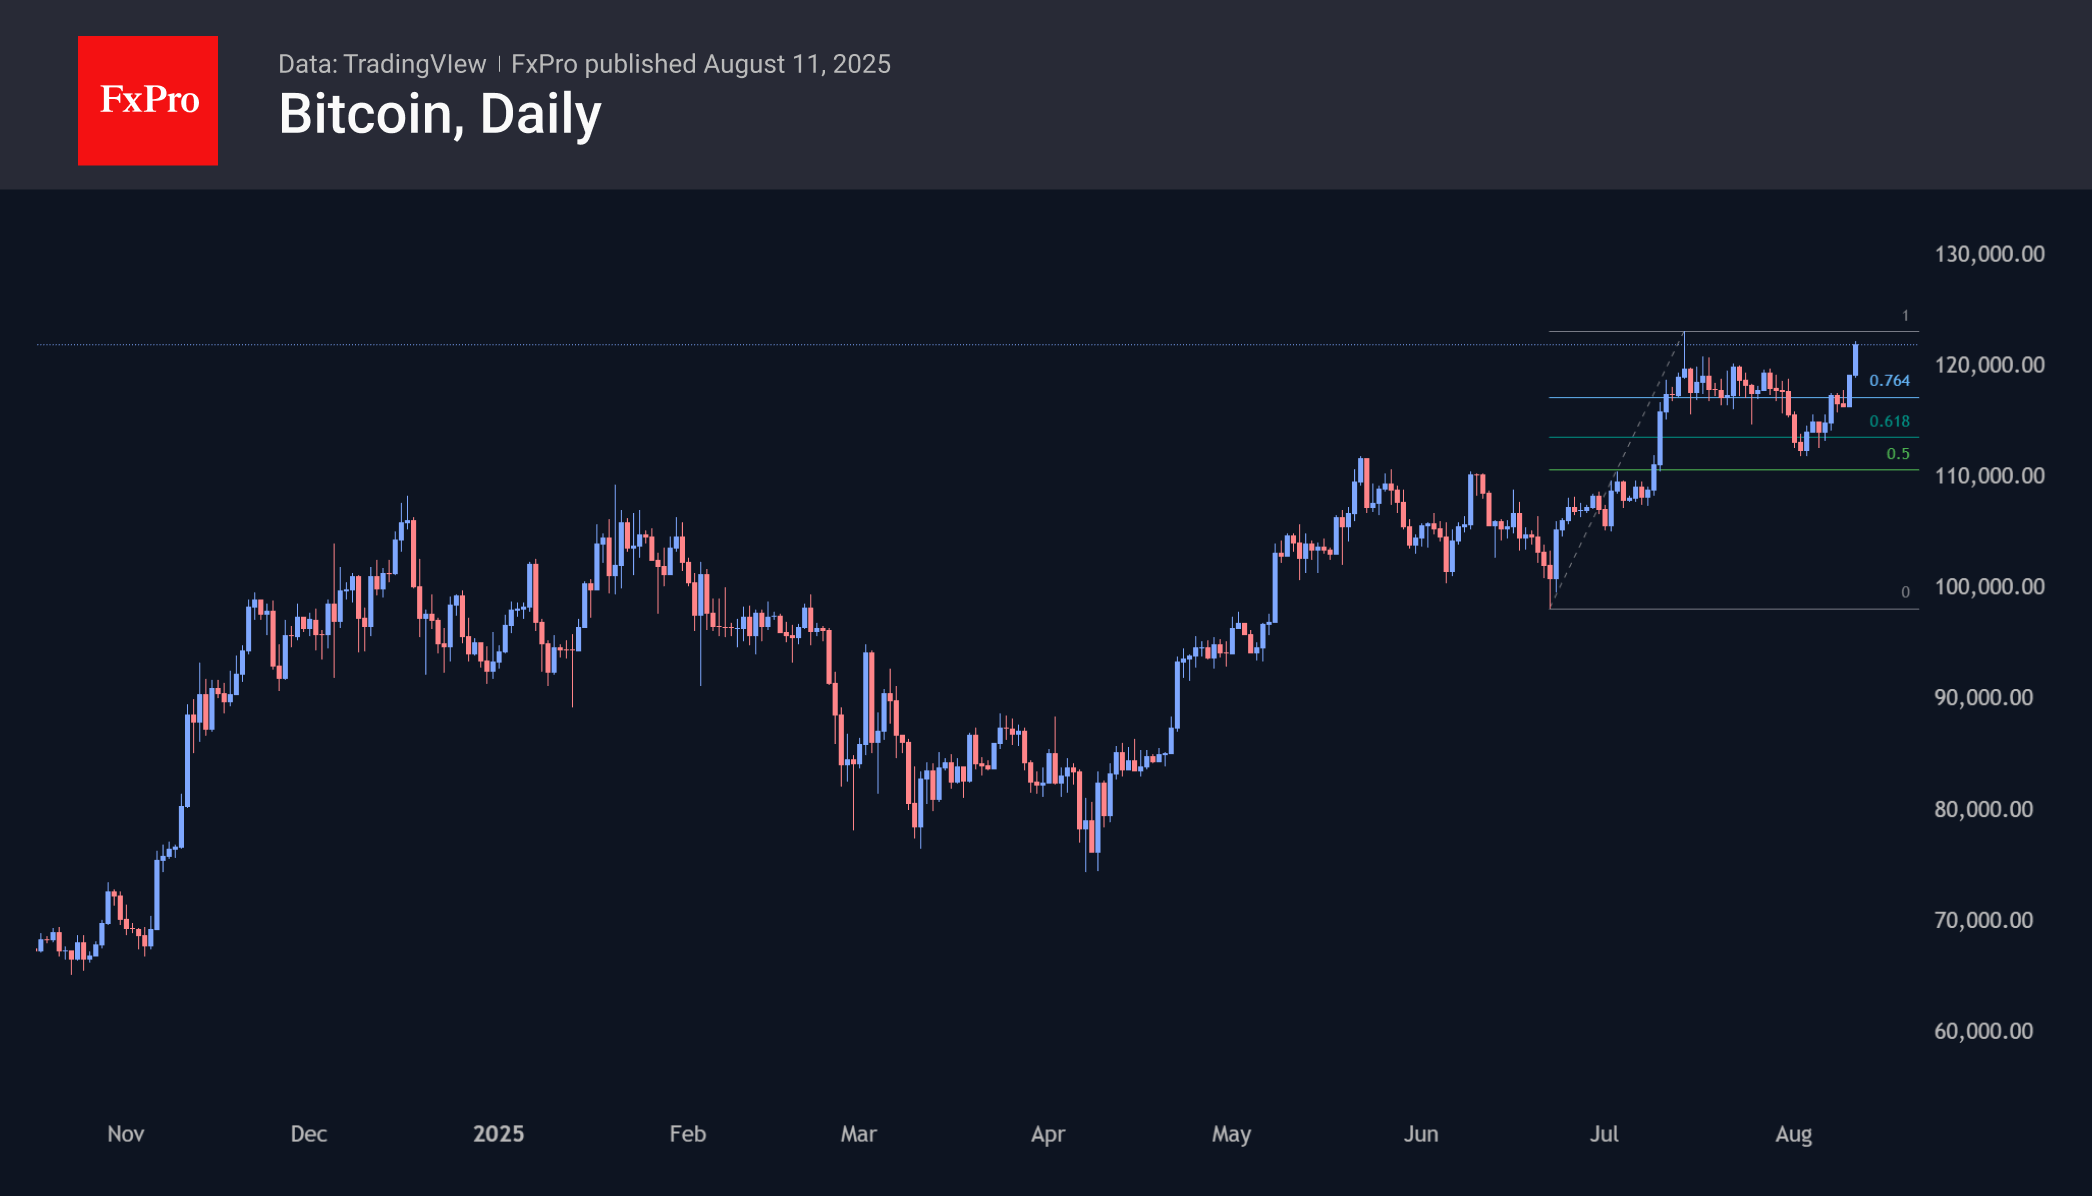
Bitcoin is trading above $122K, testing historical highs. An important area of resistance was around $120K. For the media, it is formally important to update the highs, although from a technical point of view, the breakthrough has already been made. The bull’s nearest target now looks to be the $135-138K area.
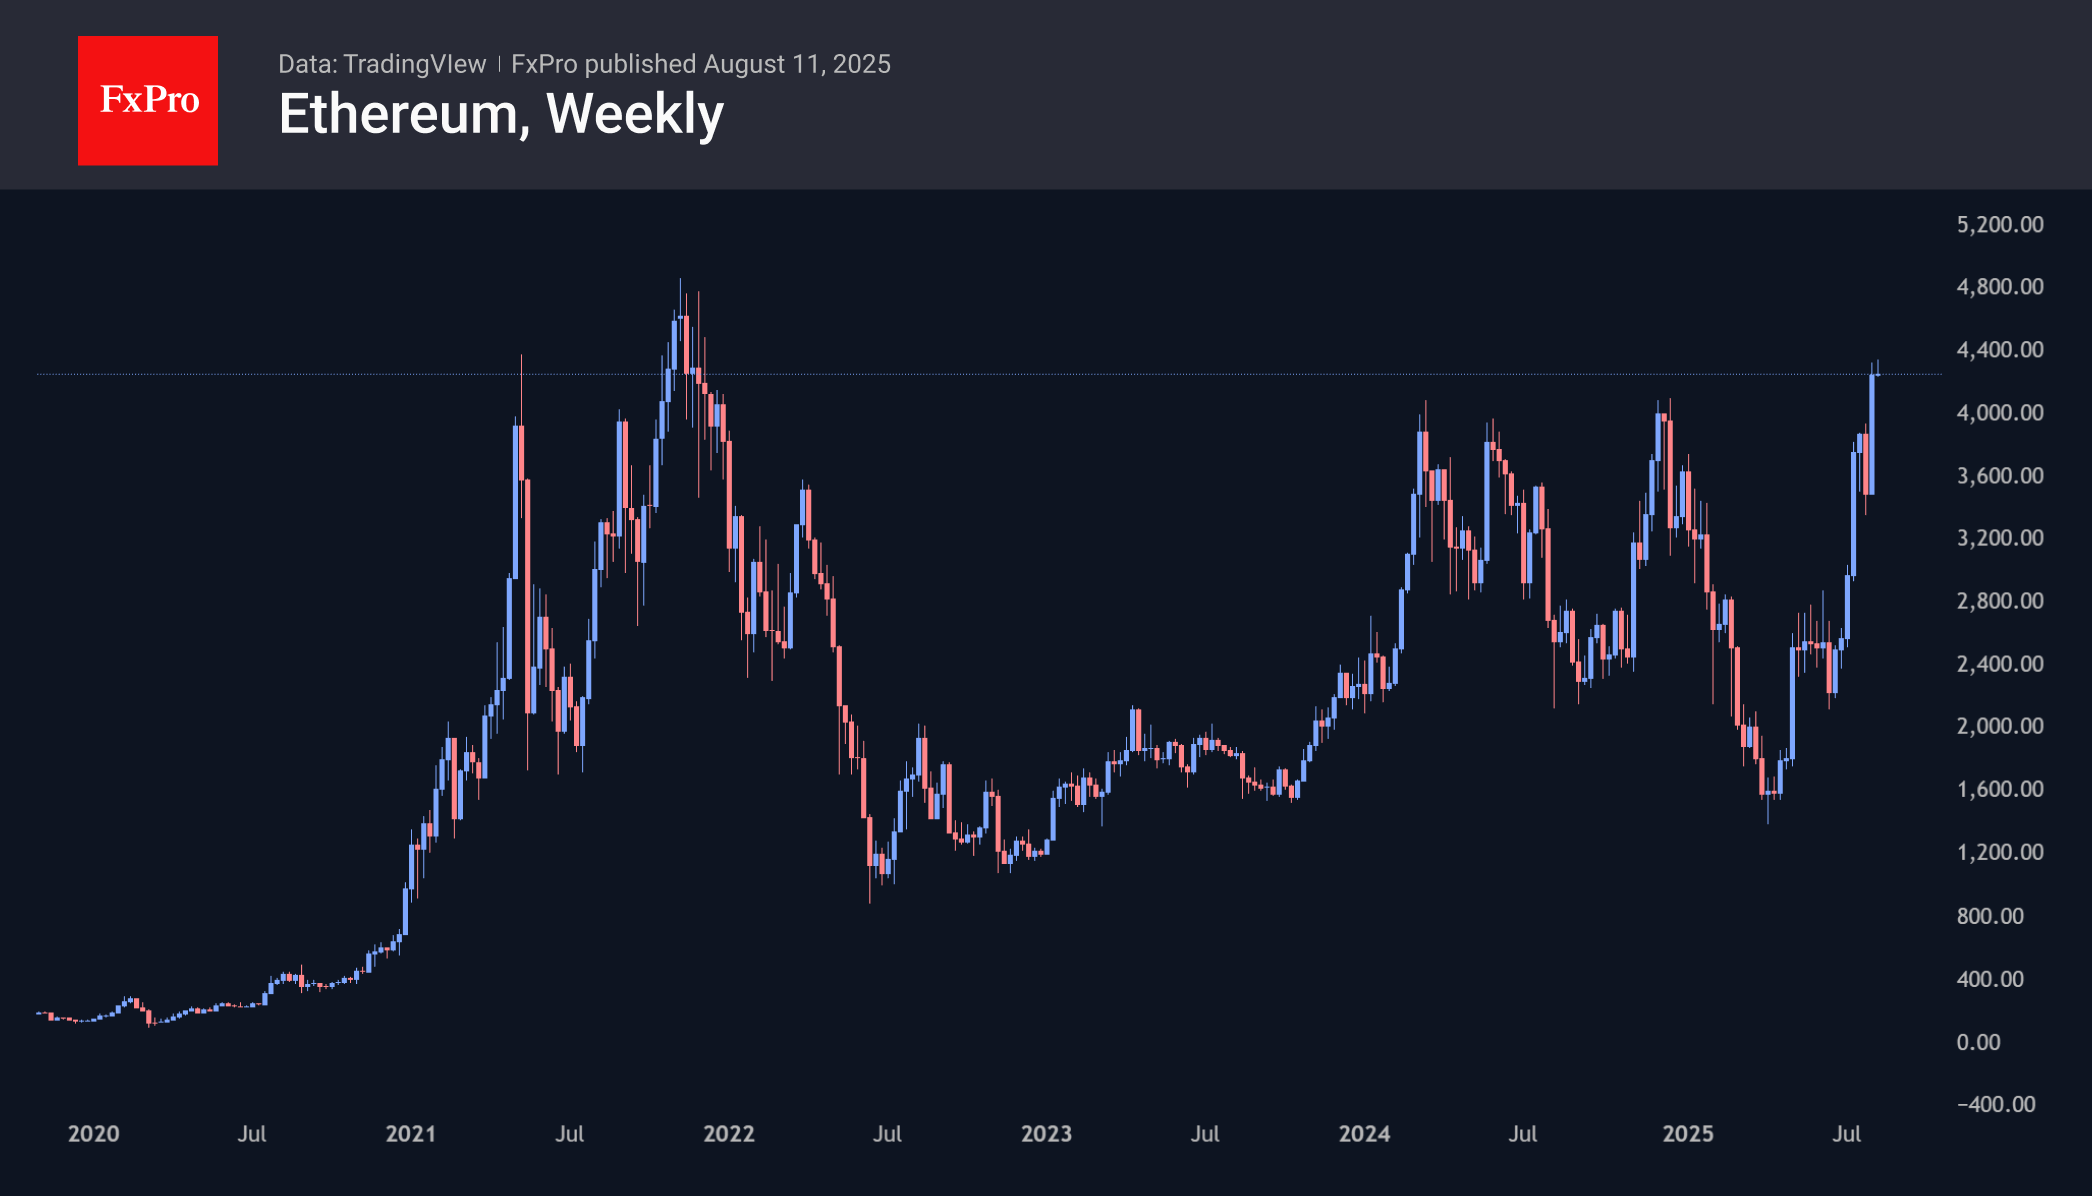
Ethereum has gained over 21% in seven days and 45% in the last 30 days, becoming one of the beneficiaries of recent legislative changes in the United States. The second-largest cryptocurrency by capitalisation is trading near $4,300, above which it was for less than four weeks at the end of 2021, with a historic peak just above $4,800. We would not be surprised to see this figure updated in the coming days.
News Background
The market received a positive boost from Trump signing an executive order on retirement savings. The document instructs the Department of Labour to prepare conditions for adding cryptocurrencies, private equity and other alternative assets to 401(k) retirement plans.
According to Bitwise, corporate treasuries and ETFs have purchased 371,111 BTC since the beginning of the year, which is 3.75 times more than the amount mined by miners during the same period.
Retail investors have also started accumulating. According to Glassnode, wallets with a balance of up to 100 BTC purchase about 17,000 BTC monthly, which exceeds the current issuance of 13,850 BTC. The situation is exacerbated by a rapid decline in liquidity on OTC platforms, which could trigger a sharp rise in Bitcoin.
According to Capriole Investments founder Charles Edwards, Bitcoin is trading 45% below its ‘energy value’ of $167,800. The indicator determines BTC’s fair value as a function of the amount of energy expended, the rate of supply growth, and a constant coefficient reflecting its value in dollars.
The latest recalculation increased the difficulty of mining Bitcoin by 1.42% to 129.44 T. According to Glassnode, the BTC network’s hash rate reached a record high of 1,031 ZH/s.
Ethereum is growing against the background of increased on-chain activity. The daily transaction volume on the network is updating historical highs, and the number of new addresses is approaching the historical high reached in May 2021.
Bitcoin Price Climbs Back Above $120k
Over the weekend, the value of the leading cryptocurrency rose significantly. While the BTC/USD rate closed around $116.6k on Friday, today Bitcoin is trading above $120k and is nearing a potential new all-time high.
Since its August low, the price has increased by approximately 9%.
Why Bitcoin is Rising Today
From a fundamental perspective, this growth may be driven by:
→ Expectations ahead of tomorrow’s key US inflation data release (CPI report due at 15:30 GMT+3);
→ Donald Trump’s decision to allow pension and other funds to include cryptocurrencies and other alternative assets in their portfolios. Analysts believe the presidential decree could trigger a fresh wave of capital inflows into Bitcoin.
BTC/USD Technical Analysis
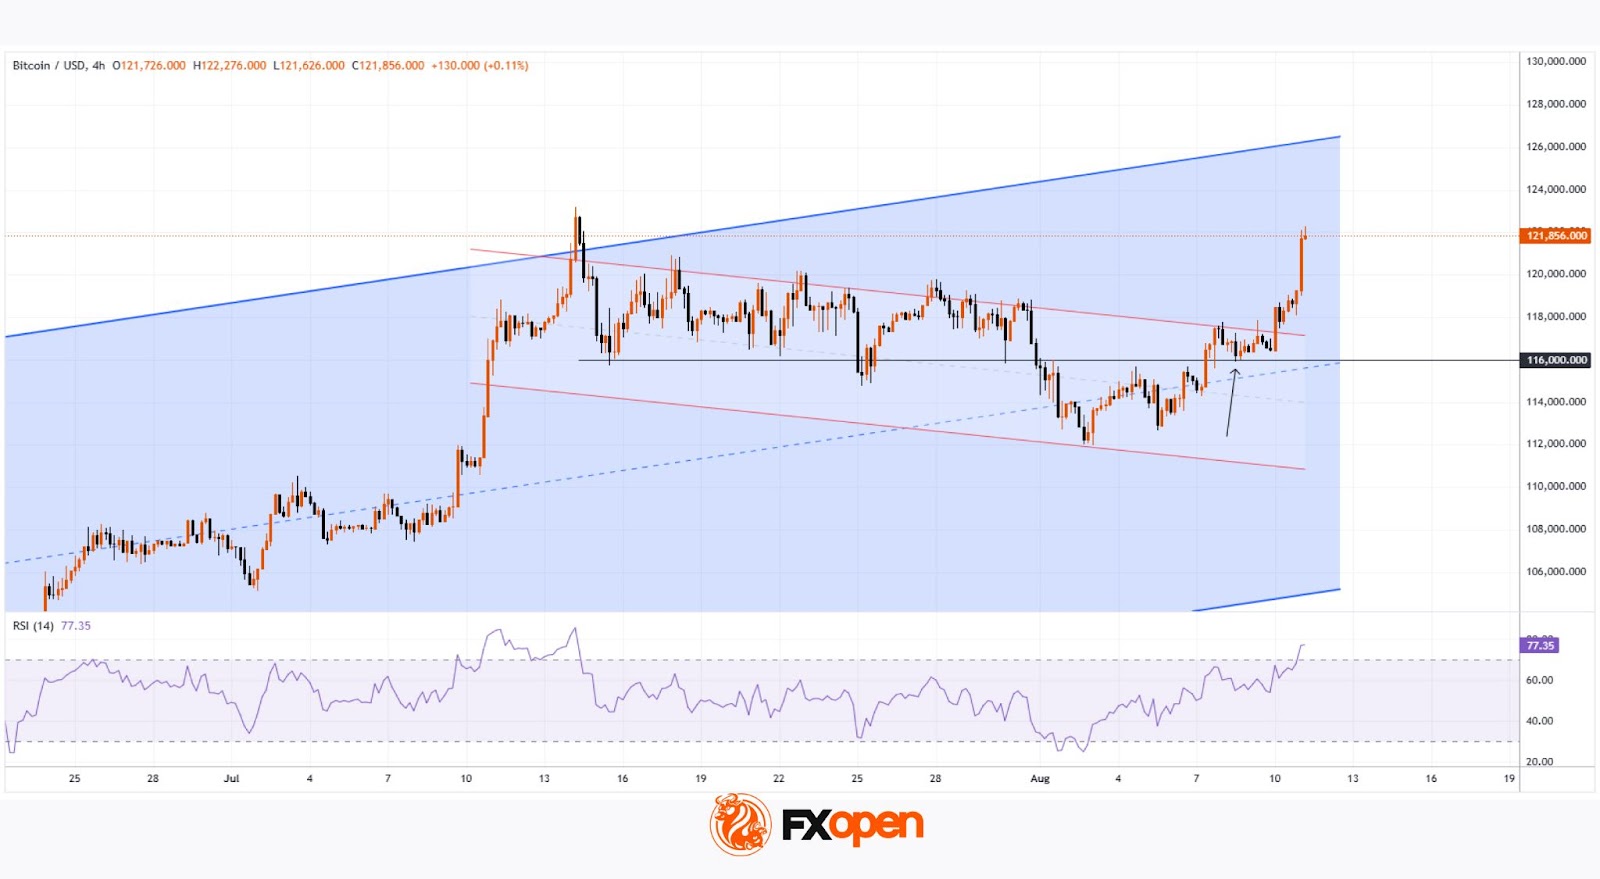
Last week, when analysing Bitcoin’s price, we extended the long-term blue ascending channel and:
→ Marked an intermediate descending channel with red lines;
→ Highlighted the importance of the $116k level.
The latest data shows that:
→ The $116k level has shifted from resistance to support (as indicated by the arrow);
→ The descending channel acted as a Bull Flag pattern — a temporary correction within the prevailing upward trend.
What’s Next for BTC/USD?
It is possible that the bullish momentum will be sufficient for the price to attempt surpassing its previous all-time high this week. However, such a move could push the market into an even more overbought state (the RSI indicator is already above 70).
So, BTC/USD could aim for the upper boundary of the blue channel, while forming short-term corrections along the way — for example, retesting the psychological $120k mark (recently breached by a strong bullish candle and potentially serving as important support going forward).
It is worth noting that analysts at the on-chain options research platform Dervie expect Bitcoin to reach $150,000 by year-end.
FXOpen offers the world's most popular cryptocurrency CFDs*, including Bitcoin and Ethereum. Floating spreads, 1:2 leverage — at your service. Open your trading account now or learn more about crypto CFD trading with FXOpen.
*Important: At FXOpen UK, Cryptocurrency trading via CFDs is only available to our Professional clients. They are not available for trading by Retail clients. To find out more information about how this may affect you, please get in touch with our team.
This article represents the opinion of the Companies operating under the FXOpen brand only. It is not to be construed as an offer, solicitation, or recommendation with respect to products and services provided by the Companies operating under the FXOpen brand, nor is it to be considered financial advice.
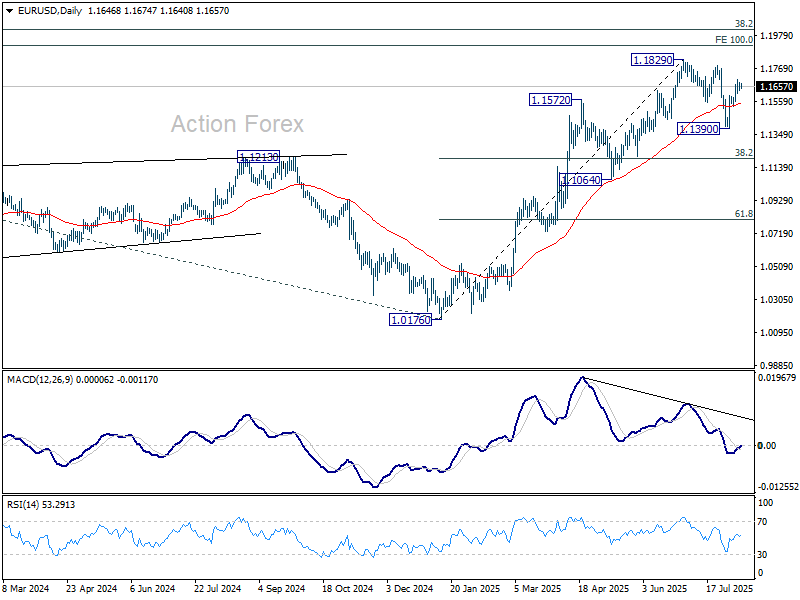
EUR/USD Daily Outlook
Daily Pivots: (S1) 1.1621; (P) 1.1650; (R1) 1.1671; More...
Intraday bias in EUR/USD remains neutral first. Outlook is unchanged that correction from 1.1829 should have completed with three waves down to 1.1390. Above 1.1698 will bring retest of 1.1829. However, break of 1.1526 support will dampen this bullish view and bring deeper fall back to 1.1390 instead.
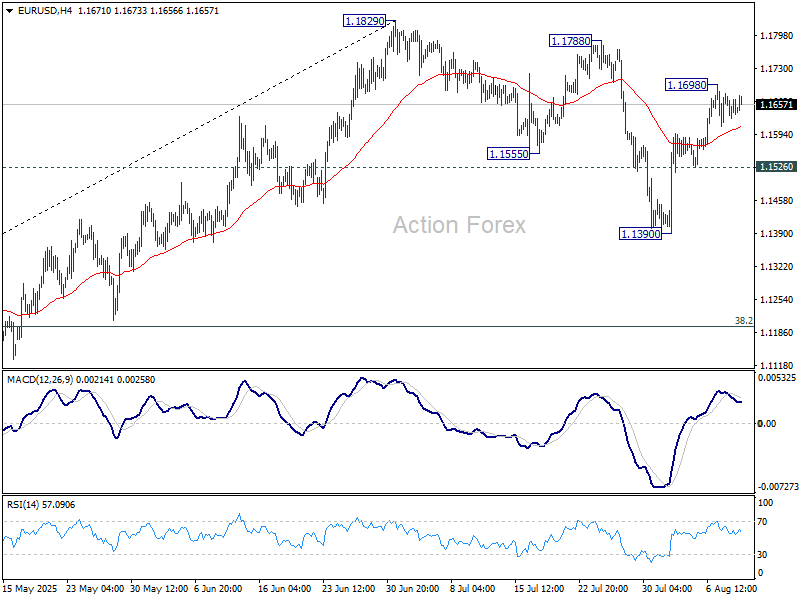
In the bigger picture, rise from 0.9534 long term bottom could be correcting the multi-decade downtrend or the start of a long term up trend. In either case, further rise should be seen to 100% projection of 0.9534 to 1.1274 from 1.0176 at 1.1916. This will remain the favored case as long as 1.1604 support holds.