Sample Category Title
USD/CHF Daily Outlook
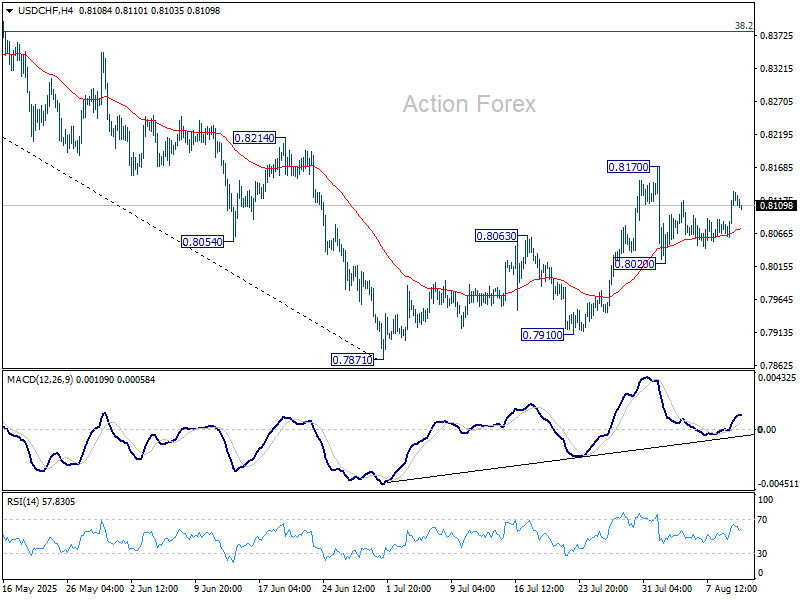
Daily Pivots: (S1) 0.8079; (P) 0.8106; (R1) 0.8150; More….
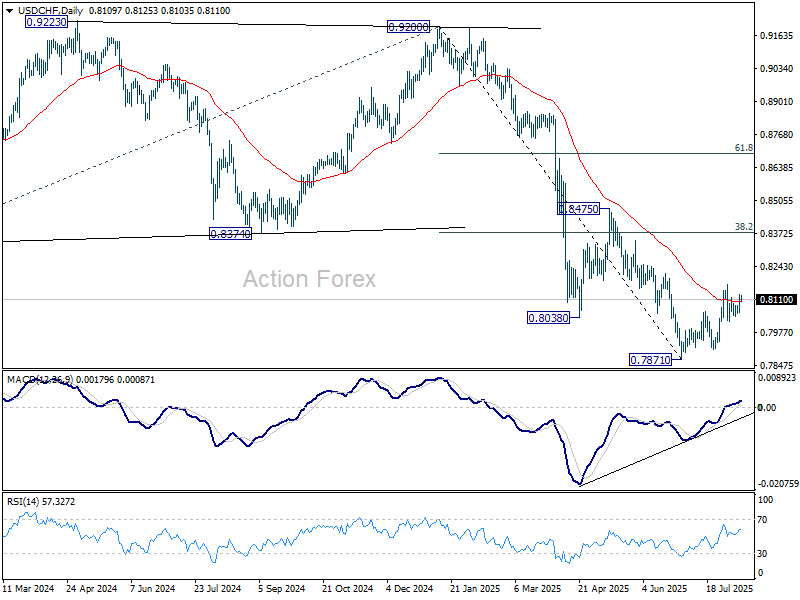
USD/CHF rebounded after drawing support from 55 4H EMA a few times, but stays below 0.8170 resistance. Intraday bias remains neutral first. ON the upside, firm break of 0.8710 will resume the corrective from 0.7871. Intraday bias will be back on the upside for 38.2% retracement of 0.9200 to 0.7871 at 0.8379. On the downside, though, break of 0.8020 will revive that case that the corrective pattern has completed, and target a retest on 0.7871 low.
In the bigger picture, long term down trend from 1.0342 (2017 high) is still in progress. Next target is 100% projection of 1.0146 (2022 high) to 0.8332 from 0.9200 at 0.7382. In any case, outlook will stay bearish as long as 0.8475 resistance holds.
USD/JPY Daily Outlook
Daily Pivots: (S1) 147.58; (P) 147.91; (R1) 148.48; More...
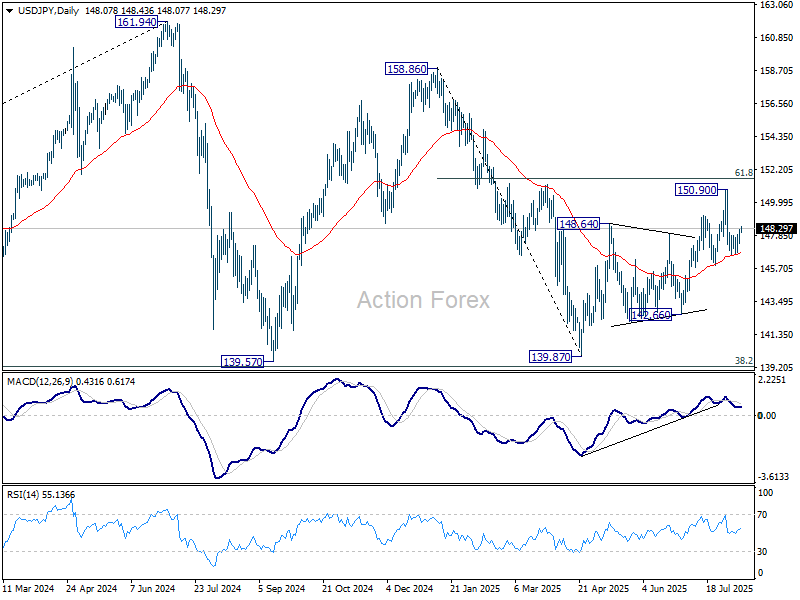
USD/JPY's extended rebound and break of 148.07 resistance suggests that pullback from 150.90 has completed at 146.61 already. Intraday bias is back on the upside for retesting 150.90 first. Firm break there will resume the whole rally from 139.87 to 151.22 fibonacci level. For now, risk will stay on the upside as long as 146.61 support holds, in case of retreat.
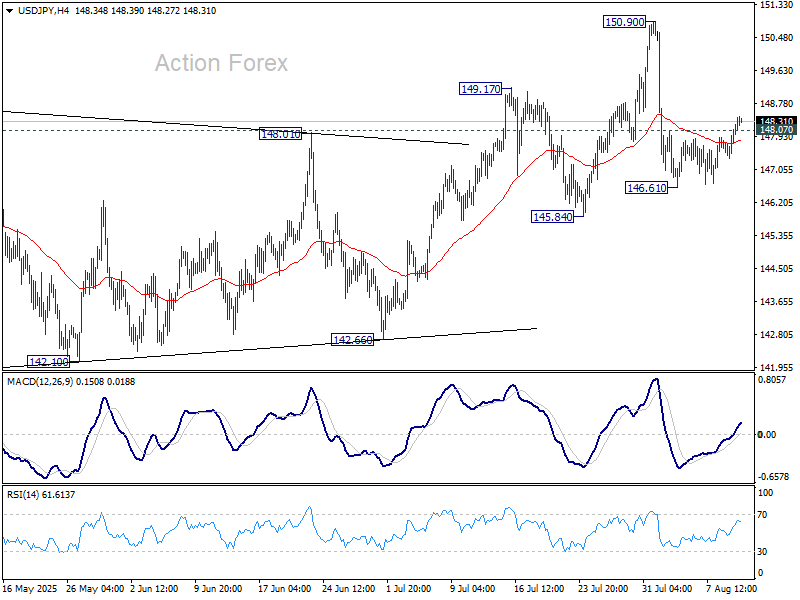
In the bigger picture, price actions from 161.94 (2024 high) are seen as a corrective pattern to rise from 102.58 (2021 low). Decisive break of 61.8% retracement of 158.86 to 139.87 at 151.22 will argue that it has already completed with three waves at 139.87. Larger up trend might then be ready to resume through 161.94 high. In case the corrective pattern extends with another fall, strong support is expected from 38.2% retracement of 102.58 to 161.94 at 139.26 to bring rebound.
Yen Slides as Nikkei Hits Record, US–China Extend Truce
Yen slumped further across the board in Asia as Japanese stocks surged, with the Nikkei charging to all-time highs after the holiday break. Optimism in Tokyo is being driven by expectations that more listed companies will upgrade earnings outlooks, with the perceived impact of US tariffs on Japanese exporters now seen as limited.
Investor sentiment was further buoyed by confirmation that the US and China have agreed to extend their tariff truce by another 90 days. The pause in escalation has removed a key overhang for risk markets for the near term.
As Nikkei advances, momentum in equities is likely to sustain selling pressure on Yen, especially against higher-yielding peers.
In the broader FX market, Aussie is a touch softer alongside Kiwi. RBA’s widely expected rate cut has had only a muted impact on sentiment. The key takeaway from the decision is that with growth forecasts downgraded and inflation steady, policymakers see scope for one more cut this year and two more in 2026.
On the other hand, Swiss Franc is stronger today, recovering some of last week’s losses, while Euro and Sterling are also trading firm. Loonie and greenback are sitting mid-pack in the performance table.
On the trade front, Monday’s US–China announcement forestalled the imposition of triple-digit tariffs on each other’s goods. US President Donald Trump signed an executive order delaying higher tariffs until November 10, maintaining the current 30% duty on Chinese imports, while Beijing confirmed its own 90-day suspension of planned tariff hikes and investment restrictions on US firms.
The extension buys valuable time ahead of the seasonal autumn surge in imports for the Christmas season, keeping electronics, apparel, and toys at lower tariff rates. Without the truce, U.S. tariffs were set to soar to 145% and Chinese duties to 125% — levels that would have amounted to a virtual trade embargo between the world’s two largest economies.
In Asia, at the time of writing, Nikkei is up 2.75%. Hong Kong HSI is up 0.09%. China Shanghai SSE is up 0.51%. Singapore Strait Times is down -0.36%. Japan 10-year JGB yield is up 0.006 at 1.500. Overnight, DOW fell -0.45%. S&P 500 fell -0.25%. NASDAQ fell -0.30%. 10-year yield fell -0.012 to 4.273.
RBA cuts to 3.60%, rate track points to one more this year
RBA lowered the cash rate by 25bps to 3.60% as widely expected, with the decision passed on a unanimous vote. The new forecasts signaled room for one more cut this year, two in 2026, and a hike in 2027.
Updated economic projections showed inflation forecasts unchanged, with year-end CPI at 3.0% in 2025, 3.1% in 2026, and 2.5% in 2027. Trimmed mean inflation was also left steady at 2.6% for 2025 and 2026, easing to 2.5% in 2027.
The growth outlook, however, was revised notably lower. Year-average GDP growth for 2025 was cut from 1.9% to 1.6%, and for 2026 from 2.2% to 2.1%, with 2027 projected at 2.0%.
The forecasts are based on interest rate assumptions of 3.4% in 2025, 2.9% in 2026, and 3.1% in 2027 — implying scope for one more cut this year, two in 2026, followed a hike in 2027.
In its statement, RBA noted that uncertainty in the global economy remains elevated. While recent developments have brought “a little more clarity” on the scope of US tariffs and the policy responses from other countries, the Bank expects that “more extreme outcomes are likely to be avoided.”
Even so, trade policy uncertainty is still expected to weigh on global activity and inflation, with the risk that households and firms delay spending until there is greater clarity. The RBA said these effects will likely continue to drag on the Australian economy “for a period”.

NAB survey shows rising Australian business confidence, pockets of inflation pressure
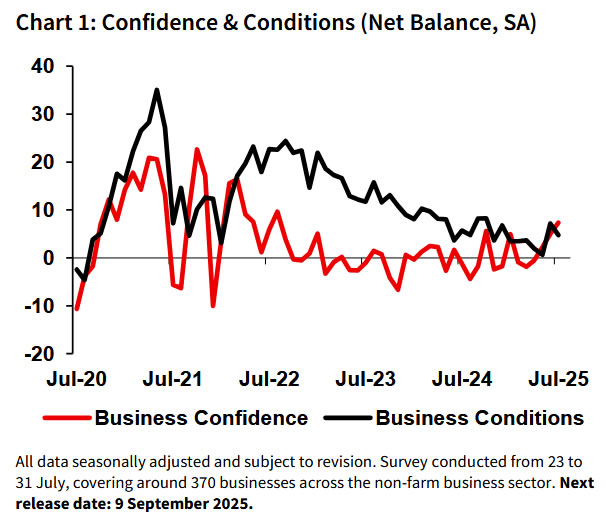
Australia’s NAB Business Confidence index rose from 5 to 7 in July, and moving just above the long-run average of 5. NAB noted that confidence has been trending higher despite elevated global uncertainty.
Business Conditions slipped from 7 to 5, with weakness seen across all subcomponents. Trading conditions fell from 14 to 11, profitability from 4 to 2, and employment from 4 to 1. While the pullback follows strong gains in June, NAB noted conditions have retained much of last month’s improvement.
Price indicators highlighted ongoing inflationary pressures in pockets of the economy. Labor cost growth accelerated from 1.3% to 2.1% in quarterly equivalent terms. Purchase costs edged up from 1.3% to 1.5%. Final product price growth strengthened from 0.5% to 0.9%, and retail price growth climbed from 0.5% to 1.1%.
USD/JPY Daily Outlook
Daily Pivots: (S1) 147.58; (P) 147.91; (R1) 148.48; More...
USD/JPY's extended rebound and break of 148.07 resistance suggests that pullback from 150.90 has completed at 146.61 already. Intraday bias is back on the upside for retesting 150.90 first. Firm break there will resume the whole rally from 139.87 to 151.22 fibonacci level. For now, risk will stay on the upside as long as 146.61 support holds, in case of retreat.
In the bigger picture, price actions from 161.94 (2024 high) are seen as a corrective pattern to rise from 102.58 (2021 low). Decisive break of 61.8% retracement of 158.86 to 139.87 at 151.22 will argue that it has already completed with three waves at 139.87. Larger up trend might then be ready to resume through 161.94 high. In case the corrective pattern extends with another fall, strong support is expected from 38.2% retracement of 102.58 to 161.94 at 139.26 to bring rebound.
RBA cuts to 3.60%, rate track points to one more this year
RBA lowered the cash rate by 25bps to 3.60% as widely expected, with the decision passed on a unanimous vote. The new forecasts signaled room for one more cut this year, two in 2026, and a hike in 2027.
Updated economic projections showed inflation forecasts unchanged, with year-end CPI at 3.0% in 2025, 3.1% in 2026, and 2.5% in 2027. Trimmed mean inflation was also left steady at 2.6% for 2025 and 2026, easing to 2.5% in 2027.
The growth outlook, however, was revised notably lower. Year-average GDP growth for 2025 was cut from 1.9% to 1.6%, and for 2026 from 2.2% to 2.1%, with 2027 projected at 2.0%.
The forecasts are based on interest rate assumptions of 3.4% in 2025, 2.9% in 2026, and 3.1% in 2027 — implying scope for one more cut this year, two in 2026, followed a hike in 2027.
In its statement, RBA noted that uncertainty in the global economy remains elevated. While recent developments have brought “a little more clarity” on the scope of US tariffs and the policy responses from other countries, the Bank expects that “more extreme outcomes are likely to be avoided.”
Even so, trade policy uncertainty is still expected to weigh on global activity and inflation, with the risk that households and firms delay spending until there is greater clarity. The RBA said these effects will likely continue to drag on the Australian economy “for a period” .
(RBA) Statement by the Reserve Bank Board: Monetary Policy Decisions
At its meeting today, the Board decided to lower the cash rate target by 25 basis points to 3.60 per cent.
Inflation has continued to moderate.
Inflation has fallen substantially since the peak in 2022, as higher interest rates have been working to bring aggregate demand and potential supply closer towards balance. In the June quarter, trimmed mean inflation over the year fell to 2.7 per cent, broadly as expected in May. Headline inflation, which has partly been affected by temporary cost of living relief measures, was 2.1 per cent, also as forecast. Updated staff forecasts for the August meeting suggest that underlying inflation will continue to moderate to around the midpoint of the 2–3 per cent range, with the cash rate assumed to follow a gradual easing path.
The outlook remains uncertain.
Uncertainty in the world economy remains elevated. There is a little more clarity on the scope and scale of US tariffs and policy responses in other countries, suggesting that more extreme outcomes are likely to be avoided. Trade policy developments are nevertheless still expected to have an adverse effect on global economic activity, and there remains a risk that households and firms delay expenditure pending still greater clarity on the outlook. As in May, the forecasts assume that both effects weigh on activity and inflation in Australia for a period.
Domestically, private demand appears to have been recovering gradually, real household incomes have picked up and some measures of financial conditions have eased.
Various indicators suggest that labour market conditions remain a little tight, although have eased further in recent months. The unemployment rate rose to 4.3 per cent in the month of June and averaged 4.2 per cent in the June quarter as a whole, in line with the May forecasts. Measures of labour underutilisation nevertheless remain at low rates and business surveys and liaison suggest that availability of labour is still a constraint for a range of employers. Looking through quarterly volatility, wages growth has eased from its peak but productivity growth has not picked up and growth in unit labour costs remains high.
There are uncertainties about the outlook for domestic economic activity and inflation stemming from both domestic and international developments. The forecasts released today are for the recovery in household consumption growth to be sustained as real incomes rise. Businesses in some sectors, however, continue to report that weakness in demand is making it difficult to pass on cost increases to final prices. There is a risk that consumption growth is a little slower than expected, which could weigh on growth in aggregate demand and lead to weaker labour market conditions. Alternatively, as real incomes and wealth continue to rise, households might choose to consume more and save less than expected. Labour market outcomes may also prove stronger than expected, given the signal from a range of leading indicators.
There are also uncertainties regarding the lags in the effect of recent monetary policy easing and how firms’ pricing decisions and wages will respond to the balance between aggregate demand and potential supply for goods and services, conditions in the labour market and continued weak productivity outcomes.
Maintaining price stability and full employment is the priority.
With underlying inflation continuing to decline back towards the midpoint of the 2–3 per cent range and labour market conditions easing slightly, as expected, the Board judged that a further easing of monetary policy was appropriate. This takes the decline in the cash rate since the beginning of the year to 75 basis points. The Board nevertheless remains cautious about the outlook, particularly given the heightened level of uncertainty about both aggregate demand and potential supply. It noted that monetary policy is well placed to respond decisively to international developments if they were to have material implications for activity and inflation in Australia.
The Board will be attentive to the data and the evolving assessment of risks to guide its decisions. In doing so, it will pay close attention to developments in the global economy and financial markets, trends in domestic demand, and the outlook for inflation and the labour market. The Board is focused on its mandate to deliver price stability and full employment and will do what it considers necessary to achieve that outcome.
Decision
Today’s policy decision was unanimous.
Ethereum Leaves Bitcoin Behind—Is a Fresh ATH Coming?
Key Highlights
- Ethereum gained over 25% and broke the $4,150 resistance zone.
- ETH is now well above a connecting bullish trend line with support at $3,700 on the daily chart.
- Bitcoin price is consolidating gains below the $122,000 resistance.
- XRP is struggling to gain pace for a move above the $3.40 level.
Ethereum Technical Analysis
Ethereum started a major increase above the $3,500 and $3,800 resistance levels. ETH cleared the $4,000 barrier and outpaced Bitcoin.
Looking at the daily chart, the price settled above the $3,800 level and the 100-day simple moving average (red). A high was formed at $4,347 and the price is now consolidating gains. On the downside, Ethereum might find support near the $4,100 level.
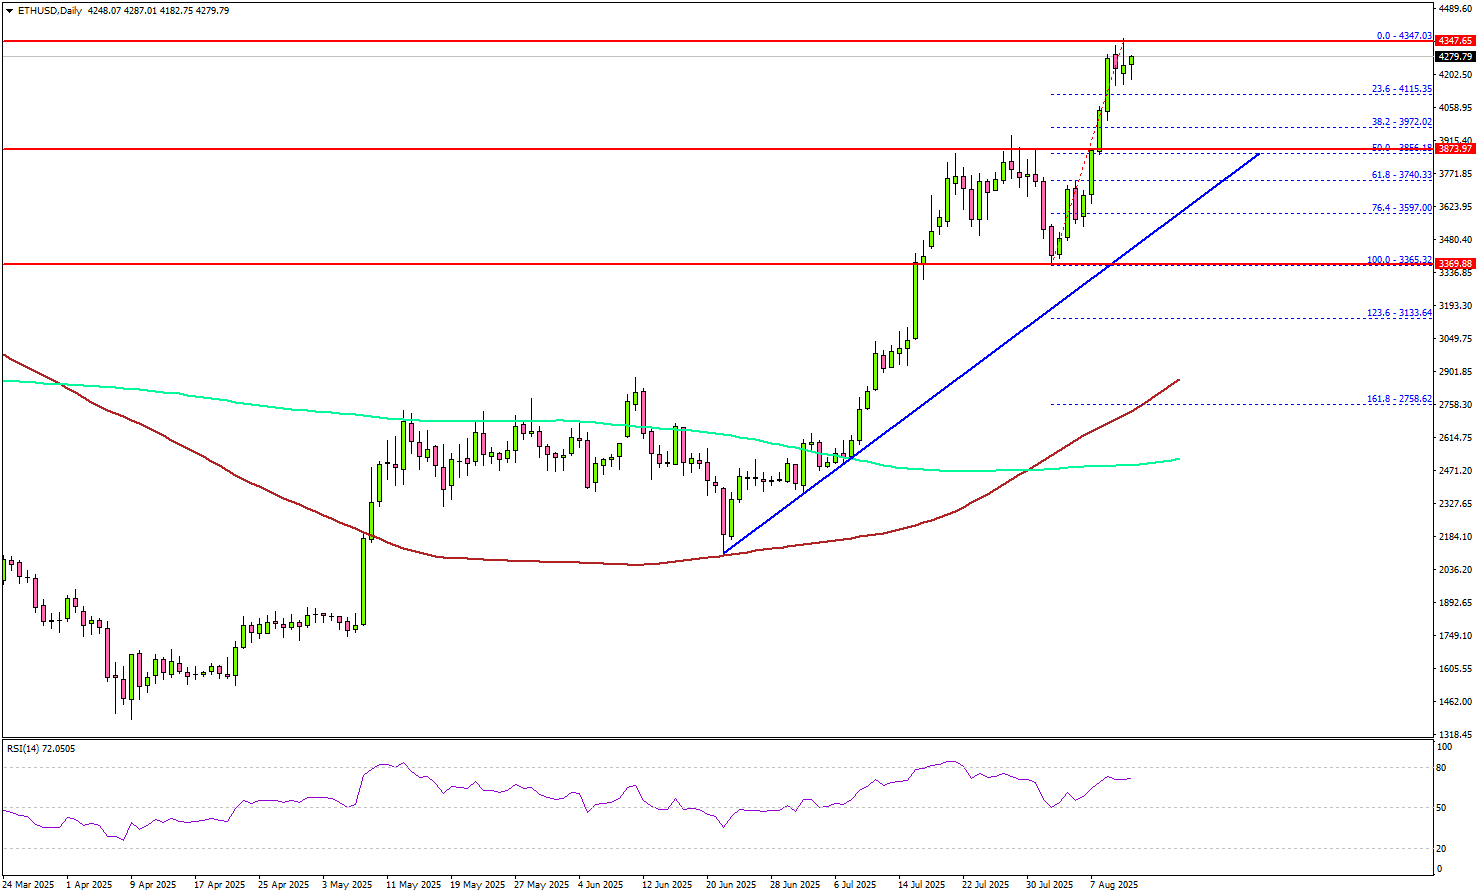
The next major support is $3,880 or the 50% Fib retracement level of the upward move from the $3,365 swing low to the $4,347 high, below which the price could slide toward $3,700.
There is also a connecting bullish trend line forming with support at $3,700 on the same chart. Any more losses might call for a move toward the $3,600 level or the 76.4% Fib retracement level of the upward move from the $3,365 swing low to the $4,347 high.
On the upside, the price is facing hurdles near the $4,350 level. The next major resistance is near the $4,500 level. A daily close above the $4,500 resistance zone could start another steady increase. In the stated case, the price may perhaps rise toward the $4,800 level. The next stop for the bulls may perhaps be $5,000.
Looking at Bitcoin, there was a steady increase above the $118,000 level but the bulls struggled to keep the price above the $121,500 level.
Economic Releases
- US Consumer Price Index for July 2025 (MoM) – Forecast +0.2%, versus +0.3% previous.
- US Consumer Price Index for July 2025 (YoY) – Forecast +2.8%, versus +2.7% previous.
- US Consumer Price Index Ex Food & Energy for July 2025 (YoY) – Forecast +3.0%, versus +2.9% previous.
NAB survey shows rising Australian business confidence, pockets of inflation pressure
Australia’s NAB Business Confidence index rose from 5 to 7 in July, and moving just above the long-run average of 5. NAB noted that confidence has been trending higher despite elevated global uncertainty.
Business Conditions slipped from 7 to 5, with weakness seen across all subcomponents. Trading conditions fell from 14 to 11, profitability from 4 to 2, and employment from 4 to 1. While the pullback follows strong gains in June, NAB noted conditions have retained much of last month’s improvement.
Price indicators highlighted ongoing inflationary pressures in pockets of the economy. Labor cost growth accelerated from 1.3% to 2.1% in quarterly equivalent terms. Purchase costs edged up from 1.3% to 1.5%. Final product price growth strengthened from 0.5% to 0.9%, and retail price growth climbed from 0.5% to 1.1%.
Elliott Wave Outlook: GBPJPY Set to Rally to Target 201.2
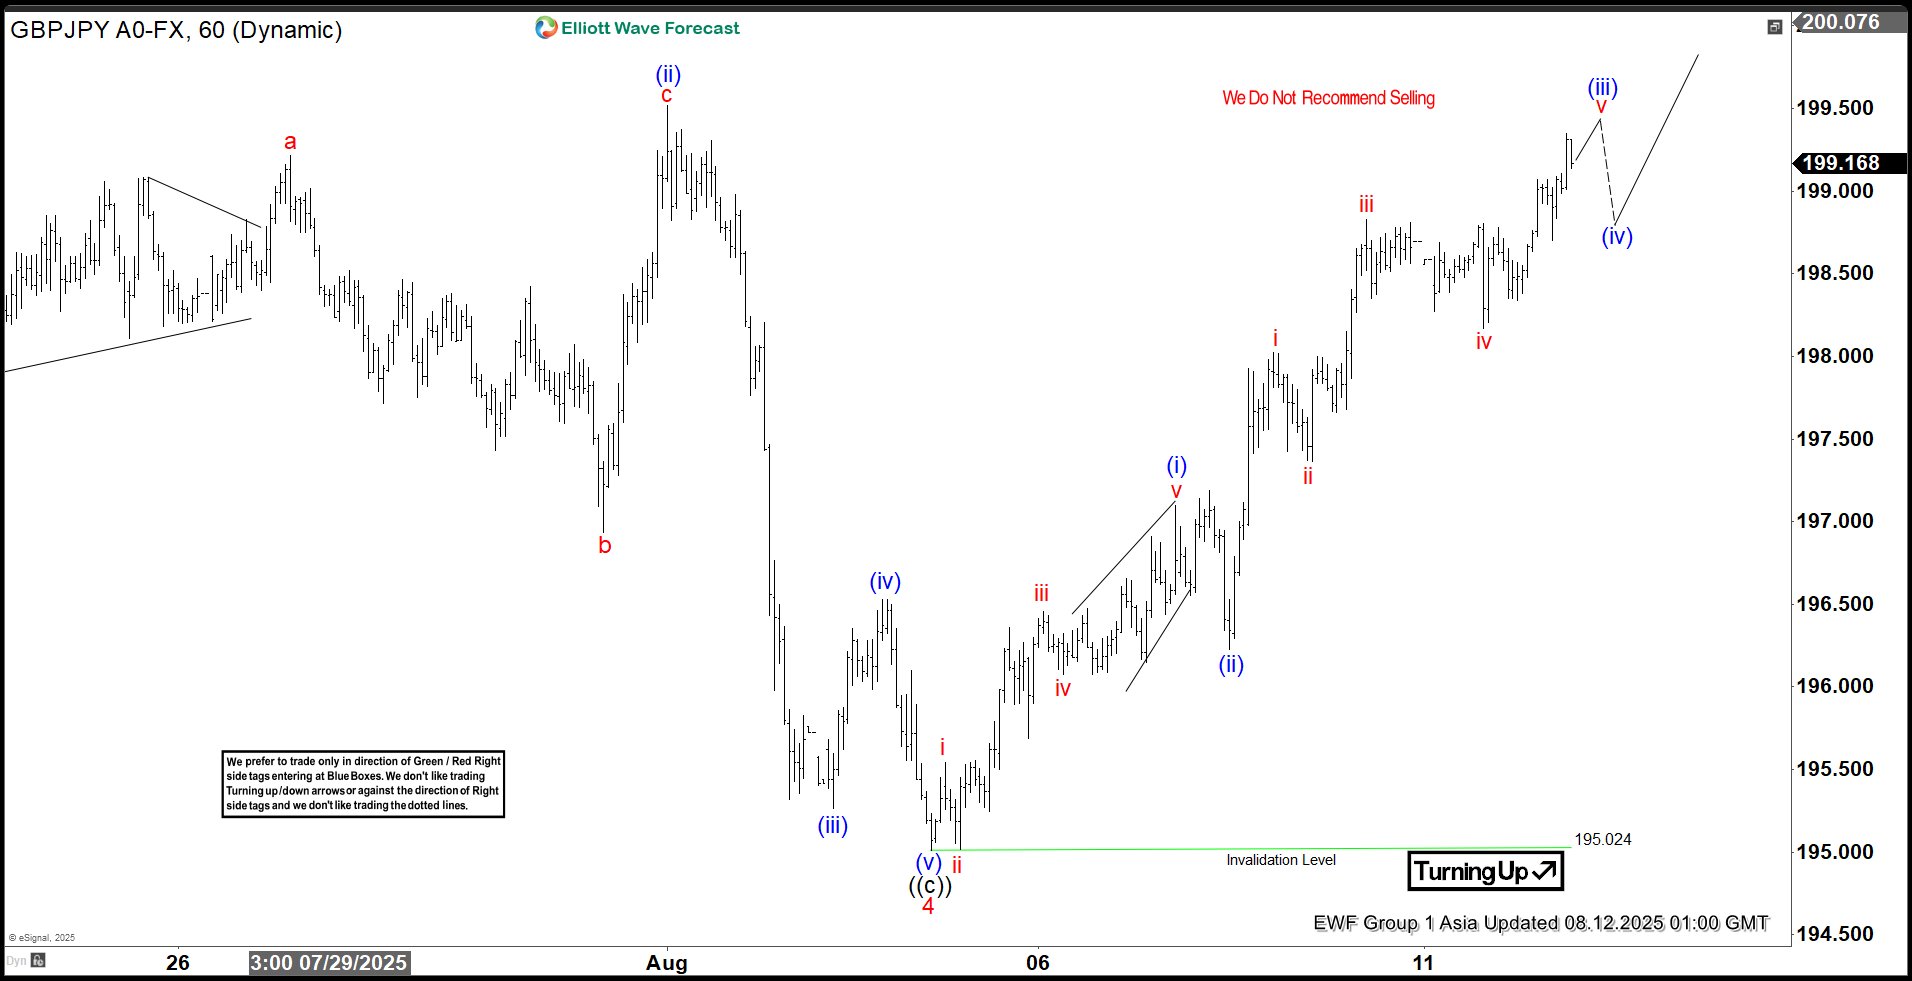
The bullish cycle initiated from the April 2025 low continues to unfold as a five-wave impulse pattern. As depicted in the one-hour chart, wave 4 concluded at 195.02. The pair has since reversed upward and is poised to breach the previous wave 3 peak at 199.97, reinforcing the bullish outlook. A confirmed breakout above this level would signal the continuation of the upward trajectory. The minimum target for this move is the 123.6% inverse Fibonacci retracement of wave 4, projecting a level of 201.2.
Currently, wave 5 is developing as a smaller-degree five-wave impulse. From the wave 4 low, wave (i) peaked at 197.1, followed by a shallow pullback in wave (ii) to 196.22. The pair has resumed its ascent and is nearing the completion of wave (iii). A corrective pullback in wave (iv) is anticipated, followed by another upward leg to complete wave (v) of ((i)). Subsequently, a wave ((ii)) correction should occur, retracing part of the cycle from the August 5, 2025 low. After this correction, the pair is expected to resume its climb, forming waves ((iii)), ((iv)), and ((v)) to finalize wave 5 and the broader cycle from April 2025. As long as the 195.02 pivot holds, further upside remains likely.
GBPJPY – 60 Minute Elliott Wave Technical Chart:
GBPJPY – Elliott Wave Technical Video:
https://www.youtube.com/watch?v=AHYv2V-cZMA
Bitcoin Rejects Test of All-Time Highs, A Double Top in the Making?
This weekend saw some explosive buying in digital assets, propulsed by Ethereum breaking above its previous highs.
After touching $4,000, a cascade of Saturday buying took the second largest crypto to $4,350 highs.
Ether is now consolidating around the $4,200 key handle – A consolidation at its highs is a more bullish sign, however for the Crypto Market to run higher, Participants will now look at the leading Crypto.
Bitcoin actually caught up to the ETH rally on Sunday evening and in a swift rally, touched $122,310, $900 shy of its all-time high record.
The failure to breach new highs has brought some profit taking, prompting a BTC analysis to see if this top has the potential to be a longer-term top or if there is still the potential for new all-time highs.
Cryptocurrencies have been getting a boost from growing doubts on the US Economy amid the imposition of the infamous Trump tariffs, and getting further support from accommodative US crypto policies.
A daily overlook on the Crypto Market
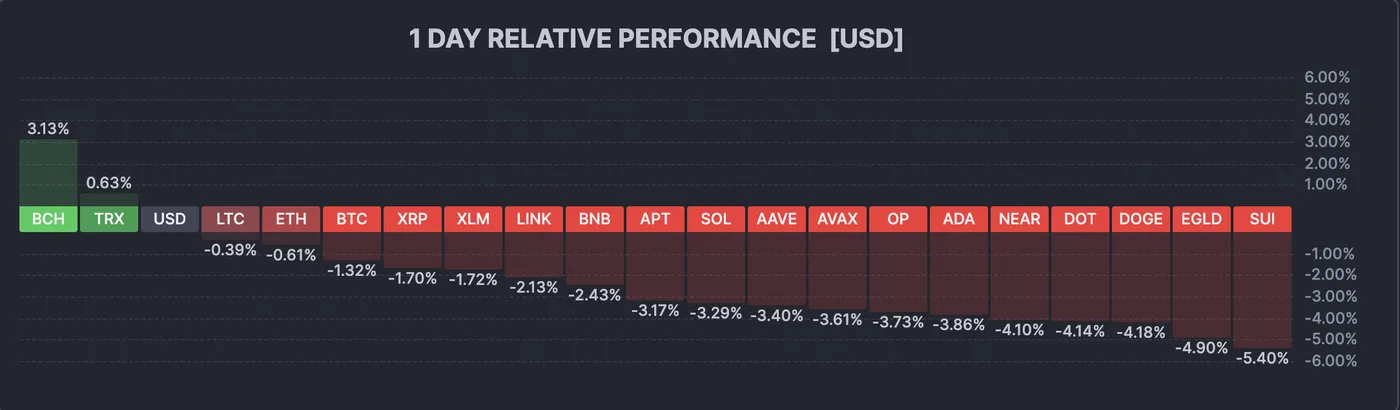
Crypto Daily Performance, August 11, 2025 – Source: Finviz
Some relatively strong profit taking is happening on altcoins but this doesn't seem to be as strong of a correction for Bitcoin and ETH which have been outshining their competitors.
As long as both ETH and BTC hold their current highs, the market shouldn't show any signs of concerns – but the relative strength of both relative to minor coins could be an interesting study for the upcoming cycle.
Bitcoin Multi-timeframe Technical Analysis
Bitcoin Daily Chart
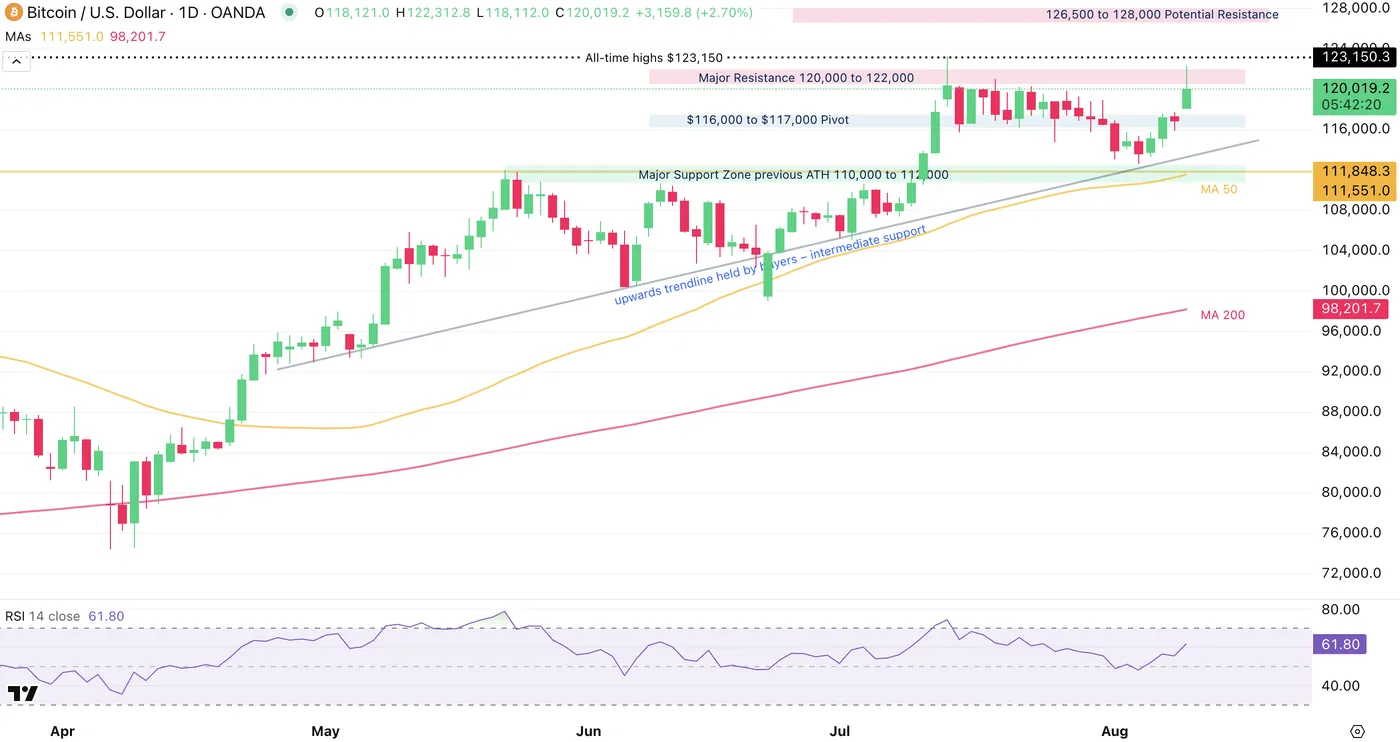
Bitcoin Daily Chart, August 11, 2025 – Source: TradingView
Looking at the daily picture, we see the Bitcoin establishing a range in the $113,000 to $120,000 range – Ranges close to the al-time highs are typically good signs for prolonged upward action.
However, today and tomorrow's daily candles will provide huge technical information on if a double top will emerge or not after the overnight session's higher wick.
As long as the lower bound of the range holds (further supported by the 110,000 to $112,00 support zone), Bitcoin still has a chance to mark new cycle all-time highs.
Bitcoin 4H Chart
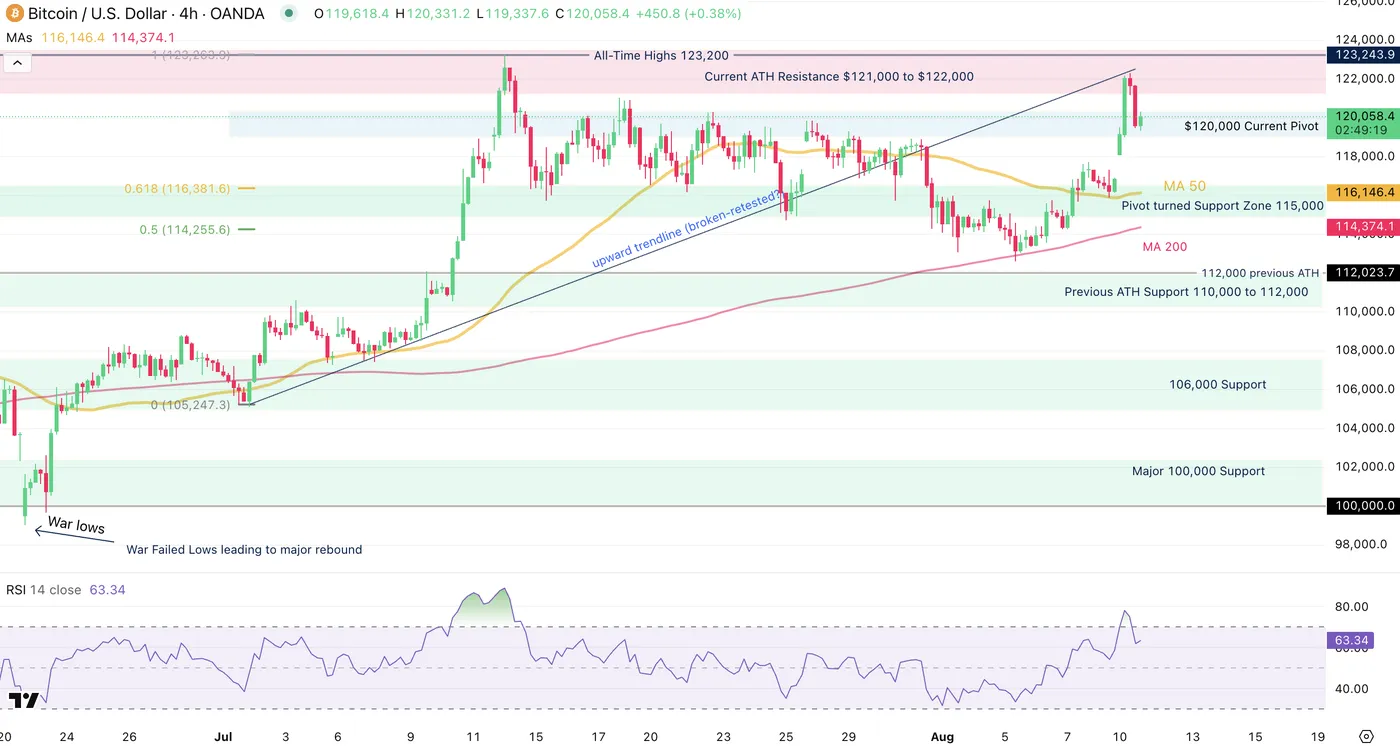
Bitcoin 4H Chart, August 11, 2025 – Source: TradingView
Looking closer, we see the most recent highs acting as a potential break-retest of the July upwards trendline.
Rejecting below the $115,000 Support would confirm a break-retest which would point towards the beginning of a worst-case scenario for Bitcoin as this would come with a failed double top and would indicate that buyers haven't had enough strength to even retest the previous ATH.
This scenario is for now still a bit far, therefore the rest is to see if Bitcoin holds around the 119,000 to 120,000 Pivot zone – Consolidating here gives it more chance to retest the ATH and potentially break higher
Key levels of interest for Bitcoin:
Resistance levels:
- All-time Highs to break 123,150
- Most recent highs 122,300
- Major Resistance 121,000 to 122,000
- 126,500 to 128,000 Potential Resistance
Support levels:
- Immediate Pivot Between $115 ,000 to $116,500 (Confluence with 4H MA 50)
- $113,000 Mini Support and weekend lows
- Major Support Zone previous ATH 110,000 to 112,000
Bitcoin 1H Chart
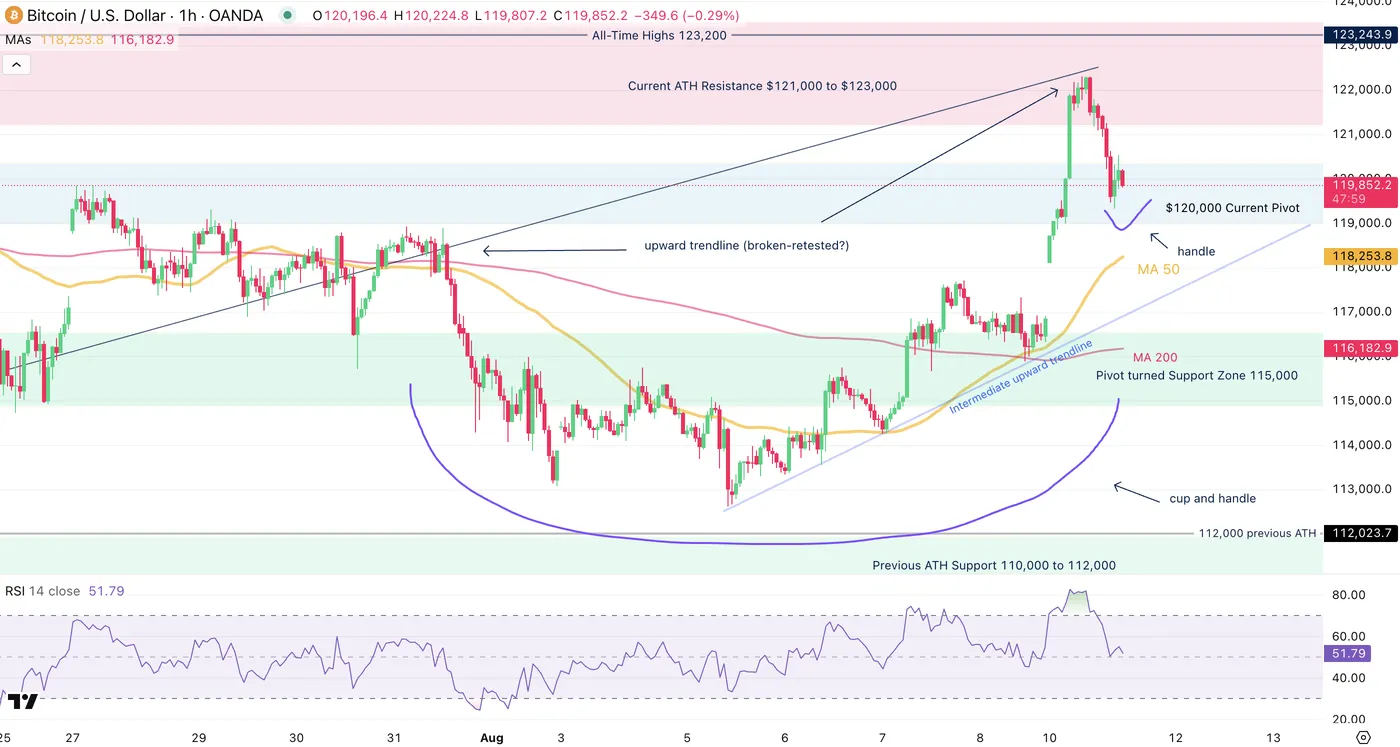
Bitcoin 1H Chart, August 11, 2025 – Source: TradingView
The action is still very balanced in the 1H Chart –
We spot more details of this morning's selloff rejecting the July upward trendline on a break-retest technical pattern, but with the 1H RSI back to neutral, it will be essential to see where players take the prices.
Tomorrow's US CPI will have sure implications for the upcoming price action and participants may no want to move their pawns too much before.
In the meantime, a cup and handle pattern is in the development. If buyers do trade on this technical setup, a measured-move rule of this pattern would point to $125,500 prices.
Tomorrow will be the key to the future price action.
Safe Trades!
EURGBP Wave Analysis
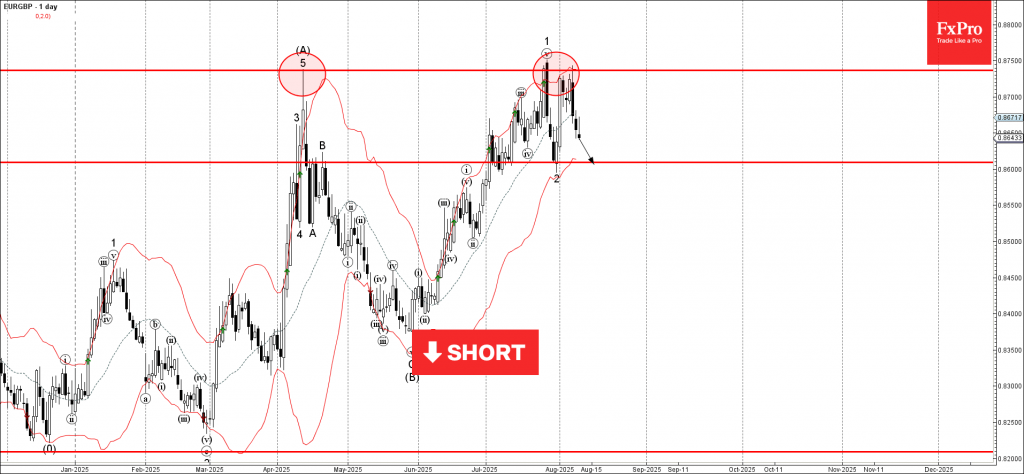
EURGBP: ⬇️ Sell
- EURGBP reversed from a strong resistance level 0.8735
- Likely to fall to support level 0.8600
EURGBP currency pair recently reversed down from the strong resistance level 0.8735 (which stopped all earlier sharp impulse waves from April), coinciding with the upper daily Bollinger Band.
The downward reversal from the resistance level 0.8735 created the daily Japanese candlesticks reversal pattern, Bearish Engulfing.
EURGBP currency pair can be expected to fall further to the next support level 0.8600, which stopped the earlier downward correction 2.