Sample Category Title
AUD/USD Daily Report
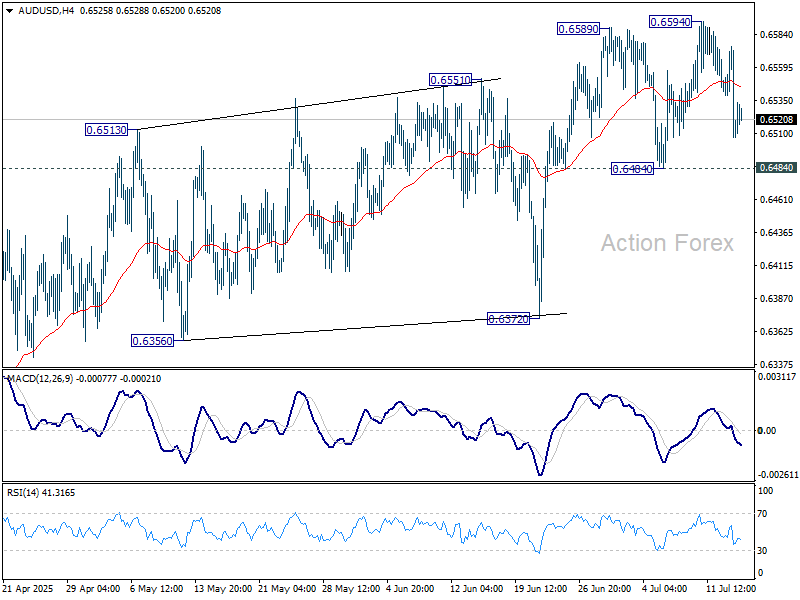
Daily Pivots: (S1) 0.6489; (P) 0.6533; (R1) 0.6557; More...
Range trading continues in AUD/USD and intraday bias stays neutral. Further rise is expected as long as 0.6484 support holds. Above 0.6594 will resume the rally from 0.5913 and target 0.6713 fibonacci level. However, firm break of 0.6484 will turn bias to the downside for 0.6372 support instead.
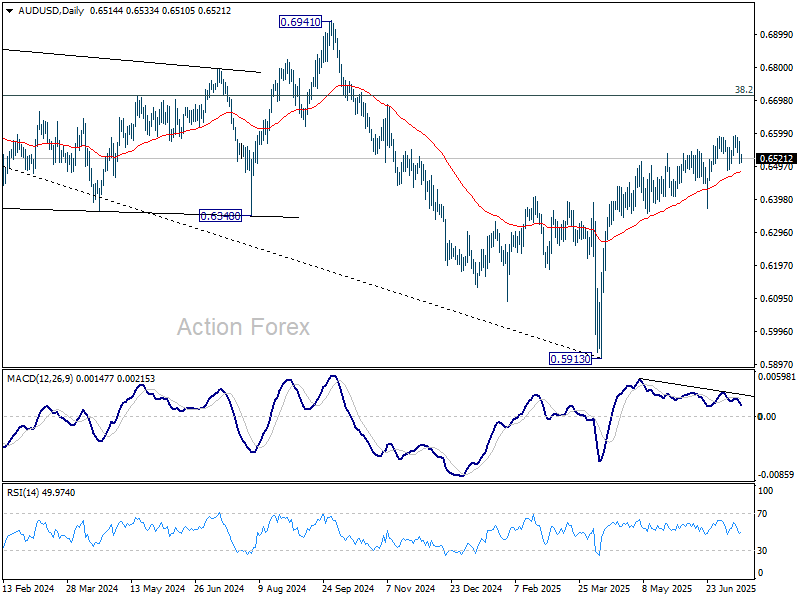
In the bigger picture, there is no clear sign that down trend from 0.8006 (2021 high) has completed. Rebound from 0.5913 is seen as a corrective move. While stronger rally cannot be ruled out, outlook will remain bearish as long as 38.2% retracement of 0.8006 to 0.5913 at 0.6713 holds. Nevertheless, considering bullish convergence condition in W MACD, even in case of another fall through 0.5913, downside should be contained above 0.5506 (2020 low).
USD/CAD Daily Outlook
Daily Pivots: (S1) 1.3687; (P) 1.3708; (R1) 1.3745; More...
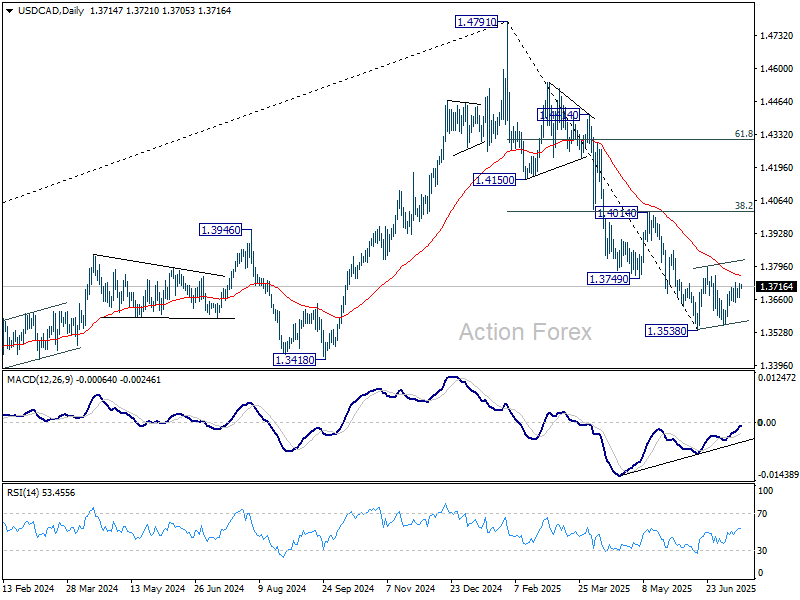
Intraday bias in USD/CAD stays neutral at this point. Overall, price actions from 1.3538 are seen as a corrective pattern, which is now in its third leg. Stronger rise could be seen and above 1.3728 will target 1.3797 resistance and probably above. On the downside, break of 1.3637 minor support will bring retest of 1.3538/55 support zone.
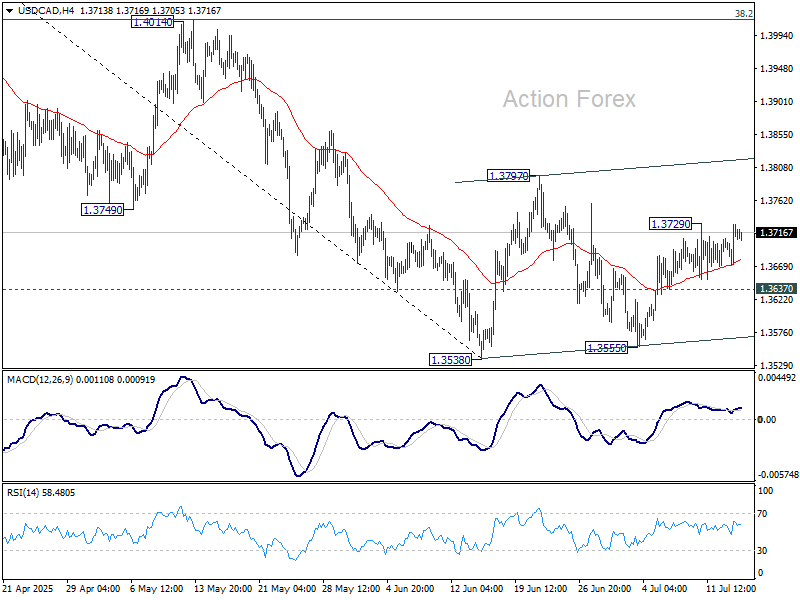
In the bigger picture, price actions from 1.4791 medium term top could either be a correction to rise from 1.2005 (2021 low), or trend reversal. In either case, further decline is expected as long as 1.4014 resistance holds. Next target is 61.8% retracement of 1.2005 (2021 low) to 1.4791 at 1.3069.
USD/JPY Daily Outlook
Daily Pivots: (S1) 147.93; (P) 148.47; (R1) 149.40; More...
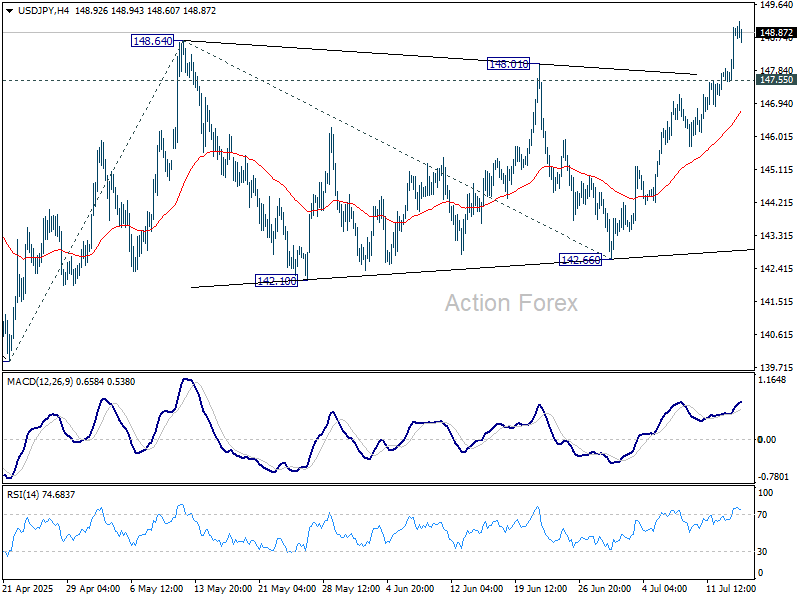
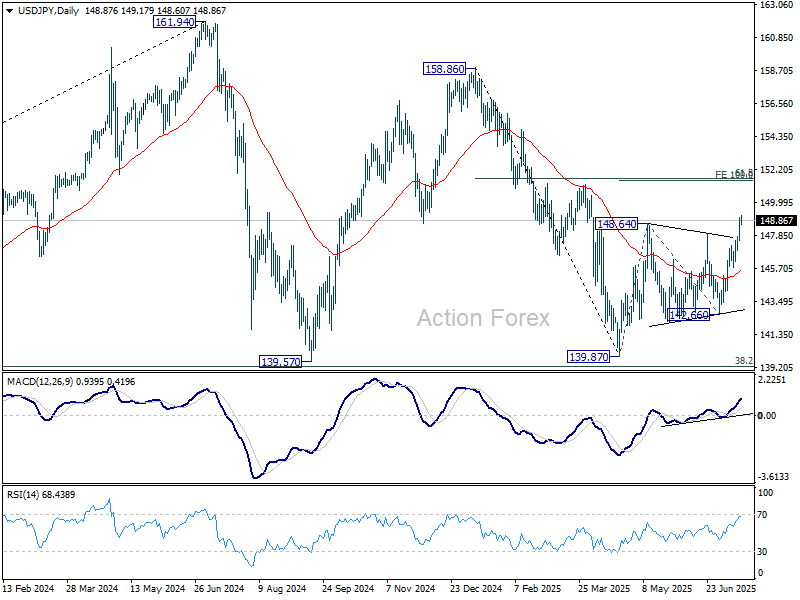
Intraday bias in USD/JPY remains on the upside at this point. Corrective pattern from 148.64 has completed with three waves to 142.66, and rise from 139.87 is resuming. Further rally should be seen to 100% projection of 139.87 to 148.64 from 142.66 at 151.43. That is close to 61.8% retracement of 158.86 to 139.87 at 151.22. On the downside, below 147.55 minor support turn intraday bias neutral again first.
In the bigger picture, price actions from 161.94 (2024 high) are seen as a corrective pattern to rise from 102.58 (2021 low). There is no clear sign that the pattern has completed yet. But still, strong support is expected from 38.2% retracement of 102.58 to 161.94 at 139.26 to bring rebound.
USD/CHF Daily Outlook
Daily Pivots: (S1) 0.7972; (P) 0.7998; (R1) 0.8043; More….
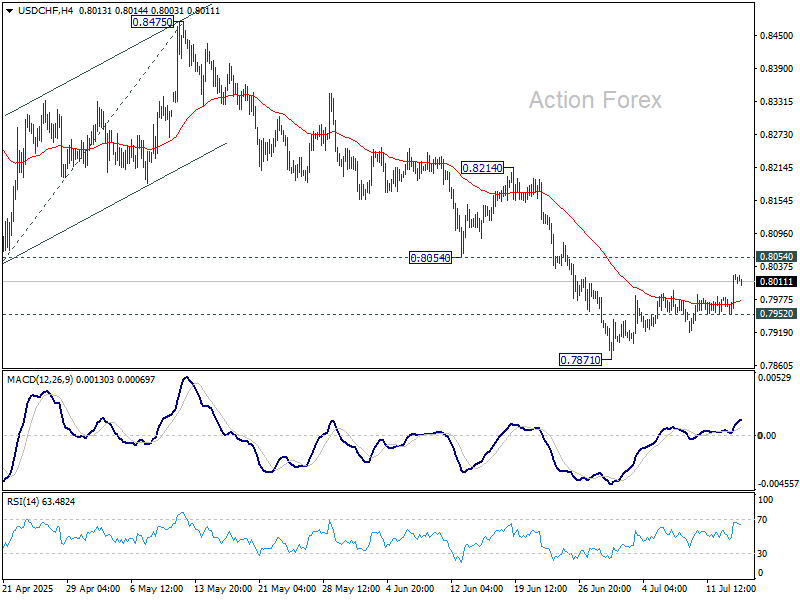
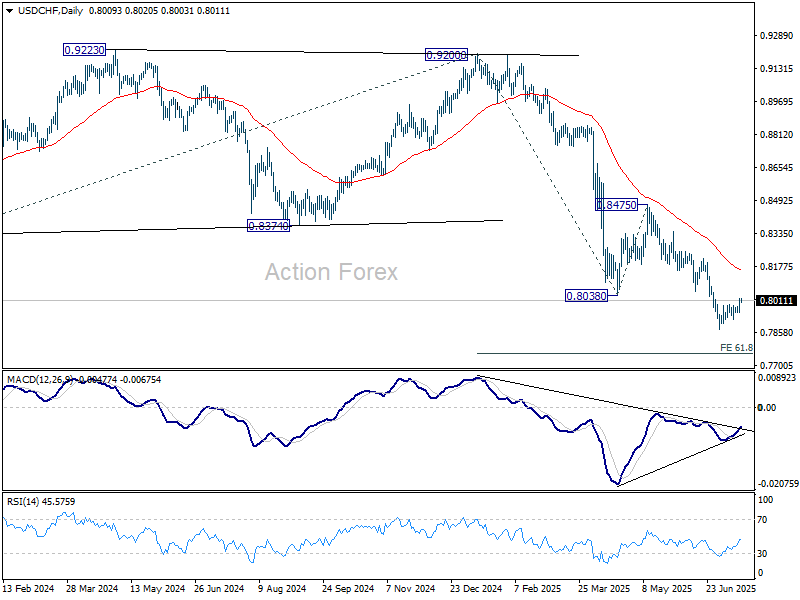
Intraday bias in USD/CHF remains neutral for the moment. Strong resistance is still expected from 0.8054 to complete the corrective pattern from 0.7871. Below 0.7952 will bring retest of 0.7871 first. Firm break there will extend the larger down trend to 61.8% projection of 0.9200 to 0.8038 from 0.8475 at 0.7757. However, decisive break of 0.8054 will bring stronger rebound to 55 D EMA (now at 0.8154) instead.
In the bigger picture, long term down trend from 1.0342 (2017 high) is still in progress. Next target is 100% projection of 1.0146 (2022 high) to 0.8332 from 0.9200 at 0.7382. In any case, outlook will stay bearish as long as 0.8475 resistance holds.
EUR/USD Daily Outlook
Daily Pivots: (S1) 1.1566; (P) 1.1630; (R1) 1.1666; More...
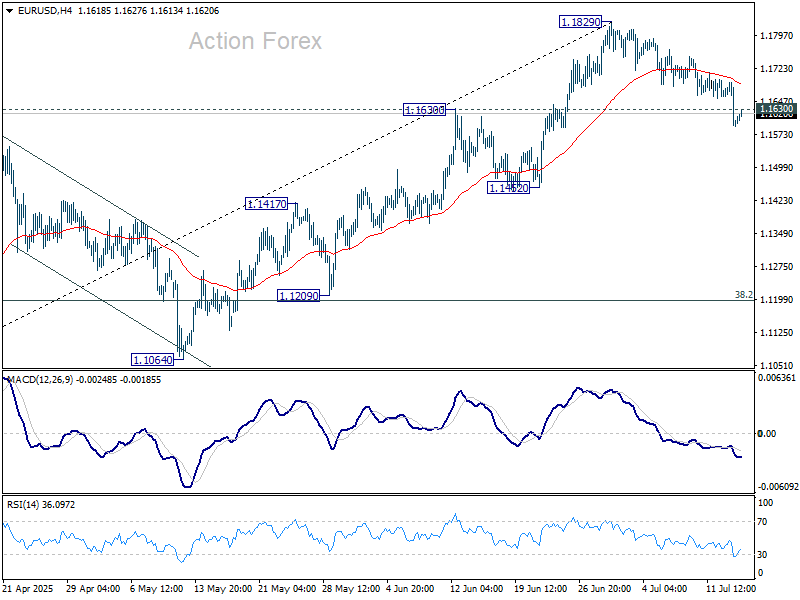
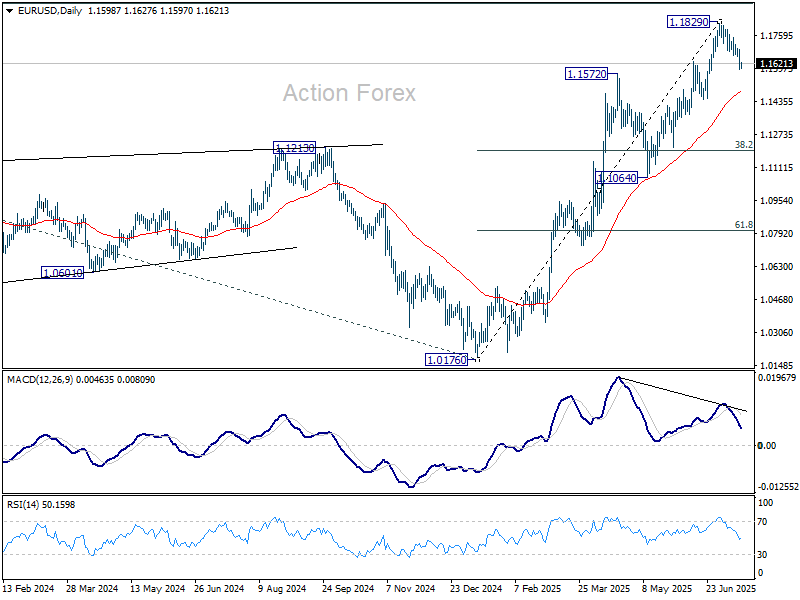
EUR/USD's break of 1.1630 support argues that rise from 1.1064 has completed at 1.1829. Fall from there is either correcting this rise or the whole rally from 1.0176. Intraday bias is now on the downside for 55 D EMA (now at 1.1478). Risk will stay on the downside as long as 1.1829 resistance holds, in case of recovery.
In the bigger picture, rise from 0.9534 long term bottom could be correcting the multi-decade downtrend or the start of a long term up trend. In either case, further rise should be seen to 100% projection of 0.9534 to 1.1274 from 1.0176 at 1.1916. This will remain the favored case as long as 1.1604 support holds.
UK Inflation Hits 3.6% Beating Forecasts, GBP Bid
The Bank of England has a new headache to deal with as headline inflation rose to 3.6%, its highest in over a year. The figure came in higher than the 3.4% which was economists expectations based on a Reuters poll.
Services price inflation, which the Bank of England sees as a better indicator of local price pressures than overall CPI, stayed at 4.7% in June, defying economists' expectations of a drop to 4.6%.
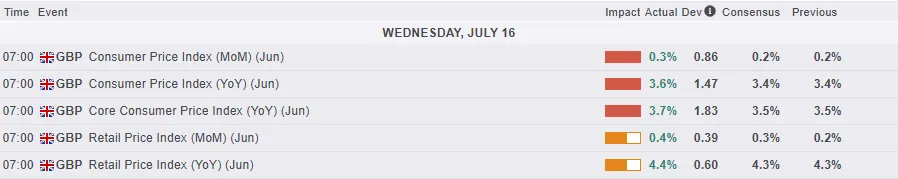
For all market-moving economic releases and events, see the MarketPulse Economic Calendar. (click to enlarge)
British inflation has been climbing since hitting a three-year low of 1.7% last September. In May, the Bank of England predicted it would peak at 3.7% this September, nearly double its 2% target.
The main driver of the increase from May to June was higher transport costs, especially motor fuel, according to the ONS. A rise in motor fuel echoes US inflation released yesterday and this could in part be down to the spike in Oil prices last month during the Israel-Iran conflict.
In April, inflation jumped sharply to 3.5%, driven by higher energy and water bills, a surge in airfares, and increased costs for labor-intensive services due to higher employment taxes and a rise in the minimum wage.
Labor Market Poses a Challenge as Growth Stalls
Governor Andrew Bailey said interest rates will likely keep falling slowly because a weaker job market is slowing wage growth, and the economy's growth outlook remains weak.
Chancellor Rachel Reeves shrugged off concerns around growth in the UK only yesterday as she told bankers she would slash red tape to help reboot the economy.
Some Bank of England policymakers worry that skill shortages in the UK job market and other supply issues will keep wages growing too quickly, making it hard for inflation to return to its target soon.
Important UK labor market data is coming on Thursday. If May's payroll drop of -109k isn’t revised and June shows more declines, the pound could come under renewed selling pressure.
Market Reaction
Chancellor Rachel Reeves responded to the unexpected rise in inflation to 3.6%, acknowledging that "working people are still struggling with the cost of living."
She highlighted steps already taken, like raising the national minimum wage for three million workers, introducing free breakfast clubs in all primary schools, and extending the £3 bus fare cap.
Reeves admitted "there’s more to do" but promised to stick to the Plan for Change to help people keep more money in their pockets.
Traders pare BoE easing bets after UK CPI, seeing 49 bps this year down from around 51 bps prior to the inflation release.
The British Pound did jump immediately after the data and it will be intriguing to see if the Pound can continue its advance in the European session.
GBP/USD has been under strain of late as the pair has posted 8 consecutive days of decline.
Having broken a crucial long-term ascending trendline and the growing macro challenges, the British Pound faces a fight to hold onto its impressive gains in 2025.
GBP/USD 15M Chart, July 16, 2025
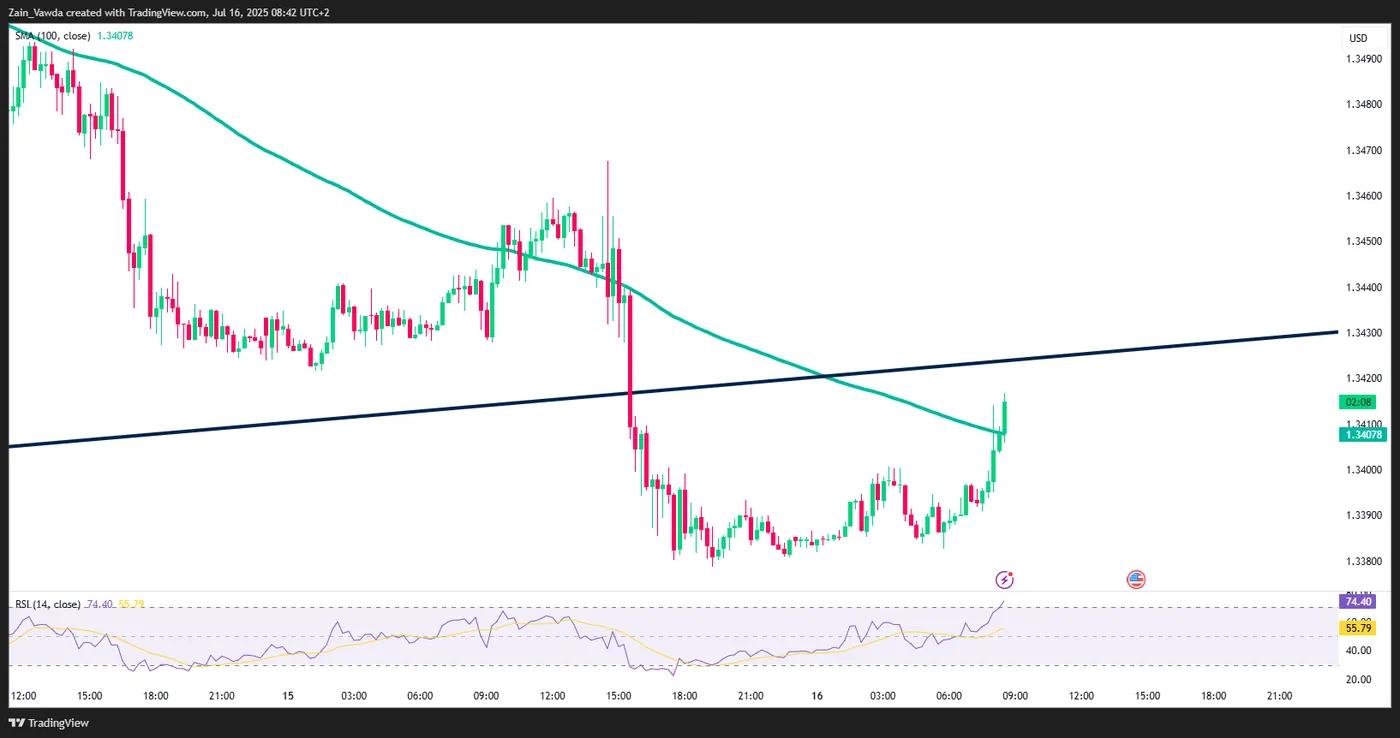
Source: TradingView.com
European Currencies Test Key Support Levels
European currencies have temporarily stabilised following a phase of downward correction, as markets await the release of key economic data. In the absence of new strong catalysts, the market has adopted a wait-and-see approach near critical support levels — 1.3400 for GBP/USD and 1.1600 for EUR/USD. Investors' attention is firmly focused on inflation figures, which may either support a resumption of recent bullish trends or serve as a trigger for a deeper correction.
Today, market participants are closely monitoring UK inflation data. In the coming trading sessions, investors are also expecting a batch of macroeconomic releases from the eurozone, including Italy’s CPI and trade balance figures — these could help define the short-term trajectory of the EUR/USD pair.
Amid uncertainty, investors continue to price in a potential correction in the US dollar. At the same time, the persistent divergence between the Federal Reserve and European regulators remains a key factor shaping the trend in major currency pairs.
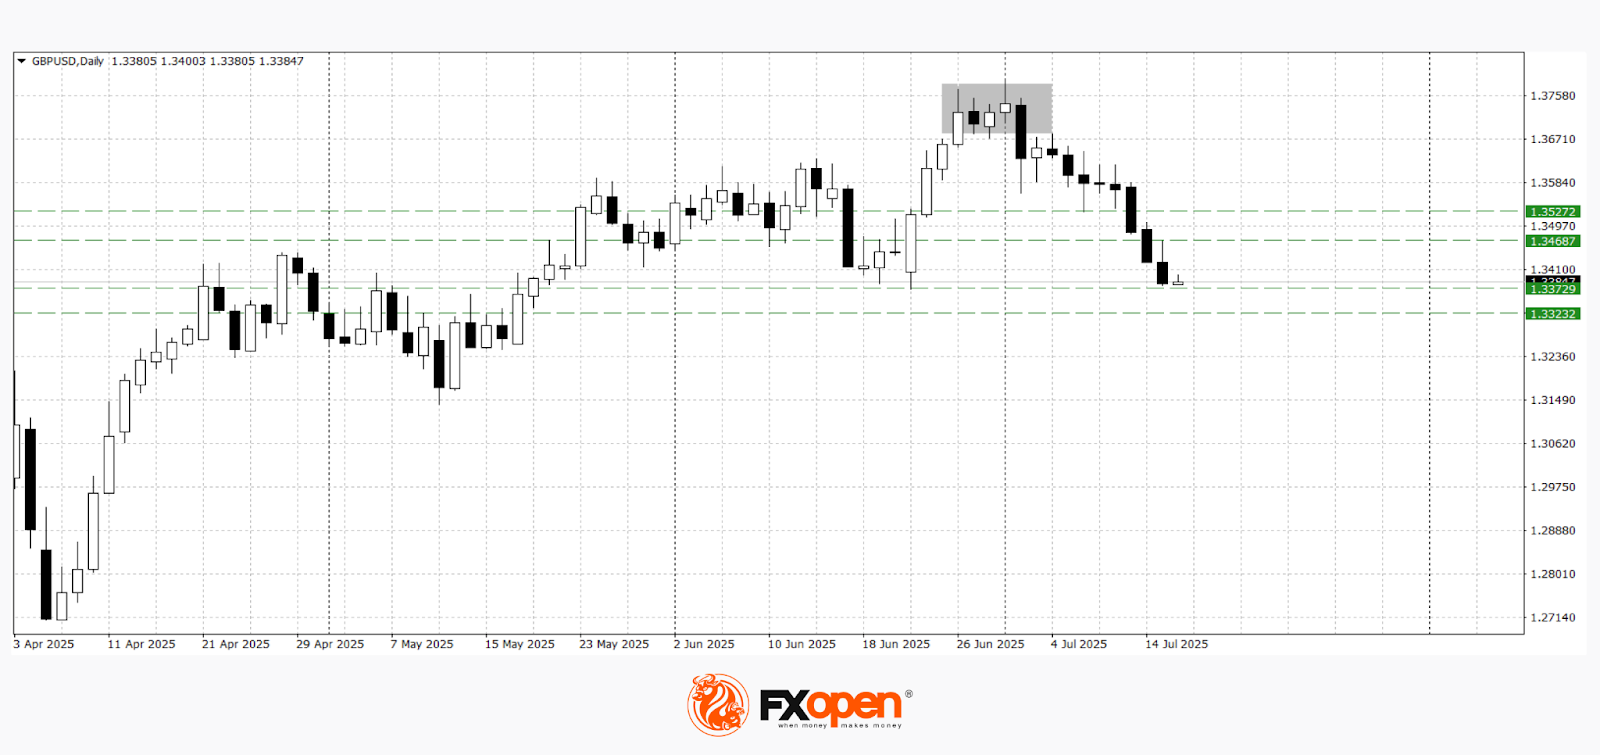
GBP/USD
The GBP/USD pair tested the important support level near 1.3400 yesterday. Technical analysis of GBP/USD suggests a continuation of the downward correction within the formation of a Tower pattern. Should there be a sharp rebound from the 1.3300–1.3340 zone, the price may return to the 1.3470–1.3500 range.
Upcoming events that could shift the direction of GBP/USD:
- Today at 09:00 (GMT+3): UK Consumer Price Index (CPI)
- Today at 11:30 (GMT+3): UK House Price Index
- Today at 15:30 (GMT+3): US Producer Price Index (PPI)
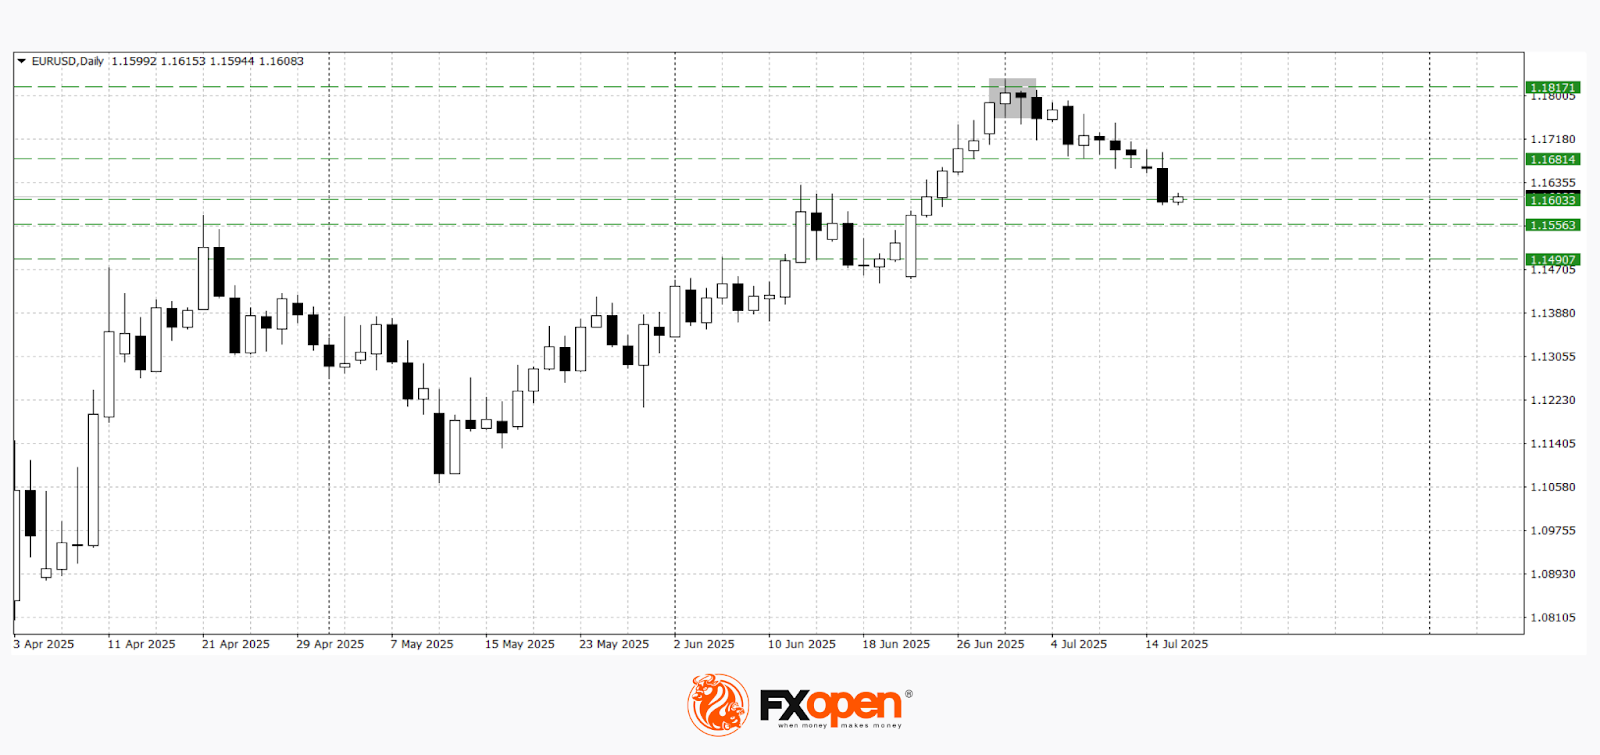
EUR/USD
The EUR/USD pair is currently holding above the 1.1500–1.1560 range. Its further movement will depend on macroeconomic data and the European Central Bank’s rhetoric. Technical analysis indicates the potential for a deeper downside correction as part of a Bearish Harami pattern. If buyers manage to defend the key support at 1.1600, the price could strengthen towards 1.1680–1.1700.
Upcoming events that could shift the direction of EUR/USD:
- Today at 12:00 (GMT+3): Eurozone Trade Balance
- Today at 17:00 (GMT+3): Speech by Michael S. Barr, Vice Chair for Supervision of the US Federal Reserve Board
- Tomorrow at 12:00 (GMT+3): Eurozone Consumer Price Index (CPI)
Trade over 50 forex markets 24 hours a day with FXOpen. Take advantage of low commissions, deep liquidity, and spreads from 0.0 pips. Open your FXOpen account now or learn more about trading forex with FXOpen.
This article represents the opinion of the Companies operating under the FXOpen brand only. It is not to be construed as an offer, solicitation, or recommendation with respect to products and services provided by the Companies operating under the FXOpen brand, nor is it to be considered financial advice.
Devil of Yesterday’s June US CPI Inflation Report in the Details
Markets
The devil of yesterday’s June US CPI inflation report was in the details. Headline and core CPI rose by 0.3% M/M and 0.2% M/M respectively to be up 2.7% Y/Y (from 2.4%) and 2.9% Y/Y (from 2.8%) respectively. Those outcomes were almost bang in line with consensus estimates, explaining the initial attempt to rally by US Treasuries. Details showed a relatively small increase in shelter prices (0.2% M/M) which carry the biggest weight in CPI calculations and play a less dominant role in PCE deflators to be published at the end of the month. Several goods categories like household furnishings, video and audio products and toy prices recorded monthly price rises ranging between +1% and +1.8% and do suggest some early pass-through of tariffs. Bearing in mind that the overall tariff level will rise after the August 1 deadline, it made investors rethink the Pavlov-reaction after the CPI report made initial headlines. Daily changes on the US yield curve ranged between +4.1 bps and +5.5 bps with the belly of the curve underperforming the wings. The US 30-yr yield closed above the psychological 5% mark for only the third time since the autumn of 2023. Technical resistance stands at 5.15% (YtD high) and 5.18% (2023 top) respectively. An (uncontrolled) sell-off in (core) bonds with very long tenors poses a significant threat to overall market stability especially once trading volumes thin early August. The implied Fed rate path for this year didn’t change that much, suggesting that the move was driven by a combination of higher inflation expectations and a higher Fed terminal rate. Dallas Fed president Logan overnight presented a base case in which monetary policy needs to hold tight for a while longer to bring inflation sustainably back to target. During this period, she believes that maximum employment can be sustained even with a modestly restrictive policy. Logan is ready to adapt her view fairly soon if a combination of softer inflation and a weakening labour market calls for it. Yesterday’s move in US Treasuries helped the dollar’s bottoming out process in FX space. EUR/USD closed at 1.1601 from a start at 1.1664. The trade-weighted greenback (DXY) rallied from 98.12 to 98.62 with the June high (99.47) being first resistance.
US president Trump overnight suggested that sectoral tariffs on pharmaceuticals and on semiconductors will likely be imposed as soon as the end of the month. He suggested a timeline which starts with a low tariff, given companies a year or so to react/move to the US before making it a very high tariff (for pharma; 200%?!). These sectoral levies will hurt European risk sentiment at the onset of trading. US producer price inflation are on tap this afternoon and risks adding to yesterday’s sell-off in US Treasuries. UK June inflation this morning rose more than expected for headline (3.6% Y/Y), core (3.7% Y/Y) and services inflation (4.7% Y/Y). Sterling in a first reaction fails to really profit in light of the recent repositioning on rather dovish comments by BoE governor Bailey (slack opening up in economy, labour market weakening, potential impact on BoE’s reaction function).
News & Views
In an appearance before European Parliament, Claudia Buch, head of the ECB’s Supervisory Board, indicated that the next ECB stress test will check the resilience of bank’s solvency for geopolitical risk scenarios. “In the 2026 thematic stress test exercise, we will follow up on this year’s stress test by asking banks to assess which firm-specific geopolitical risk scenarios could severely impact their solvency”. The ECB holds a so-called thematical stress tests every other year. The previous thematical test in 2024 was on cyber security. The exercise will come in the form of a so-called reverse stress test. In this procedure regulators will determine a specific outcome for the level of banks’ solvency, and then ask them to put in place scenario’s that might lead to hitting these levels.
US President Trump announced that the US reached a trade agreement with Indonesia. In this agreement, the US will impose a 19% tariff on imports from the country. The country earlier was threatened with a 32% levy from August 1st in one of the letters Trump sent to trading partners. In this respect Indonesia is the first country that succeeded to reduce the letter tariff with a trade agreement. According to the US President, Indonesia will erase all duties on Indonesian imports. Trump also said the country agreed to buy $19bn of US goods, including $15bn of US energy products and $4.5bn of US agricultural products. The county also committed to buying 50 Boeing jets. Trump suggested that another two or three trade deals would be made by the August 1st deadline, with India apparently in pole-position.
Chips and Banks
Yesterday’s US inflation data was… mixed. Headline CPI rose 0.3% month-on-month, exactly as expected, pushing the annual rate up to 2.7% from 2.4% in the prior month. But core inflation came in softer than anticipated, briefly lifting market sentiment. Since core inflation is what really guides Federal Reserve (Fed) decisions, the initial reaction leaned bullish. However, the relief didn’t last long. Signs of tariff-driven inflation are already starting to show, as some companies begin passing on higher costs to consumers. Bloomberg highlights that appliance prices jumped the most in five months, while toys, furniture, and sports equipment saw their steepest increases since 2021 and 2022, respectively.
Consequently, the market didn’t digest the US CPI report well. Treasury yields climbed across the curve: the 2-year yield—which reflects Fed policy expectations—rose to 3.95%, the 10-year yield reached 4.50%, and the 30-year yield hit 5.00%.
Japanese yields, one of the drivers of the global rise in sovereign yields, continue to edge higher. This morning, the 10-year JGB yield hit 1.60% for the first time since 2008, amid concerns about unsustainable fiscal spending. If the LDP retains its majority in Sunday’s Upper House elections, fears are that spending could accelerate further. The yen remains under pressure despite rising yields, with the USDJPY approaching the key 150 level.
Forget about a July cut
Fears of tariff-fueled inflation and the continued strength in labour market data are pushing expectations of Fed rate cuts further out. The Fed is not expected to cut rates at its meeting later this month—and may skip the September meeting as well. Fed funds futures currently assign only a 54% probability to a rate cut in September.
If inflation accelerates while jobs data remains solid, the Fed will likely stand pat. This shift in sentiment has helped the US dollar find a bid. The dollar index climbed past 98.50 yesterday. The net bearish speculative positioning appears stretched enough to allow for further upside in which case the USDJPY could break above 150 (depending also on the Japanese election), the EURUSD may fall toward the 1.12–1.15 range, and Cable could drift toward 1.3150–1.32. Still, the dollar remains in a medium-term downtrend and current strength is better seen as a correction rather than a reversal.
Chips and banks
Nvidia jumped 4% on Tuesday after reports that the White House will approve exports of its H20 chips to China—a logical policy pivot given the Chinese export ban had cost the company an estimated $10 billion in revenue. AMD rallied 6.4% on similar optimism.
ASML this morning reported stronger-than-expected Q2 results. Orders came in well above forecasts, fueled by AI demand. The company said full-year sales could be up ~15% from last year. The update may help support a recovery in ASML’s share price, which had lost nearly 50% between last July and April in Amsterdam.
BUT note that semiconductors could give some of the latest gains as Donald Trump freshly said that tariffs on pharmaceuticals could be effective from the end of this month and levies on semiconductors could follow soon...
Elsewhere, the first wave of US bank earnings surprised to the upside. JPMorgan, Citi, and Wells Fargo struck a confident tone, citing the resilience of consumers and businesses, and a still-solid labour market despite rising inflation expectations. Regulatory easing is also expected to free up capital.
Still, reactions were mixed. Wells Fargo fell over 5% after cutting its net interest income guidance. JPMorgan slipped 0.74% despite upbeat investment banking revenues. Citi jumped more than 3.5% to its highest level since 2008, helped by a new stock buyback program. Provided the first results and the market reaction, we could see consolidation in S&P500 financial stocks after a 24% rally since the April dip.
Oil falls, Uranium gains
US crude has been testing the 200-DMA to the upside despite news – earlier this week - that Saudi Arabia exported above its quotas last month in a rush to get its oil out of the Persian Gulf as Israel went to war with Iran (which by the way, was probably a one-off breach of the quota and doesn’t change the cartel’s plans to completely exit the 2.2mbpd restrictions and stop there). But yesterday’s API data – that showed 19 mio barrel build in US inventories last helped to push oil bulls to the sidelines and led to an almost 3% slide in US crude. Note that, the softer US dollar has been a supportive factor for oil prices (along with geopolitical tensions), and the ongoing recovery in USD and relatively softer Mid East tensions (at least slower headlines) could limit the upside potential near the 200-DMA and keep oil in the $65-68pb range until fresh direction.
Meanwhile, the Global X Uranium ETF just hit its highest level since 2013. The move reflects growing demand for energy infrastructure to power AI-driven data centers—some of which are now the size of small cities in the US. Against this backdrop, energy and cybersecurity investments remain compelling complements to portfolios anchored by AI heavyweights like Nvidia.
GBP/USD Daily Outlook
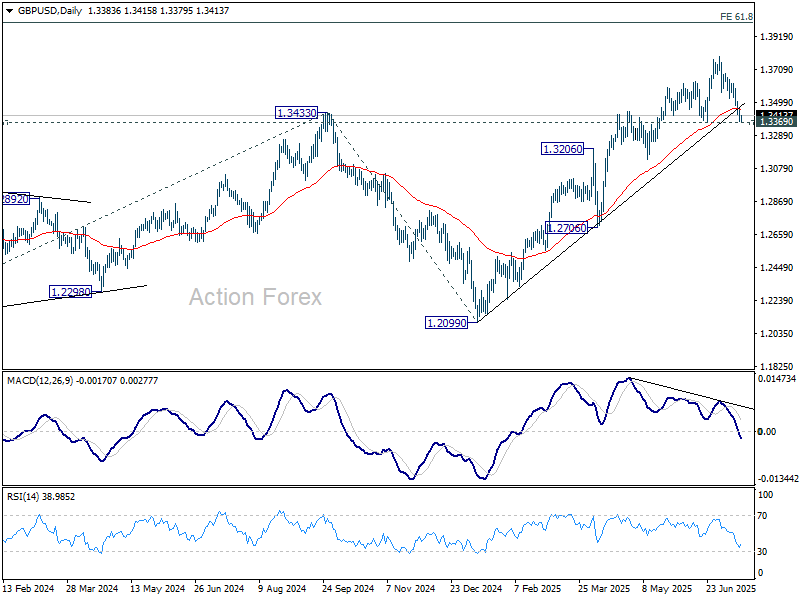
Daily Pivots: (S1) 1.3353; (P) 1.3410; (R1) 1.3442; More...
GBP/USD recovers mildly ahead of 1.3369 support and intraday bias remains neutral. Outlook is unchanged that strong support is expected from 1.3369 to complete the correction from 1.3787. On the upside, break of 1.3561 support turned resistance will bring retest of 1.3787 high first. Firm break there will resume larger up trend to 100% projection of 1.2099 to 1.3206 from 1.3138 at 1.3813. However, sustained break of 1.3369 will bring deeper correction back to 1.2706/3206 support zone.
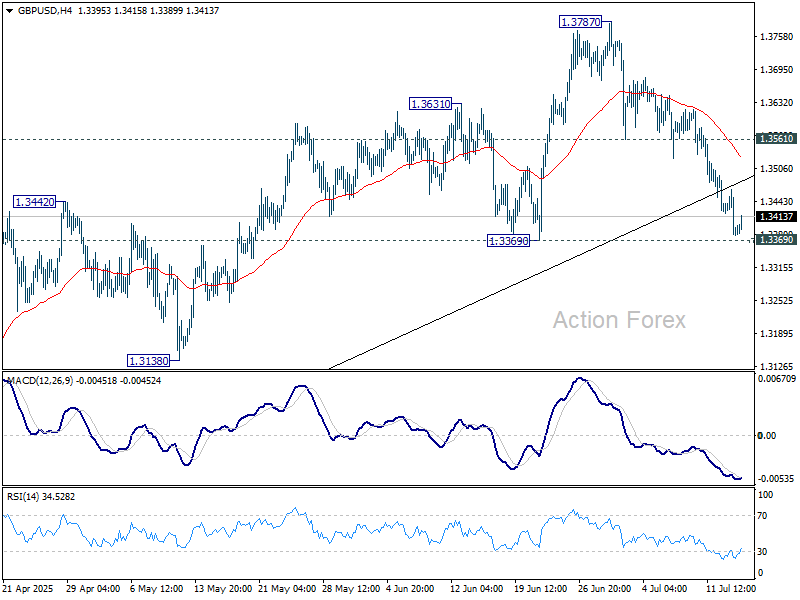
In the bigger picture, up trend from 1.3051 (2022 low) is in progress. Next medium term target is 61.8% projection of 1.0351 to 1.3433 from 1.2099 at 1.4004. Outlook will now stay bullish as long as 55 W EMA (now at 1.3019) holds, even in case of deep pullback.