
Sample Category Title
Gold’s (XAU/USD) Next Move: Awaiting Catalyst Amidst Choppy Markets and Strong US Dollar
Gold prices remain choppy with yesterday's post CPI decline limited as the precious metal found support around the 3320 handle.
The precious metal has continued its recovery today as it eyes a return to the 3350 handle which had held as a key area of support on Monday. For now though, price is choppy and it would appear that the precious metal is in desperate need of a catalyst to facilitate its next move.
US Dollar Enjoys Best Day in a Month
Gold prices faced selling pressure yesterday as the US Dollar enjoyed its best day in a month.The lack of geopolitical risk of late means that the precious metal may once again be more susceptible to US Dollar moves in the near future.
Gold prices had been running more on safe haven appeal this year, although US dollar weakness did aid its rally. However there have been times where Gold shrugged off US Dollar strength and continued to rise due to rising geopolitical risks.
The US Dollar could continue to strengthen in the months ahead as tariff impacts will finally be felt across the globe as the August deadline approaches. The full impact of tariffs on inflation will become clearer over the next three months. Should inflation continue to rise moving forward, it will be harder for markets to justify expecting a rate cut in September unless job data takes a sharp downturn.
US PPI Data and Fed Speakers Up Next
Today’s PPI data will shed more light on the inflation picture, and any surprises could move markets. However, expectations are set for a modest 0.2% month-on-month increase in both headline and core PPI.
Investors will also look to the Fed's Beige Book, out tonight, for insights into regional inflation and economic trends. Additionally, several Fed officials such as Lorie Logan, Thomas Barkin, Beth Hammack, Raphael Bostic, and John Williams are scheduled to speak today.
With the Fed's blackout period starting on July 19, these could be the last comments before then. However, yesterday’s data likely hasn’t shifted their policy stance toward a more dovish approach.
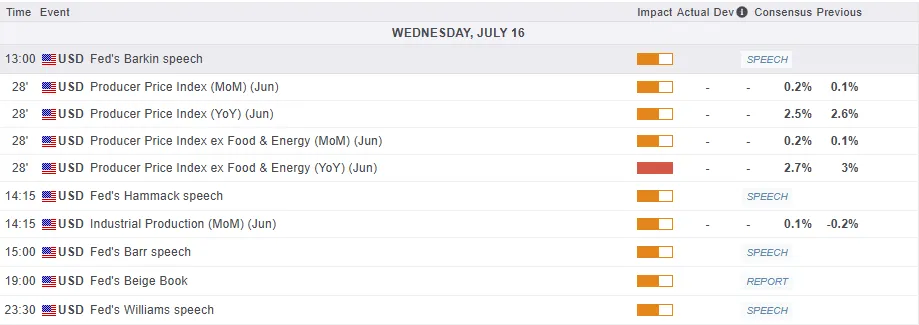
For all market-moving economic releases and events, see the MarketPulse Economic Calendar. (click to enlarge)
For now, any moves may remain short-lived and thus the need for a fresh catalyst to aid Gold prices in finding some direction. In the absence of a major catalyst, Gold prices could remain choppy and rangebound.
Technical Analysis - Gold (XAU/USD)
From a technical standpoint, Gold has been stuck in a period of consolidation since printing all-time highs around $3500/oz.
As you can see on the chart below, price action has been choppy since with higher highs followed by lower lows rather than lower highs as you would see in trending markets.
There is a triangle pattern which is in play and Gold is not too far away from the lower trendline of the triangle pattern.
Should Gold prices hold above the lower trendline of the triangle pattern, a move higher may be in offing. A break of the triangle pattern to the upside could set Gold up for a potential $380 move to the upside with potential targets around the $3800/oz mark.
For now though immediate support is provided by the 50-day SMA which rests at 3323 before the swing low at 3301 comes into focus. Below that we have further support areas around 3275 and 3218 respectively.
Looking at the upside, immediate resistance may be found at 3350 before the 3375 and 3400 handles come into focus.
Gold (XAU/USD) Daily Chart, July 16, 2025
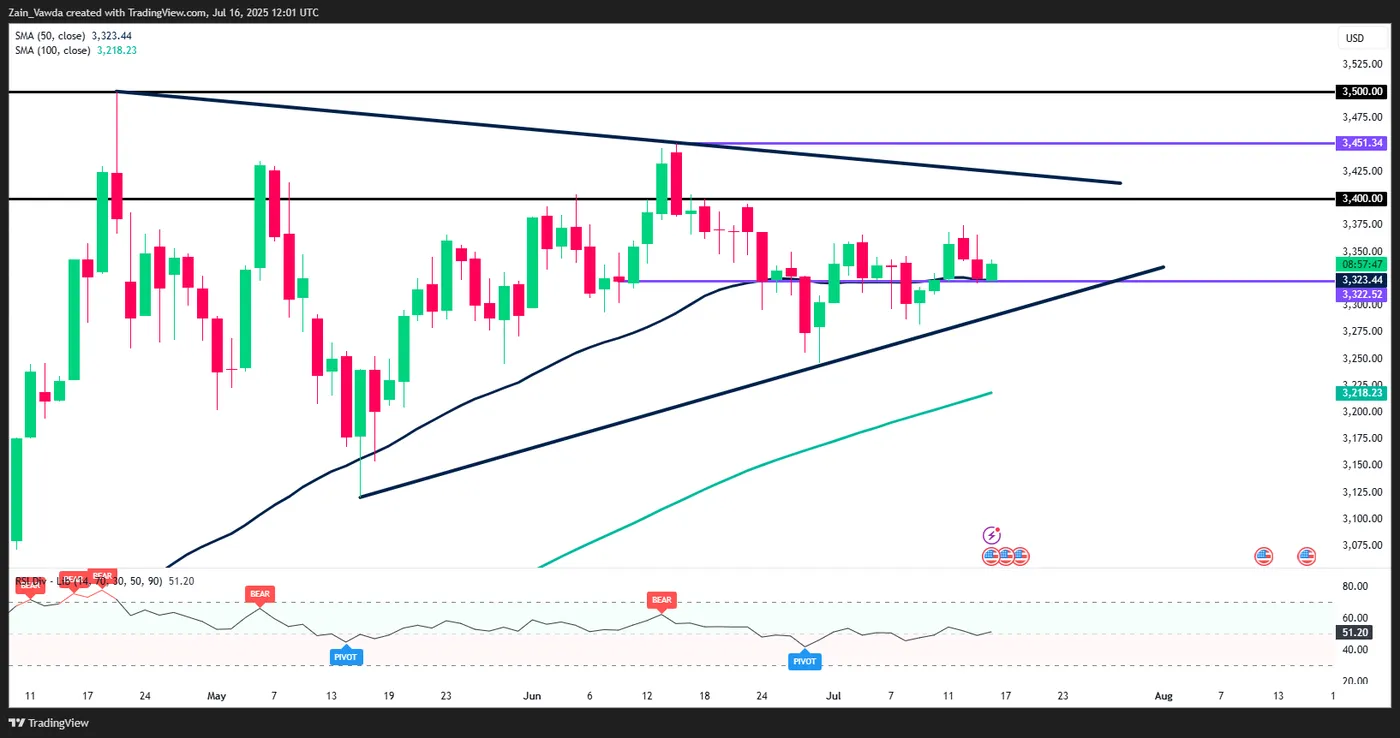
Source: TradingView (click to enlarge)
Client Sentiment Data - XAU/USD
Looking at OANDA client sentiment data and market participants are long on Gold with 62% of traders net-long. I prefer to take a contrarian view toward crowd sentiment and thus the fact that so many traders are long means Gold prices could decline in the near-term.
Sunset Market Commentary
Markets
US PPI inflation was on tap today. All three gauges stagnated last month, printing flat on a monthly basis and missing a 0.2% estimate. That led to a below-consensus outcome as well with the headline figure rising by 2.3%, PPI ex food and energy by 2.6% and the series additionally stripping trade by 2.5%. A pretty material upward revision to the May readings (from 0.1% to 0.3% or 0.4%) compensated for the overall June miss but that’s not really of markets’ concern, not least because PPI was down in April and even in March. In yesterday’s CPI, services prices (and shelter in particular) weighed down on the headline numbers. PPIs today bring a similar story. Overall services PPI dropped 0.1% m/m with low readings particularly in transport and warehousing (reduced import activity?!). Goods prices ex food and energy rose 0.3%. Anyway, US Treasuries are taking comfort with yields down a few basis points on the day after the release. The curve flattens with net daily changes varying between -0.4 and -3 bps. European yields grinded lower throughout the day, showing losses of 1-3 bps. UK gilts underperform in the wake of this morning’s higher than expected CPI print. It’s tying the hands of the Bank of England (sticking to a quarterly cutting pace) even though the economy is visibly weakening. Offering help from the fiscal side of the equation is out of the question given the precarious state of UK public finances and the markets’ focus on the matter. And yet, this morning’s temporary jump in the 30-yr tenor to above 5.5% suggests some investors are not completely ruling it out. European stock markets opened in the red after president Trump’s new tariff salvo vs pharmaceuticals and semiconductors but are gradually recovering. It’s worth mentioning that according to Bloomberg’s contacts France and a growing number of EU member states is leading a push for the EU to use its anti-coercion instrument against the US if both parties don’t reach an agreement before the 30% tariffs kick in after the August 1 deadline lapses. That, or even just the rumours, could add more fuel to the trade fire. Bumper earnings from a couple of big US financial companies helped Wall Street into a green open.
Most major currencies are treading water. EUR/USD sought to recover after yesterday’s dip towards 1.16 but that lacked strength. 1.16 is still being tested as we write. Sterling only marginally benefits from today’s gilt underperformance, suggesting it is risk premia supporting UK yields (relative to core peers). EUR/GBP copy pasted the EUR/USD intraday moves with the pair currently hovering slightly below opening levels (0.866). JPY is having a minor lead over most G10 peers but it does little to offset the slide over the last few weeks (especially against the euro).
News & Views
Hungarian full-time employees’ average gross earnings were 7.8% higher than a year earlier in May 2025 (HUF 702 800). Average net earnings were up 7.7% Y/Y (HUF 483 000). Corrected for inflation, real earnings were up by 3.2% Y/Y. Median gross earnings were HUF 562 300, and median net earnings were HUF 391 200, surpassing the value for the same period of the previous year by 7.9% and 8.2% respectively. The pace of May wage growth was below the one recorded in April (9.8% Y/Y), below consensus (8.6% Y/Y) and the second slowest since mid-2021. For now, slowing wage growth (and the risk of weaker consumer spending) won’t alter the status quo at the Hungarian national bank which meets next week and is widely expected to keep its policy rate unchanged at 6.5%.
Czech industrial producer prices fell by 0.2% M/M in June (-0.7% Y/Y), mainly due to lower energy and chemical product prices. However, food-related prices showed some increases. Agricultural producer prices slightly declining by 0.1% M/M but rising significantly by 13.4% Y/Y driven by higher prices in both crop and animal production. Construction work prices dropped by 0.3% M/M but increased by 2.9% Y/Y, with a modest rise in material costs. Service producer prices in the business sector also fell slightly by 0.1% M/M but grew by 4.2% Y/Y, particularly in advertising, IT, and security services. In the EU, industrial producer prices decreased by 0.6% M/M in May 2025 but rose by 0.4% Y/Y.
EUR/USD Mid-Day Outlook
Daily Pivots: (S1) 1.1566; (P) 1.1630; (R1) 1.1666; More...
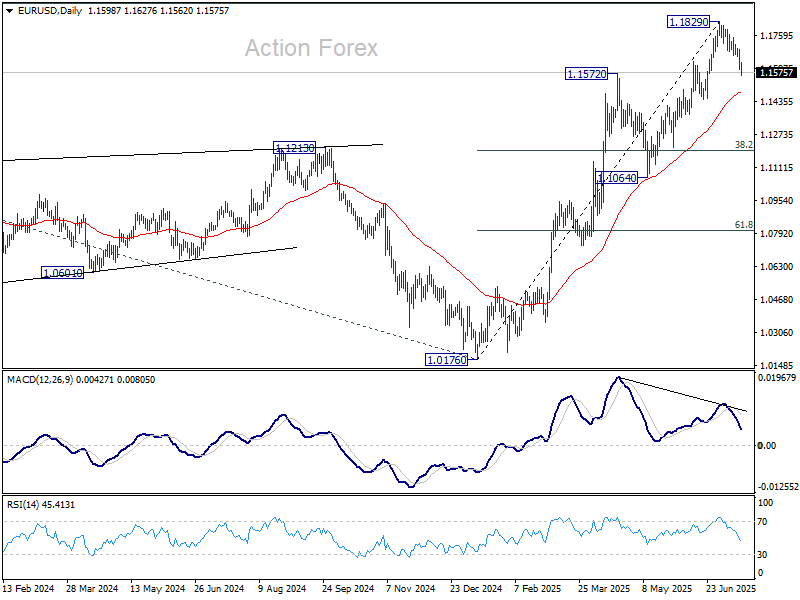
Intraday bias in EUR/USD stays on the downside at this point. Fall from 1.1829 short term top is correcting the rise from 1.1829 or whole rally from 1.0176. In either case, deeper fall would be seen to 55 D EMA (now at 1.1478). Sustained break there will target 38.2% retracement of 1.0176 to 1.1829 at 1.1198. On the upside, above 1.1691 minor resistance will turn intraday bias neutral first.
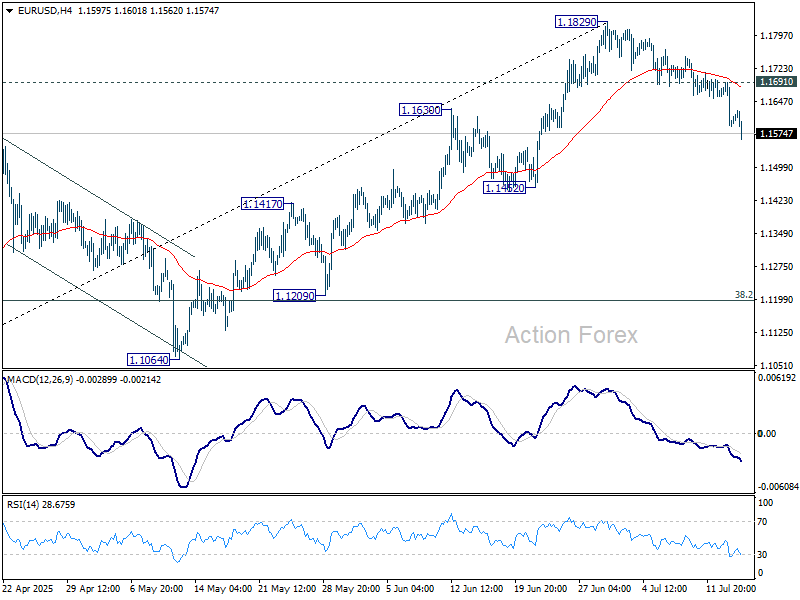
In the bigger picture, rise from 0.9534 long term bottom could be correcting the multi-decade downtrend or the start of a long term up trend. In either case, further rise should be seen to 100% projection of 0.9534 to 1.1274 from 1.0176 at 1.1916. This will remain the favored case as long as 1.1604 support holds.
GBP/USD Mid-Day Outlook
Daily Pivots: (S1) 1.3353; (P) 1.3410; (R1) 1.3442; More...
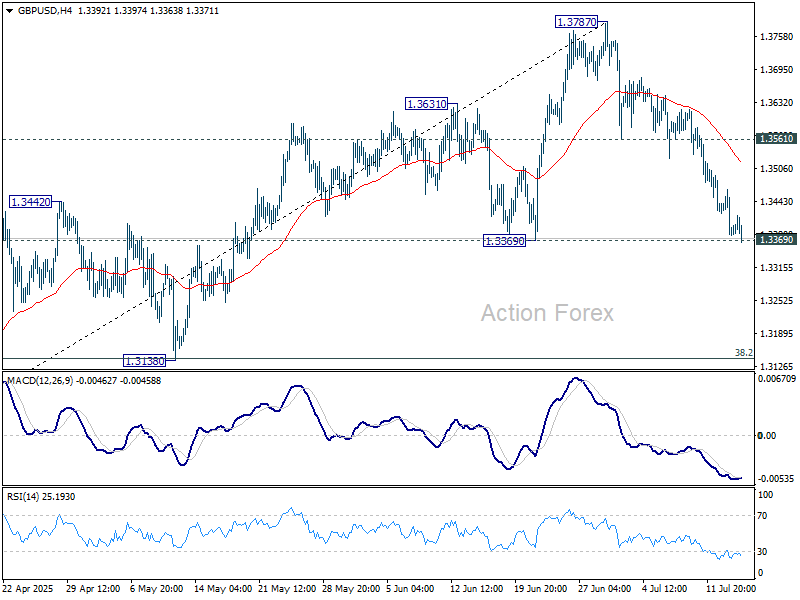
Immediate focus is now on 1.3369 as GBP/USD fall from 1.3787 extends. Decisive break there will suggests that deeper correction is underway. Intraday bias will be back on the downside for 1.3138 cluster support (38.2% retracement of 1.2099 to 1.3787 at 1.3142). On the upside though, break of 1.3561 support turned resistance will bring retest of 1.3787 high first.
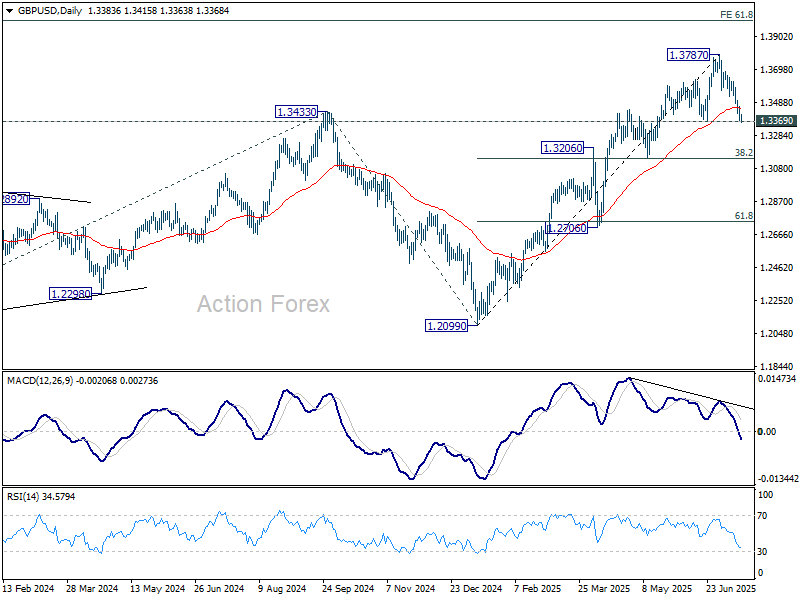
In the bigger picture, up trend from 1.3051 (2022 low) is in progress. Next medium term target is 61.8% projection of 1.0351 to 1.3433 from 1.2099 at 1.4004. Outlook will now stay bullish as long as 55 W EMA (now at 1.3019) holds, even in case of deep pullback.
USD/CHF Mid-Day Outlook
Daily Pivots: (S1) 0.7972; (P) 0.7998; (R1) 0.8043; More….
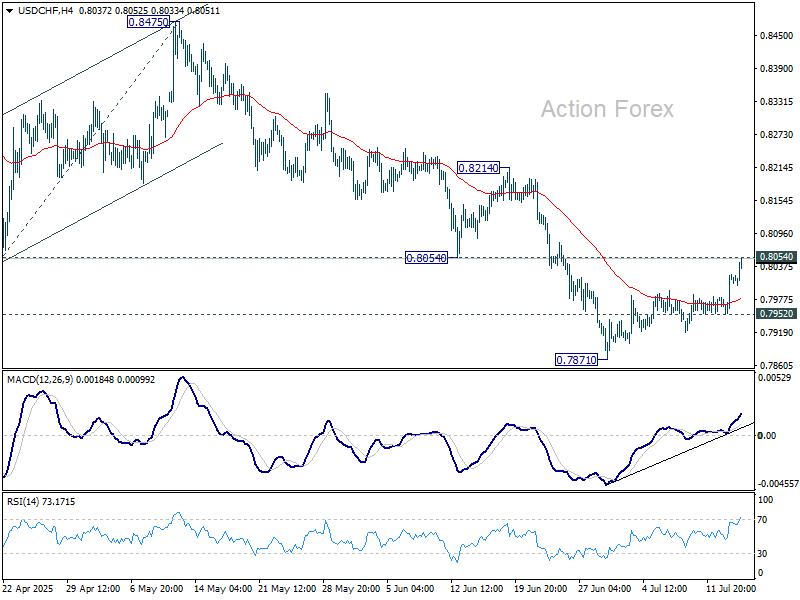
Intraday bias in USD/CHF stays neutral first. Strong resistance could still be seen from 0.8054 to complete the corrective bounce from 0.7871. Below 0.7952 will bring retest of 0.7871 first. Firm break there will extend the larger down trend. However, decisive break of 0.8054 will bring stronger rebound to 55 D EMA (now at 0.8154) instead.
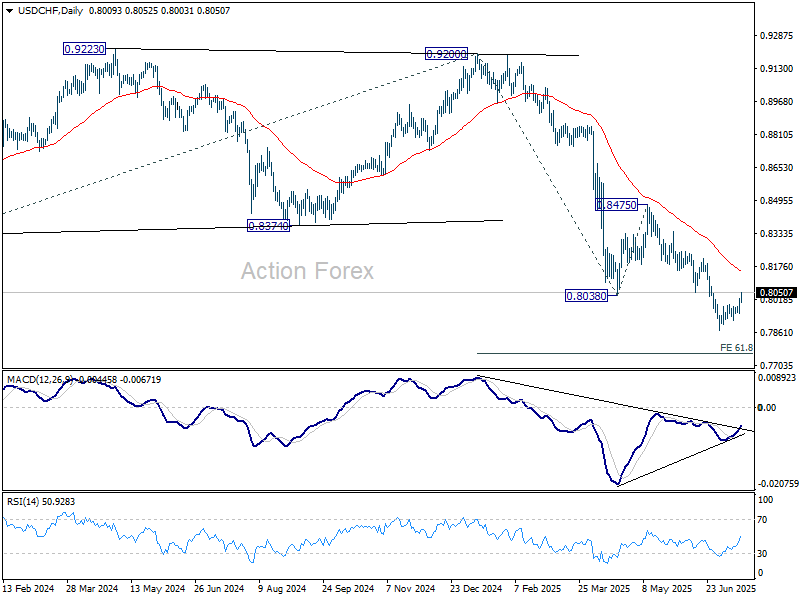
In the bigger picture, long term down trend from 1.0342 (2017 high) is still in progress. Next target is 100% projection of 1.0146 (2022 high) to 0.8332 from 0.9200 at 0.7382. In any case, outlook will stay bearish as long as 0.8475 resistance holds.
USD/JPY Mid-Day Outlook
Daily Pivots: (S1) 147.93; (P) 148.47; (R1) 149.40; More...
USD/JPY retreats mildly but stays above 147.55 minor support. Intraday bias remains mildly on the upside. Rise from 139.87 is resuming and should target 100% projection of 139.87 to 148.64 from 142.66 at 151.43. That is close to 61.8% retracement of 158.86 to 139.87 at 151.22. On the downside, below 147.55 minor support turn intraday bias neutral again first.
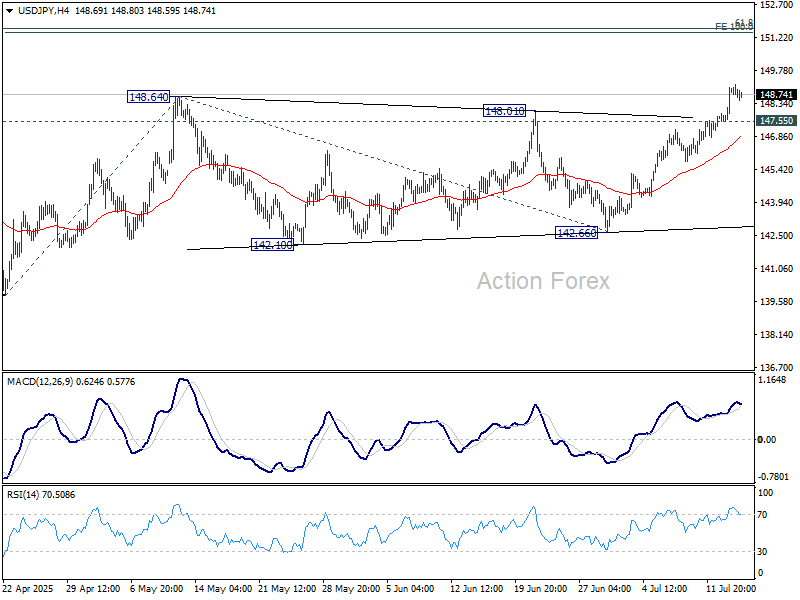
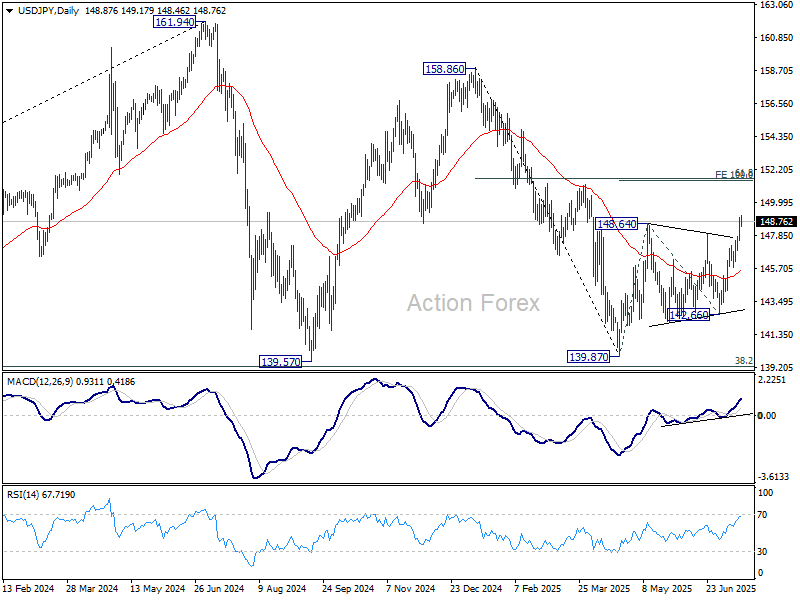
In the bigger picture, price actions from 161.94 (2024 high) are seen as a corrective pattern to rise from 102.58 (2021 low). There is no clear sign that the pattern has completed yet. But still, strong support is expected from 38.2% retracement of 102.58 to 161.94 at 139.26 to bring rebound.
Calm FX Session Sees Franc Slips, Yen Recovers
Forex markets are trading with a relatively subdued tone as the US session gets underway, with limited broad-based momentum among major currencies. The most notable move is a selloff in the Swiss Franc, which appears largely technical, led by a bullish bounce in EUR/CHF.
Meanwhile, Yen is seeing a modest recovery, likely driven by profit-taking after its extended weakness since the start of July. Traders appear reluctant to press shorts further ahead of this weekend’s upper house elections in Japan, which could trigger new fiscal policy shifts and JGB volatility in the days ahead.
Dollar is slightly firmer despite today’s softer-than-expected PPI release. Markets are not placing too much emphasis on the inflation miss, as the dominant driver remains the looming August 1 tariff deadline. Until there is clarity on whether new trade deals are reached or further levies imposed, Dollar positioning is likely to stay cautious.
Sterling is holding its ground near the top of the G10 board after today's upside surprise in UK inflation. Though the reaction has been modest. Attention now turns to the UK labor market report tomorrow, which could help determine whether August’s rate cut odds remain intact.
For the week so far, Dollar leads the major currencies, followed by Loonie and Sterling. At the bottom are Kiwi and Aussie, with Swiss Franc also under pressure. Euro and Yen are treading in the middle.
Technically, EUR/CHF's break of 55 4H EMA offers tentative sign of bottoming at 0.9292, after breaching 0.9296 support briefly. Focus is back on 0.9365 resistance. Break there will argue that corrective pattern from 0.9445 has completed, and the rebound from 0.9218 low is ready to resume.

In Europe, at the time of writing, FTSE is up 0.29%. DAX is up 0.52%. CAC is up 0.02%. UK 10-year yield is down -0.002 at 4.628. Germany 10-year yield is down -0.012 at 2.698. Earlier in Asia, Nikkei fell -0.04%. Hong Kong HSI fell -0.29%. China Shanghai SSE fell -0.03%. Singapore Strait Times rose 0.30%.
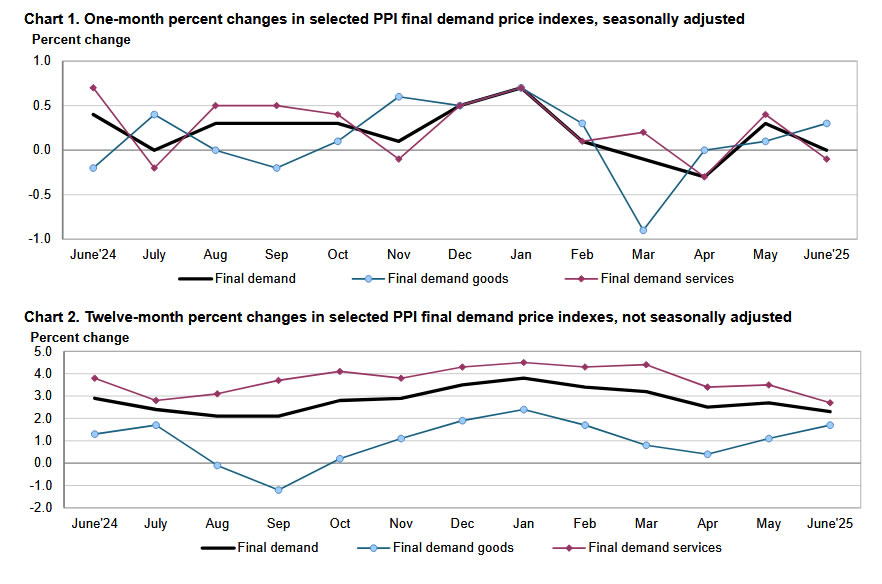
US PPI flat in June, misses forecasts
US producer prices were flat in June, falling short of expectations for a 0.3% mom rise. While a 0.3% mom increase in goods prices provided some support, a -0.1% mom dip in services prices offset the gain. PPI excluding food, energy, and trade services was unchanged on the month too.
On an annual basis, headline PPI slowed to 2.3% yoy from 2.6% yoy, also below forecasts 2.5% yoy. The more stable core measure still rose 2.5% year-on-year.
Eurozone exports rise 0.9% yoy in May while imports fall -0.6% yoy
Eurozone goods exports rose 0.9% yoy in May to EUR 242.6B, outpacing a -0.6% yoy drop in imports to EUR 226.5B, leading to a trade surplus of EUR 16.2B. Intra-Eurozone trade also grew 1.4% yoy to EUR 219.1B, indicating resilient domestic supply chains within the bloc.
For the broader European Union, exports rose just 0.1% yoy while imports fell -2.0% yoy, producing a EUR 13.1B surplus. Bilateral data shows continued divergence: EU exports to the US rose 4.4% yoy while imports from the U.S. fell -7.4%. Exports to China dropped -11.2% yoy, while imports from China rose 3.4%. EU-UK trade data showed a 2.5% yoy increase in exports and a -7.1% drop in imports.
UK CPI rises to 3.6%, goods prices jump, services sticky
UK inflation came in hotter than expected in June. Headline CPI accelerated from 3.4% yoy to 3.6% yoy, above consensus of 3.4%. Core CPI (excluding energy, food, alcohol, and tobacco)also surprised to the upside, rising from 3.5% to 3.7%, versus expectation of 3.5% yoy.
Goods inflation picked up from 2.0% yoy to 2.4%, its highest since October 2023. Services inflation remained stubbornly high, unchanged at 4.7% yoy.
On a monthly basis, CPI rose 0.3%, adding to signs that disinflationary progress may be stalling.
USD/JPY Mid-Day Outlook
Daily Pivots: (S1) 147.93; (P) 148.47; (R1) 149.40; More...
USD/JPY retreats mildly but stays above 147.55 minor support. Intraday bias remains mildly on the upside. Rise from 139.87 is resuming and should target 100% projection of 139.87 to 148.64 from 142.66 at 151.43. That is close to 61.8% retracement of 158.86 to 139.87 at 151.22. On the downside, below 147.55 minor support turn intraday bias neutral again first.
In the bigger picture, price actions from 161.94 (2024 high) are seen as a corrective pattern to rise from 102.58 (2021 low). There is no clear sign that the pattern has completed yet. But still, strong support is expected from 38.2% retracement of 102.58 to 161.94 at 139.26 to bring rebound.
US PPI flat in June, misses forecasts
US producer prices were flat in June, falling short of expectations for a 0.3% mom rise. While a 0.3% mom increase in goods prices provided some support, a -0.1% mom dip in services prices offset the gain. PPI excluding food, energy, and trade services was unchanged on the month too.
On an annual basis, headline PPI slowed to 2.3% yoy from 2.6% yoy, also below forecasts 2.5% yoy. The more stable core measure still rose 2.5% year-on-year.
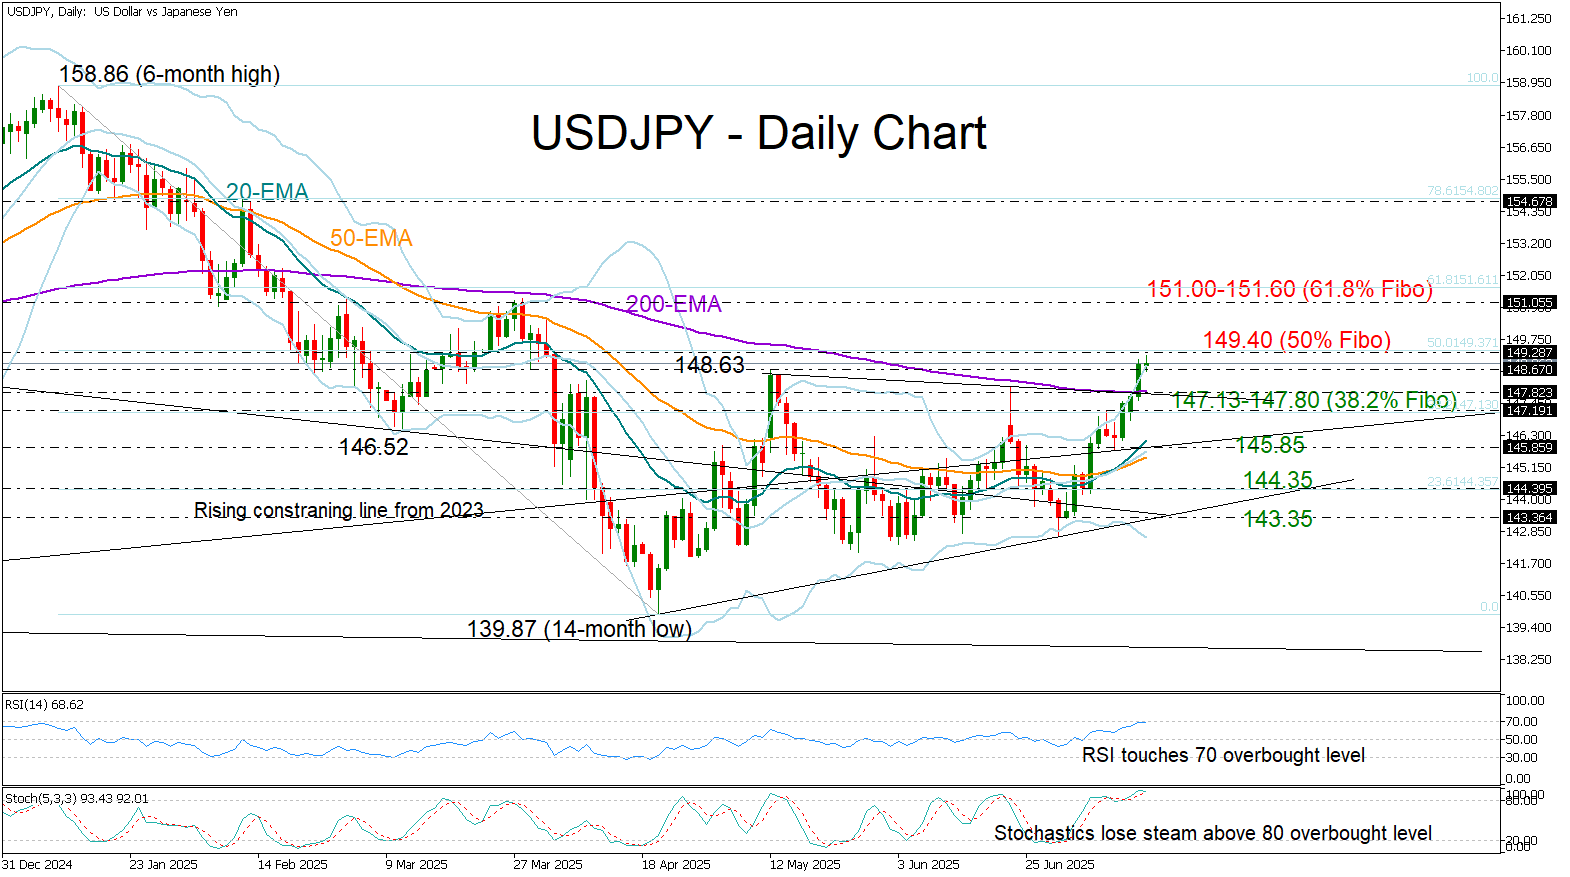
USD/JPY Clears 200-EMA Ahead of Japan’s Election
- USD/JPY crosses above 200-day EMA, prints three-month high.
- Technical signals suggest stability below 149.40.
USD/JPY advanced above its 200-day exponential moving average (EMA) for the first time since February on Tuesday, while slightly extending its ascent to a new three-month high of 149.17 earlier today before losing momentum.
The bullish price action coincides with growing political uncertainty in Japan, as the ruling Liberal Democratic Party and its coalition partner face the risk of losing their majority in the upper house in Sunday’s election. However, a sustained move higher remains uncertain, given that the price has closed above the upper Bollinger Band and both the RSI and stochastic oscillator are signaling overbought conditions.
A decisive breakout above the 50% Fibonacci retracement of the January–April downleg could pave the way for an extension toward the 151.00 barrier and the 61.8% Fibonacci level at 151.60. A move beyond that point may open the door for a rally toward 154.70.
On the downside, if bullish pressure fades, the price could find immediate support between the 200-day EMA at 147.85 and the 38.2% Fibonacci level at 147.13. Further declines may stabilize near 145.85. However, only a drop below 143.35 would signal a bearish trend reversal.
Overall, USD/JPY appears cautious, as overbought conditions hint at a possible pullback or consolidation in the short term. The next bullish phase is likely to resume above 149.40.
EUR/USD Pares Gains While USD/JPY Rises
EUR/USD declined from the 1.1750 resistance and traded below 1.1650. USD/JPY is rising and might gain pace above the 149.20 resistance.
Important Takeaways for EUR/USD and USD/JPY Analysis Today
- The Euro started a fresh decline after a strong surge above the 1.1720 zone.
- There is a connecting bearish trend line forming with resistance at 1.1660 on the hourly chart of EUR/USD at FXOpen.
- USD/JPY climbed higher above the 147.50 and 148.40 levels.
- There is a key bullish trend line forming with support at 148.40 on the hourly chart at FXOpen.

On the hourly chart of EUR/USD at FXOpen, the pair rallied above the 1.1720 resistance zone before the bears appeared, as discussed in the previous analysis. The Euro started a fresh decline and traded below the 1.1660 support zone against the US Dollar.
The pair declined below 1.1620 and tested 1.1590. A low was formed near 1.1592 and the pair started a consolidation phase. There was a minor recovery wave above the 1.1610 level.
EUR/USD is now trading below the 50-hour simple moving average. On the upside, it is now facing resistance near the 1.1630 level. It is close to the 23.6% Fib retracement level of the downward move from the 1.1749 swing high to the 1.1592 low.
The next key resistance is at 1.1660 and the 50% Fib retracement level. There is also a connecting bearish trend line forming with resistance at 1.1660.
The main resistance is near the 1.1690 level. A clear move above it could send the pair toward the 1.1720 resistance. An upside break above 1.1720 could set the pace for another increase. In the stated case, the pair might rise toward 1.1750.
If not, the pair might resume its decline. The first major support on the EUR/USD chart is near 1.1590. The next key support is at 1.1550. If there is a downside break below 1.1550, the pair could drop toward 1.1520. The next support is near 1.1485, below which the pair could start a major decline.
USD/JPY Technical Analysis
On the hourly chart of USD/JPY at FXOpen, the pair started a fresh upward move from the 145.75 zone. The US Dollar gained bullish momentum above 146.55 against the Japanese Yen.
It even cleared the 50-hour simple moving average and 148.00. The pair climbed above 149.00 and traded as high as 149.18. The pair is now consolidating gains above the 23.6% Fib retracement level of the upward move from the 145.74 swing low to the 149.18 high.

The current price action above the 148.50 level is positive. There is also a key bullish trend line forming with support at 148.40. Immediate resistance on the USD/JPY chart is near 149.20.
The first major resistance is near 149.50. If there is a close above the 149.50 level and the RSI moves above 70, the pair could rise toward 150.50. The next major resistance is near 152.00, above which the pair could test 155.00 in the coming days.
On the downside, the first major support is 148.40 and the trend line. The next major support is visible near the 147.90 level. If there is a close below 147.90, the pair could decline steadily.
In the stated case, the pair might drop toward the 147.50 support zone and the 50% Fib retracement level of the upward move from the 145.74 swing low to the 149.18 high. The next stop for the bears may perhaps be near the 146.55 region.
Trade over 50 forex markets 24 hours a day with FXOpen. Take advantage of low commissions, deep liquidity, and spreads from 0.0 pips. Open your FXOpen account now or learn more about trading forex with FXOpen.
This article represents the opinion of the Companies operating under the FXOpen brand only. It is not to be construed as an offer, solicitation, or recommendation with respect to products and services provided by the Companies operating under the FXOpen brand, nor is it to be considered financial advice.