
Sample Category Title
GBP/USD Daily Outlook
Daily Pivots: (S1) 1.3361; (P) 1.3424; (R1) 1.3482; More...
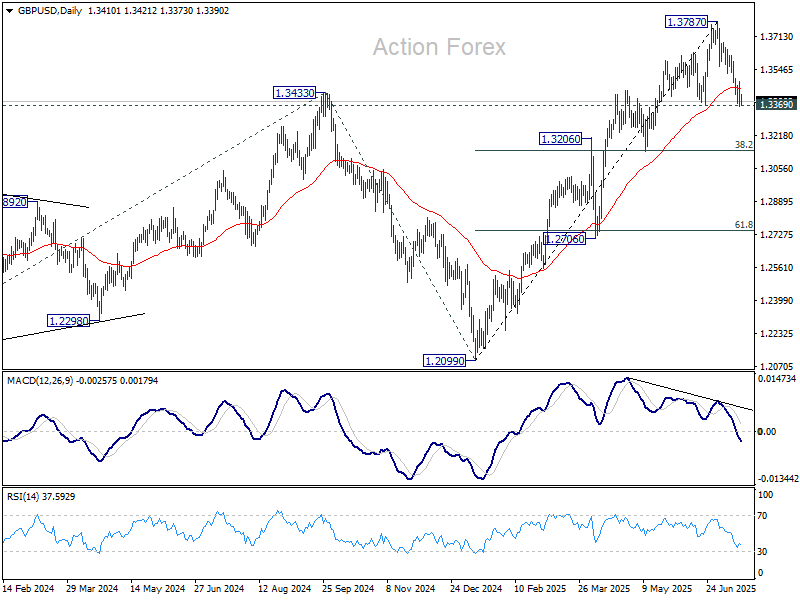
Intraday bias in GBP/USD remains neutral with focus on 1.3369 support. Decisive break there will suggests that it's already correcting the rise from 1.2099. Deeper fall should then be seen to 1.3138 cluster support (38.2% retracement of 1.2099 to 1.3787 at 1.3142). Nevertheless, strong rebound from current level will retain near term bullishness. Break of 1.3561 support turned resistance will bring retest of 1.3787 high first.
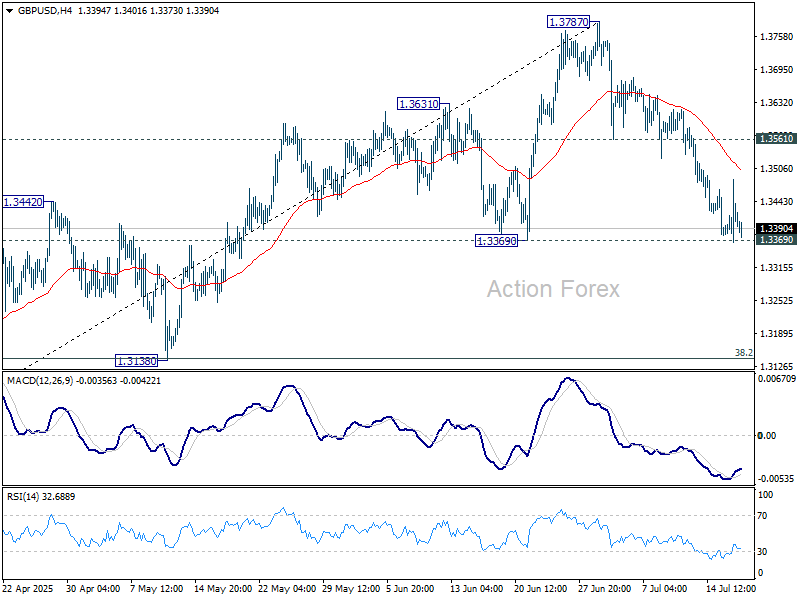
In the bigger picture, up trend from 1.3051 (2022 low) is in progress. Next medium term target is 61.8% projection of 1.0351 to 1.3433 from 1.2099 at 1.4004. Outlook will now stay bullish as long as 55 W EMA (now at 1.3019) holds, even in case of deep pullback.
USD/CHF Daily Outlook
Daily Pivots: (S1) 0.7950; (P) 0.8006; (R1) 0.8065; More….
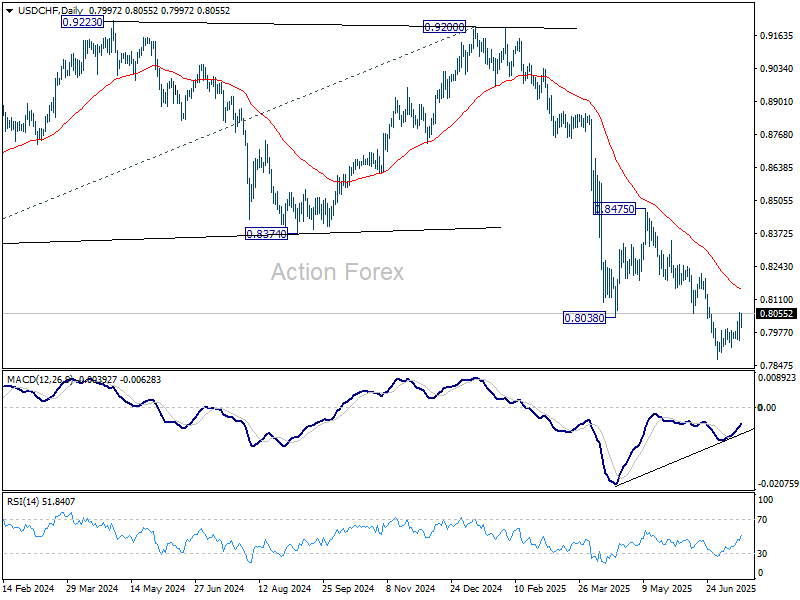
Intraday bias in USD/CHF stays neutral first and focus is on 0.8054 support turned resistance. Decisive break there will suggest that it's at least correcting the fall from 0.8475. Further rise should then be seen to 55 D EMA (now at 0.8151). Nevertheless, rejection by 0.8054 will retain near term bearishness. Below 0.7946 minor support will bring retest of 0.7871 low.
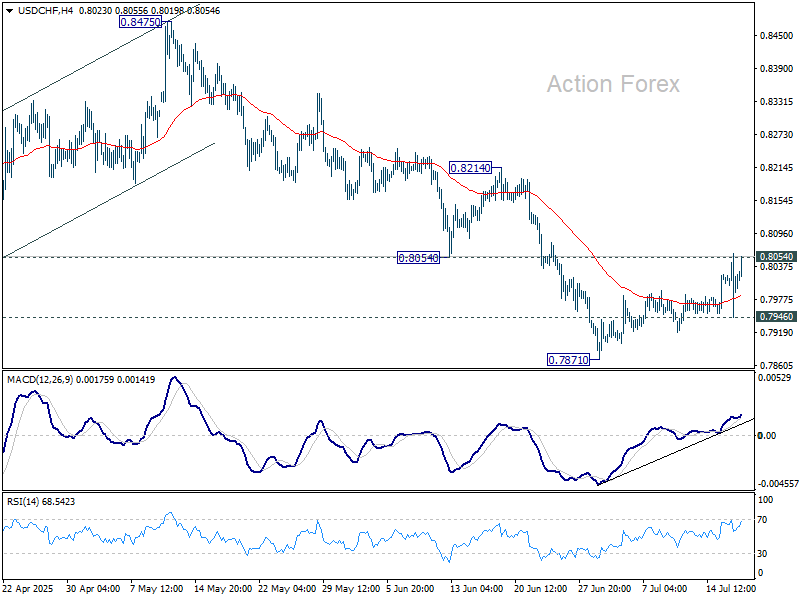
In the bigger picture, long term down trend from 1.0342 (2017 high) is still in progress. Next target is 100% projection of 1.0146 (2022 high) to 0.8332 from 0.9200 at 0.7382. In any case, outlook will stay bearish as long as 0.8475 resistance holds.
USD/CAD Daily Outlook
Daily Pivots: (S1) 1.3656; (P) 1.3705; (R1) 1.3731; More...
Intraday bias in USD/CAD is back on the upside with breach of 1.3729 temporary top. Further rise could be seen to 1.3797 resistance and above, to extend the corrective pattern from 1.3538. On the downside, break of 1.3650 minor support will bring retest of 1.3538/55 support zone instead.
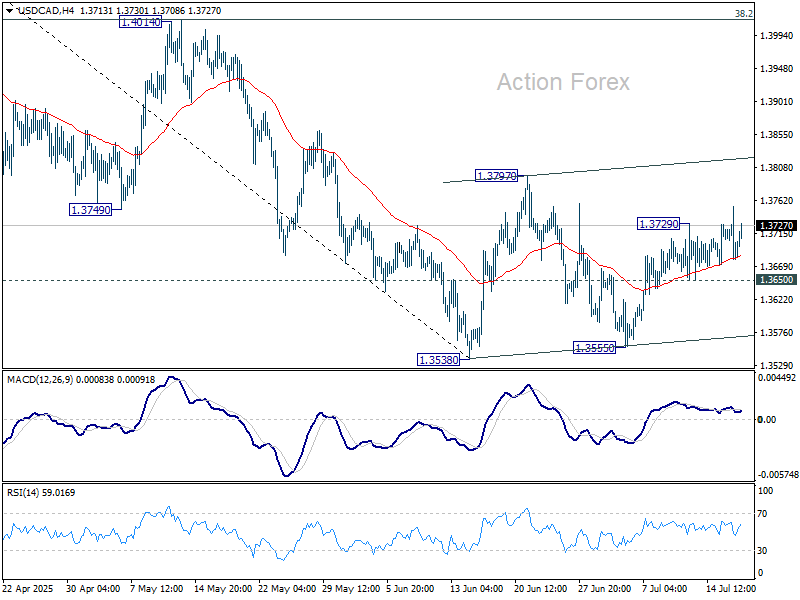
In the bigger picture, price actions from 1.4791 medium term top could either be a correction to rise from 1.2005 (2021 low), or trend reversal. In either case, further decline is expected as long as 1.4014 resistance holds. Next target is 61.8% retracement of 1.2005 (2021 low) to 1.4791 at 1.3069.
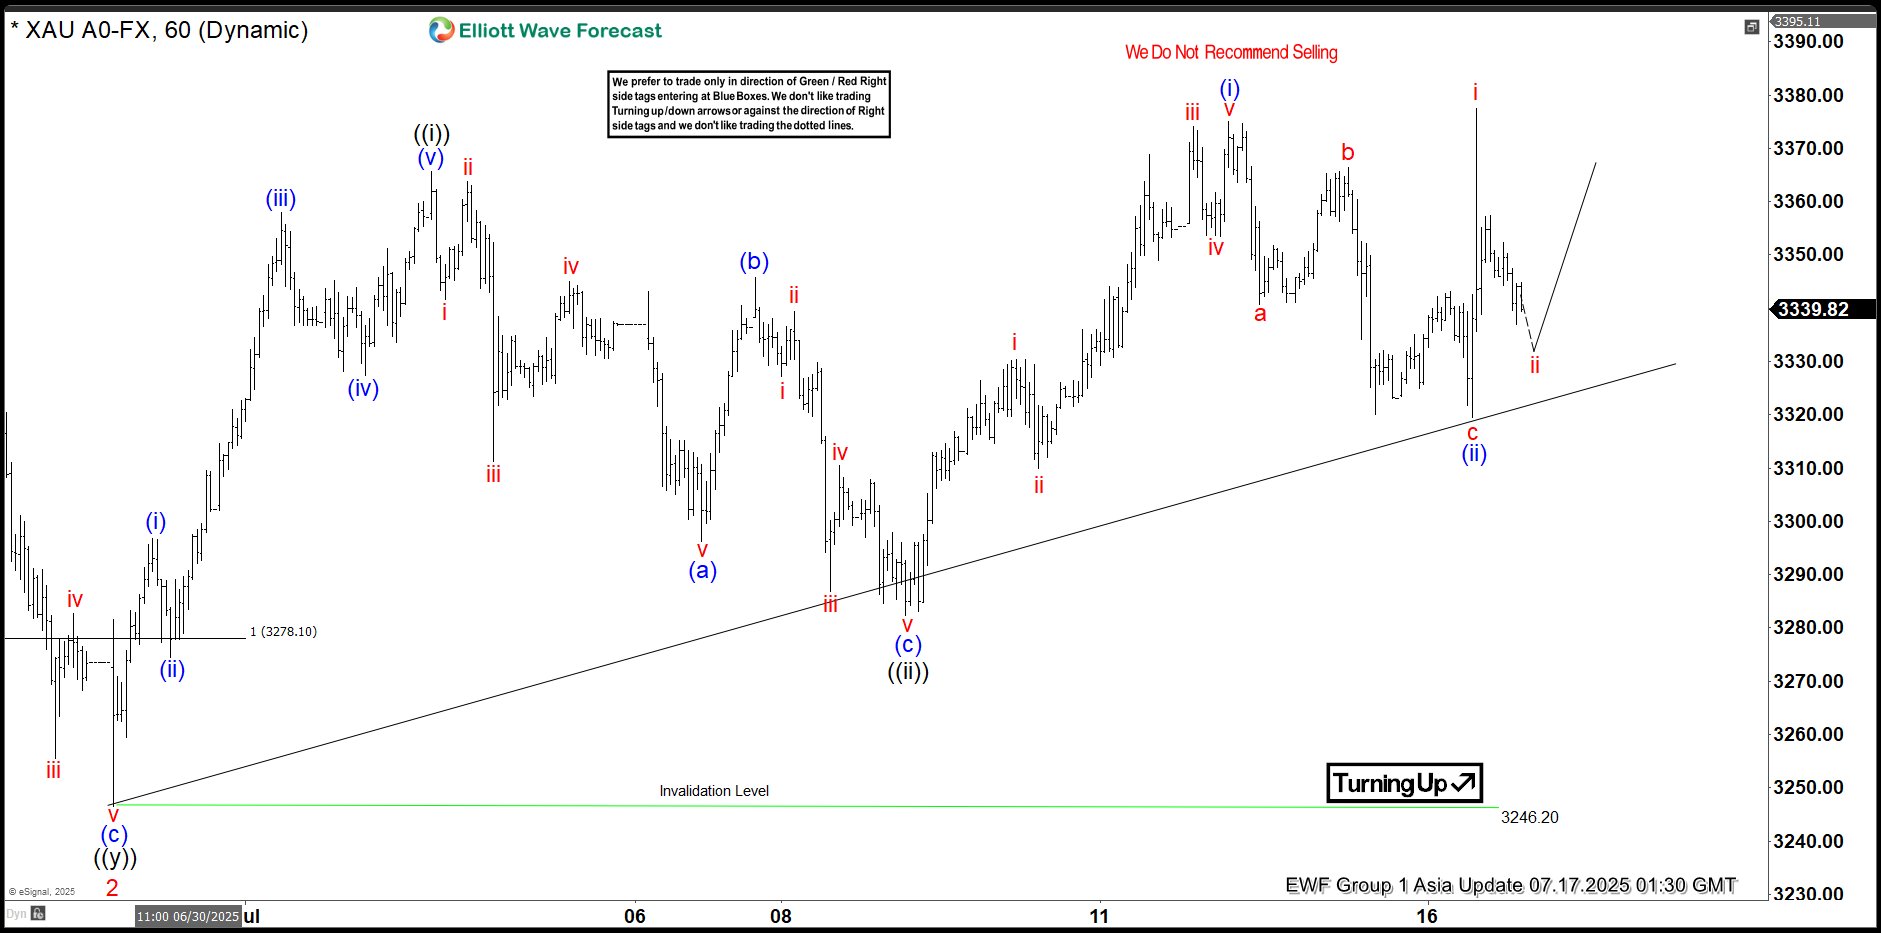
Elliott Wave View: XAUUSD (Gold) Should Continue Rally
Elliott Wave sequence in XAUUSD (GOLD) suggest bullish view against September-2022 low in weekly. In daily, it should remain supported in 3, 7 or 11 swings to continue rally to extend higher. In daily, it ended ((4)) correction in 7 swings sequence at 3120.20 low in 5.15.2025 low against April-2025 peak. Above May-2025 low, it should continue rally targeting 3589 or higher levels, while pullback stays above 3246.55 low. In 4-hour, it placed 1 at 3452.5 low in proposed diagonal sequence. Within 1, it ended ((i)) at 3252.05 high, ((ii)) at 3245.20 low, ((iii)) at 3365.93 high, ((iv)) at 3245.20 low & finally ((v)) ended at 3452.50 high. It ended 2 in 7 swings correction at 3246.55 low in 6.29.2025. Within 2 pullback, it ended ((w)) at 3340.18 low, ((x)) at 3398.35 high & ((y)) at 3246.55 low in extreme area. It provided short term buying opportunity in extreme area, corrected 0.618 Fibonacci retracement of 1.
Above 2 low, It is showing nest in 1-hour sequence expecting further rally. It needs to break above 6.15.2025 high of 3452.5 to confirm the upside to extend daily sequence. Short term, it placed ((i)) of 3 at 3365.70 high, ((ii)) at 3282.43 low, (i) of ((iii)) at 3374.96 high & (ii) of ((iii)) at 3319.50 low. It is showing higher high since 2 low in 5 swings, which can be nest or a diagonal sequence, if breaks below 7.09.2025 low before rally higher above 6.29.2025 low. In (i), it ended i at 3330.32 high, ii at 3309.91 low, iii at 3374.02 high, iv at 3353.43 low & v at 3374.96 high. In (ii) pullback, it placed a at 3340.76 low, b at 3366.38 high & c as diagonal at 3319.50 low. It already broke above (i) high, confirmed upside can be possible as long as it stays above 3319.50 low.
Currently, it favors pullback in ii of (iii), while placed i at 3377.48 high. It expect pullback in 3 swings to hold above 3319.50 low before rally continue in iii of (iii). The further upside confirms when it break above 3452.50 high. Five swings rally from 6.29.2025 low, suggests more upside should be unfold. The next leg higher expect to erase the momentum divergence in 1-hour to be (iii) of ((iii)). Alternatively, if it breaks below 7.09.2025 low, it can be pullback against 6.29.2025 low, while ended ((i)) in diagonal at 3377.48 high. Gold is choppy after April-2025 peak. It can even do double correction, if breaks below 6.29.2025 low, correcting against May-2025 low before rally continue. We like to buy the pullback in 3, 7, or 11 swings pullback as it is bullish in weekly sequence.
XAUUSD (GOLD) – 60-Minute Elliott Wave Technical Chart:
XAUUSD (GOLD) Elliott Wave Technical Video:
https://www.youtube.com/watch?v=ba-cPlZc9M4
Markets Sensitive to Trump’s Attempt to Undermine Fed’s Independence
Markets
US President Trump sorted the problem of a dull eco calendar yesterday. Fed Chair Powell is the thorn in the US President’s side. And while he still claims it will be unlikely to fire Powell, he doesn’t rule anything out. Earlier court rulings clearly state that you can’t fire the Fed chair over a policy dispute – Trump is a long term advocate of lower policy rates – but you can do it for cause. One route president Trump seems to be exploring is mismanaging building costs in the renovation process of the Fed’s headquarters in Washington DC. This developing story adds to the ongoing rumours of a rapid confirmation process of Powell’s successor, ie the idea of a Shadow Fed Chair. Markets remain sensitive to Trump’s attempt to undermine the US central bank’s independence (and credibility). The louder he screams to lower short term interest rates, the more he risks driving up long term interest rates. The US 30-yr yield closed above 5% for a second consecutive session with a test of the 5.15% YtD top and the 5.18% 2023 top the likely way to go. US stock markets and the dollar traded volatile intraday on rumours about firing Powell soon which were later than denied. The S&P 500 lost almost 1% intraday, only to close 0.32% higher. EUR/USD spiked from levels just above 1.1560 to above 1.17, before finding a closing equilibrium near 1.1640. Throughout all the fuzz, a very large majority of Fed governors are backing Powell’s stance on (stable) interest rates in light of upside inflation risks. NY Fed Williams sees tariffs adding about one percentage point to inflation through H2 2025 and into 2026 with a weaker dollar adding somewhat to price pressures. “Maintaining this modestly restrictive stance of monetary policy is therefore entirely appropriate.”
Today’s eco calendar contains US retail sales, weekly jobless claims and Philly Fed business outlook. We don’t expect a lasting market impact following the decent early July US labour market data and this week’s sticky inflation numbers. Risks around the Fed chair story are asymmetric with any steps towards ousting Powell being a potential fire starter for US asset sales. UK labour market data this morning suggest that the BoE will stick with it’s gradual and careful cutting guidance when it lowers interest rates by another 25 bps at its early August policy meeting. Sterling might get some temporary reprieve after approaching the EUR/GBP 0.87 handle a second time yesterday. We err on the side of offloading any GBP exposure in case of short-term GBP-rally’s.
News & Views
Australian labour market data surprised negatively for the second consecutive month. Employment grew a meager 2k in June after the 1.1k contraction in May. Full time employment declined by 38.2k. This was ‘compensated’ for with a 40.2k rebound in part time employment. The unemployment rate jumped from 4.1% to 4.3% (highest since Nov 2021) as the number of unemployed people rose by 34k. Hours worked declined 0.9% in June, but following a 1.4% rise in May. The participation rate rose marginally from 67% to 67.1%. The Reserve Bank of Australia at the July 8 meeting left its policy rate unchanged at 3.85%, while the majority in the market expected a 25 bps cut. At the time, the RBA indicated that economic data were largely in line with its May forecast with inflation marginally higher. The RBA assessed the labour market as being tight. It indicated that wage growth was softening from its peak but productivity growth not picking up and growth in unit labour costs remaining high. In this uncertain context the RBA concluded that it could wait a little longer to see whether inflation returns to 2.5%. The central bank now might gradually give more weight to labour weakness. Key quarterly inflation data will be published on July 30. Markets fully discount a 25 bps cut at the August 12 meeting. The 3-y bond yields drops 8.8 bps to 3.42%. AUD/USD is falling below the 0.65 mark (from 0.653).
The European commission yesterday proposed its new budget (Multiannual Financial Framework) for the 2028-2034 period. It consists of almost €2tn, or 1.26% of the average EU gross national income between 2028 and 2034 1.13% in the previous budget). The majority of the funding comes from EU members states, but the commission also puts in place several new sources to fund the budget. Major priorities in the budget are supporting European competitiveness, prosperity and security. The budget also includes €100bn funding for Ukraine. Funding for agriculture will be reduced. Several countries already objected parts of the proposal. Yesterday’s proposal kickstarts an lengthy process of negotiations that ultimately will have to be agreed upon by EU members states (unanimously) by end 2027.
The Fed Drama
The day Donald Trump was re-elected for a second term as US President, we knew the headlines would be full of twists and turns. We expected surprising and unusual news every day—and yet, what we’ve seen so far has exceeded our expectations and prepared us for little. What’s happening feels surreal, and yesterday was no exception.
The New York Times reported that Trump had drafted a letter to fire Federal Reserve (Fed) Chair Jerome Powell and asked GOP members for feedback. This news brought nothing new—everyone knows the relationship between the two men is frosty—but the mere drafting of a letter made things feel more serious and triggered volatility. The US dollar dropped sharply, and the 2-year Treasury yield tanked amid expectations that Powell’s replacement would aggressively cut rates to please Trump.
Then Trump denied any plans to fire Powell, saying he was only discussing the idea in concept. I’m quoting Bloomberg here: “that he is only discussing it in concept”—the concept of firing the Fed Chair because he’s not making the decisions Trump wants, even though Powell’s decisions make sense given economic realities.
Markets caught their breath after this initial shock, but investors remain skeptical about what comes next. In Turkish, we say, “where there’s no fire, there’s no smoke.” Here, we know that the smoke is coming from a big fire. The consequences of such an attack on the Fed’s independence could be dramatic. Not only would the US dollar and Treasuries tumble, but the Fed would lose a superpower: the one that helps it support turmoiled financial markets by buying billions of dollars in US debt.
Remember, the US—and a few privileged economic zones—are unique in that government bonds can be supported by their central banks purchasing their debt. This is due to credibility. If that credibility is lost, the Fed loses its most important tool. Believe me, if the Turkish central bank bought Turkish government bonds to finance government debt—yes, even the sound of it is funny—that would just be printing money, which in theory should lose its value. If QE and the Fed’s expanding balance sheet have worked so well over decades, it’s because the Fed enjoys a level of credibility that few others do. If that credibility disappears, lowering rates would severely hurt both the dollar and Treasuries.
In summary: keep an eye on safer havens—it looks like we might see some serious action at the Fed this fall.
Big banks’ record trading revenues
Trump’s comments on Powell caused some selloff across major US indices, but the S&P 500 still managed to close with gains. Softer-than-expected PPI data helped cool mounting inflation fears after the previous day’s CPI print surprised on the upside.
Bank earnings continued to impress. Goldman Sachs’ equity trading desk, for example, posted its best revenue in Wall Street history. Morgan Stanley and Bank of America scored their best Q2 results on record, benefiting from the high market volatility driven by constant twists in White House policies with global repercussions. The SPDR Financial Sector ETF fell to a three-week low before rebounding, though its daily chart looks toppish after a 24% rally since the April dip.
Elsewhere, Nvidia consolidated gains near a record high. Alphabet extended modest gains to $185 per share on news that it will debut new Pixel-branded hardware at an event on August 20, including several smartphones and a smartwatch powered by its own AI technology. Given the market’s muted reaction, investors don’t expect this to be a ‘first iPhone reveal’ level event. But since the iPhone is falling behind tech peers in the AI race, the window to replace it with a new big gadget is wide open. Note that the iPhone has dominated for nearly two decades—much longer than predecessors like Nokia, Ericsson, or BlackBerry, who all had their star moments but for much shorter periods. I’m not saying Google will invent the next big thing, but AI is about to get a face. Who will deliver it? We’ll find out.
Speaking of AI, ASML reported better-than-expected revenue and earnings yesterday but still suffered an 8% post-earnings slump due to uncertainties about next year’s revenue growth amid trade restrictions. The stock fell off its bullish trend from April through yesterday. However, ASML remains the sole chip equipment maker for the world’s leading chipmakers, so its business outlook is tied closely to theirs. This dip could be an interesting buying opportunity, though the broad AI rally should be approached with some caution. The divergence between semiconductors and ASML suggests the two should eventually converge.
Zooming out, the Stoxx 600 index remained under pressure yesterday despite gains in the S&P 500, weighed down by ongoing trade tensions. European leaders have agreed to retaliate if the threatened 30% US tariffs materialize. Potential measures include taxes on US tech giants, targeted curbs on US investments in the EU, and limited access for US companies to bid for European public contracts.
We’ll see if Trump chickens out—and whether this triggers a market correction. I often watch market corrections from my summer vacation—and I’ll be on vacation starting tomorrow.
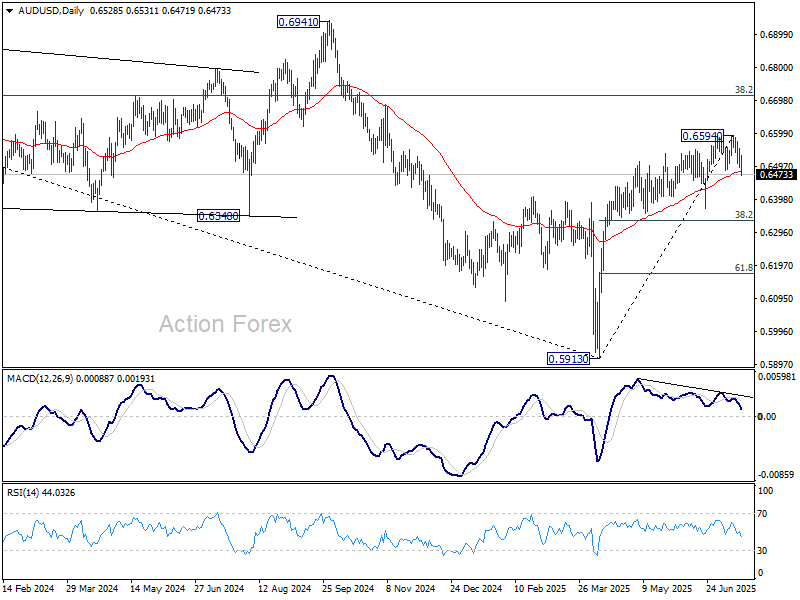
AUD/USD Daily Report
Daily Pivots: (S1) 0.6498; (P) 0.6526; (R1) 0.6557; More...
AUD/USD's break of 0.6484 support confirms short term topping at 0.6594. Fall from there is tentatively seen as a correction to rise from 0.5913. Intraday bias is back on the downside for 38.2% retracement of 0.5913 to 0.6594 at 0.6334. Strong support could be seen there to bring rebound. But for now, near term outlook is neutral as long as 0.6594 resistance holds, and more consolidations would be seen. Meanwhile, sustained trading below 0.6334 will raise the chance of bearish reversal.
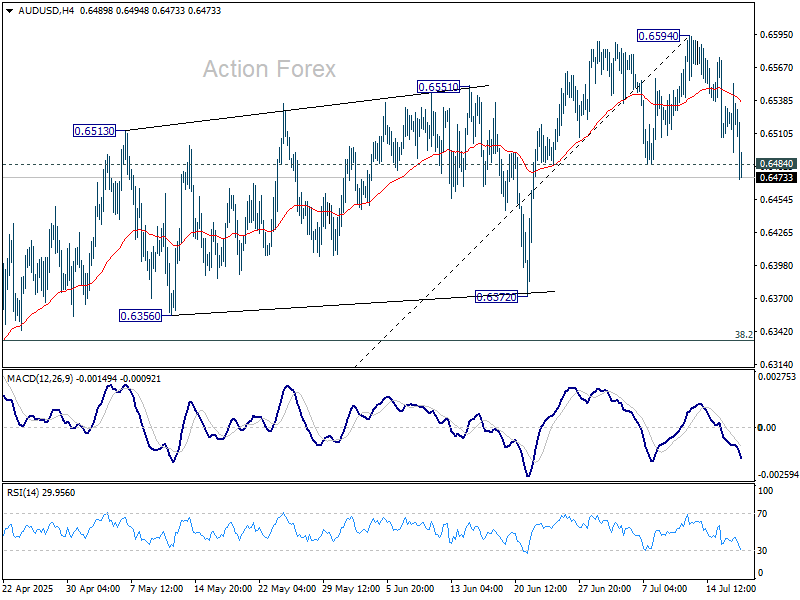
In the bigger picture, there is no clear sign that down trend from 0.8006 (2021 high) has completed. Rebound from 0.5913 is seen as a corrective move. While stronger rally cannot be ruled out, outlook will remain bearish as long as 38.2% retracement of 0.8006 to 0.5913 at 0.6713 holds. Nevertheless, considering bullish convergence condition in W MACD, even in case of another fall through 0.5913, downside should be contained above 0.5506 (2020 low).
Greenback Recovers from Powell Firing Whipsaws, Aussie Crushed by Jobs Shock
Dollar swung sharply overnight as speculation swirled around the fate of Fed Chair Jerome Powell. Reports surfaced that US President Donald Trump was preparing to fire Powell imminently, with one claim suggesting a dismissal letter had already been drafted and shown to lawmakers during a meeting on cryptocurrency legislation. Dollar initially plunged on the news amid fears of a major hit to Fed credibility.
However, the greenback recovered swiftly after Trump walked back the rumors, telling reporters, “We’re not planning on doing it... I don’t rule out anything, but I think it’s highly unlikely, unless he has to leave for fraud.” Still, the episode reinforced growing concerns about political interference at the central bank. Persistent pressure from the White House to lower interest rates has already raised questions about Fed independence.
For now, most Fed officials appear focused on managing inflation risks tied to the Trump administration’s sweeping tariffs. While Powell chairs the FOMC, policy decisions remain collective, limiting the scope for direct political influence. But markets remain wary. Any leadership upheaval interpreted as compromising the Fed’s autonomy could trigger a sharp repricing in the dollar, equities, and—most critically—Treasuries.
A selloff in US government bonds would hit the administration hardest, pushing yields sharply higher and raising borrowing costs at a time of ballooning deficits. That prospect may help explain Trump’s decision to distance himself, for now, from the firing chatter.
Elsewhere, Australian Dollar slumped in Asia after June employment data badly missed expectations, with particular weakness in full time work. Some market participants criticized RBA’s July hold as a policy misstep in hindsight. Others caution against overreacting, noting the data may reflect volatility rather than a turning point. Still, the market now sees rising odds of an August cut, contingent on the upcoming Q2 inflation print. If CPI also softens, the case for easing will be hard to dismiss.
In the broader FX space, Dollar remains the week’s best performer, followed by Loonie and then Euro. Kiwi and Aussie are the worst, while Swiss Franc also lagged. Yen and Sterling are treading water in the middle of the pack.
In Asia, at the time of writing, Nikkei is up 0.36%. Hong Kong HSI is up 0.07%. China Shanghai SSE is up 0.23%. Singapore Strait Times is up 0.51%. Japan 10-year JGB yield is down -0.016 at 1.561. Overnight, DOW rose 0.53%. S&P 500 rose 0.32%. NASDAQ rose 0.25%. 10-year yield fell -0.034 to 4.455.
Fed Beige Book: Inflation to rise more rapidly by late summer
The Fed’s latest Beige Book reported a slight pickup in US economic activity from late May through early July, a modest improvement over the previous edition. Five districts saw slight or modest growth, while five were flat and two reported declines.
However, businesses remain wary, with uncertainty still elevated and the overall outlook described as “neutral to slightly pessimistic.” Only two districts expected any pickup in activity moving forward. Labor conditions remained cautious, with only a very slight increase in employment and modest wage growth.
Price pressures continued to build, described as moderate to modest across districts. Input costs tied to tariffs—particularly in manufacturing and construction—were widely cited, with most businesses facing “modest to pronounced” cost pressures.
A growing number of firms are beginning to pass these higher costs to consumers via price hikes or surcharges. Others, constrained by customer price sensitivity, have opted to absorb the increases, compressing margins. With broad expectations for continued cost pressure in the coming months, the Fed noted that "consumer prices will start to rise more rapidly by late summer".
Fed's Williams: Inflation to hit 3–3.5% as tariffs bite
New York Fed President John Williams warned that tariff effects are only beginning to show up in the data and could push inflation significantly higher in the months ahead. Speaking overnight, Williams said the full impact of US tariffs will take time to materialize, but expects them to add “about 1 percentage point” to inflation through the second half of this year and into early 2026. While he acknowledged current data shows only “modest” impact, he anticipates upward pressure will grow meaningfully.
Williams forecast inflation to average between 3% and 3.5% in 2025, before cooling to around 2.5% in 2026 and only returning to the Fed’s 2% target by 2027. For June specifically, he expects headline inflation at 2.5% and core at 2.75%. Alongside elevated price pressures, he also projects a slowing economy, with growth easing to around 1% this year and unemployment rising to 4.5% from the current 4.1%.
Against this backdrop, Williams endorsed holding rates at current levels. “Maintaining this modestly restrictive stance of monetary policy is entirely appropriate,” he said, suggesting the Fed is in no rush to cut despite cooling growth.
Fed's Bostic: Price pressures are real
Atlanta Fed President Raphael Bostic warned that rising inflation linked to import tariffs may delay any rate cuts. Speaking to Fox Business, Bostic acknowledged the uncertainty created by Trump’s trade actions. He added that increasing price pressures is now visible across the Southeast. “The price pressures are real,” he said, citing business feedback and internal surveys.
Bostic suggested the June CPI report, which showed broad-based increases in prices—particularly for heavily imported goods—may mark an "inflection point". He highlighted that headline inflation moved further away from the Fed’s 2% target. “We've seen the highest increase in prices that we've seen all year,” he added. That backdrop, he argued, warrants caution.
When pressed about the possibility of no rate cut until 2026, Bostic didn’t rule it out. “Everything is on the table,” he said, stressing that the path of policy will depend entirely on how inflation evolves. “If prices continue to move steadily away from our target, then we’ll have to consider what policy response is appropriate.”
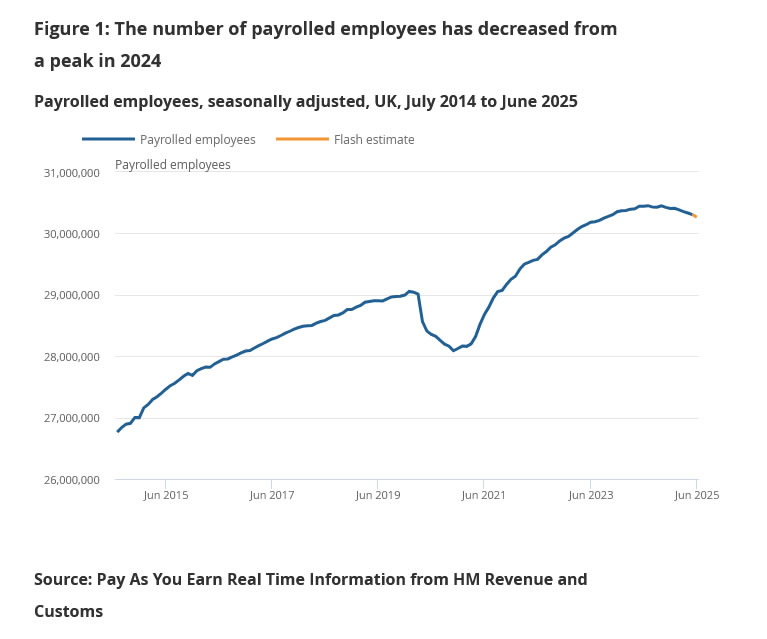
UK payrolled employment slips again, wage growth slows further
UK payrolled employment fell by -41k in June, marking a second straight monthly contraction. Though May’s drop was revised to a milder -24k from an initial -109k, the overall picture still points to a softening labor market. Claimant count rose more than expected by 25.8k. Unemployment rate in the three months to May edged higher from 4.6% to 4.7%.
Wage growth also lost some momentum, with median monthly pay rising 5.6% yoy in June, down from May’s 5.7% yoy. Average earnings growth in the three months to May slowed to 5.0% both with and without bonuses, with the latter still slightly hotter than the 4.9% expected.
Aussie unemployment rate surges to 4.3% as full-time jobs slide
Australia’s June jobs report came in well short of expectations, with only a 2k increase in employment and a sharp divergence between full-time and part-time work. Full-time employment plunged by -38.2k while part-time roles rose 40.2k. Unemployment rate rose to 4.3%, defying forecasts for it to hold at 4.1%, while participation rate remained unchanged at 67.0%.
According to the ABS, the rise in joblessness was driven by a 34k increase in the number of unemployed Australians. ABS labor head Sean Crick added that full-time hours worked declined -1.3% in the month, suggesting further weakness ahead. Despite a marginal rise in total hours worked of 0.1% mom, the data add to signs that the labor market is losing momentum.
Japan auto exports to US plunge -26.7% yoy as carmakers cut prices
Japan logged a trade surplus of JPY 153B in June, with exports down -0.5% yoy and imports up 0.2% yoy. The most striking detail was a sharp -11.4% yoy drop in exports to the US, the steepest decline since February 2021. Imports from the US also fell, declining -2.0% yoy.
Automobile shipments to the US fell -26.7% by value, while auto parts (-15.5% yoy) and pharmaceuticals (-40.9% yoy) also saw double-digit drops. Still, a 3.4% yoy rise in car export volumes suggests Japanese automakers are slashing prices and absorbing costs to maintain market share.
On a seasonally adjusted basis, exports dipped -0.4% mom while imports fell -1.0%, leaving a JPY 235B trade deficit.
The report comes just weeks before a 25% reciprocal US tariff on Japanese goods takes effect on August 1. That is one percentage point higher than the 24% rate first announced on "Liberation Day" in April.
AUD/USD Daily Report
Daily Pivots: (S1) 0.6498; (P) 0.6526; (R1) 0.6557; More...
AUD/USD's break of 0.6484 support confirms short term topping at 0.6594. Fall from there is tentatively seen as a correction to rise from 0.5913. Intraday bias is back on the downside for 38.2% retracement of 0.5913 to 0.6594 at 0.6334. Strong support could be seen there to bring rebound. But for now, near term outlook is neutral as long as 0.6594 resistance holds, and more consolidations would be seen. Meanwhile, sustained trading below 0.6334 will raise the chance of bearish reversal.
In the bigger picture, there is no clear sign that down trend from 0.8006 (2021 high) has completed. Rebound from 0.5913 is seen as a corrective move. While stronger rally cannot be ruled out, outlook will remain bearish as long as 38.2% retracement of 0.8006 to 0.5913 at 0.6713 holds. Nevertheless, considering bullish convergence condition in W MACD, even in case of another fall through 0.5913, downside should be contained above 0.5506 (2020 low).
UK payrolled employment slips again, wage growth slows further
UK payrolled employment fell by -41k in June, marking a second straight monthly contraction. Though May’s drop was revised to a milder -24k from an initial -109k, the overall picture still points to a softening labor market. Claimant count rose more than expected by 25.8k. Unemployment rate in the three months to May edged higher from 4.6% to 4.7%.
Wage growth also lost some momentum, with median monthly pay rising 5.6% yoy in June, down from May’s 5.7% yoy. Average earnings growth in the three months to May slowed to 5.0% both with and without bonuses, with the latter still slightly hotter than the 4.9% expected.
GBP/USD Recovery Delayed? Watch for Major Resistance Ahead
Key Highlights
- GBP/USD started a fresh decline below the 1.3620 support zone.
- A connecting bearish trend line is forming with resistance at 1.3480 on the 4-hour chart.
- USD/JPY struggled to continue higher above the 149.20 zone.
- WTI Crude Oil is at risk of more losses below the $65.00 support.
GBP/USD Technical Analysis
The British Pound started a pullback from the 1.3780 zone against the US Dollar. GBP/USD dipped below the 1.3620 and 1.3550 support levels.
Looking at the 4-hour chart, the pair settled below the 1.3500 zone, the 100 simple moving average (red, 4-hour), and the 200 simple moving average (green, 4-hour). The bulls took a stand near the 1.3360 zone.
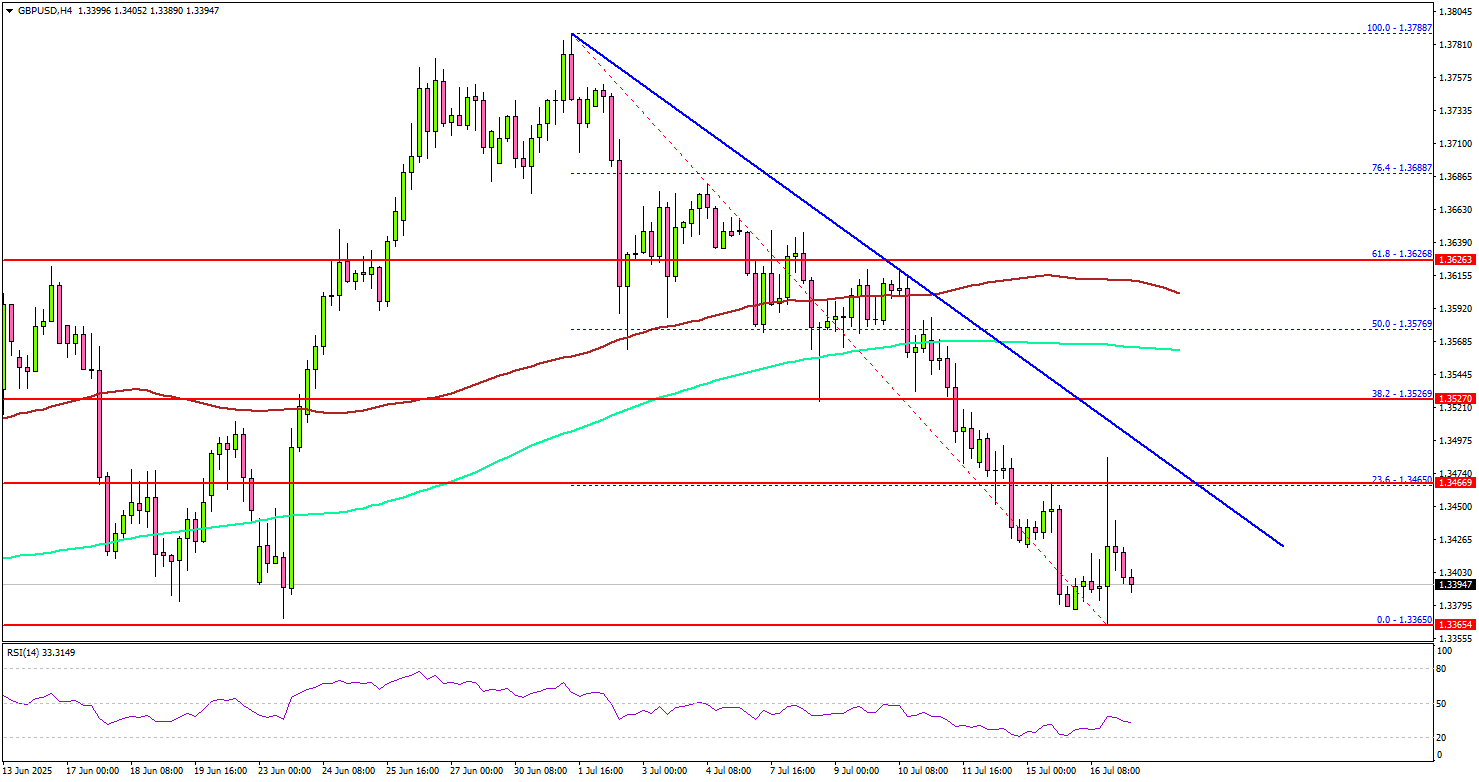
The pair is now consolidating losses and attempting to recover. There was a move toward the 23.6% Fib retracement level of the downward move from the 1.3788 swing high to the 1.3365 low.
On the upside, the pair could face resistance near the 1.3480 level and the trend line. The next key resistance sits near the 1.3520 level. A close above the 1.3520 level could set the pace for another increase.
In the stated case, the pair could rise toward the 1.3600 resistance and the 100 simple moving average (red, 4-hour). The next major stop for the bulls could be near the 1.3650 resistance.
On the downside, immediate support is near the 1.3400 level. The next key support sits near 1.3350. Any more losses could send the pair toward the 1.3300 support zone.
Looking at EUR/USD, the pair found support near the 200 simple moving average (green, 4-hour) and could start a fresh upward move.
Upcoming Economic Events:
- US Initial Jobless Claims - Forecast 235K, versus 227K previous.
- US Retail Sales March 2025 (MoM) – Forecast +0.1%, versus -0.9% previous.