Sample Category Title
FOMC Preview – Expecting -25 bps Cut From a Divided Fed
We expect the Fed to announce a rate cut of -25 bps, bringing the Fed funds rate target to 2-2.25%, this week. Yet, this decision is unlikely unanimous. Although there has been voice suggesting a deeper cut is needed, we do not it will happen this month. The plan for the balance sheet reduction would stay unchanged - the process is due to complete by end-September. At the accompanying statement, policymakers should upgrade the economic assessment in response to better data flow for June. At the forward guidance, we expect them to open the door for further easing when necessary.
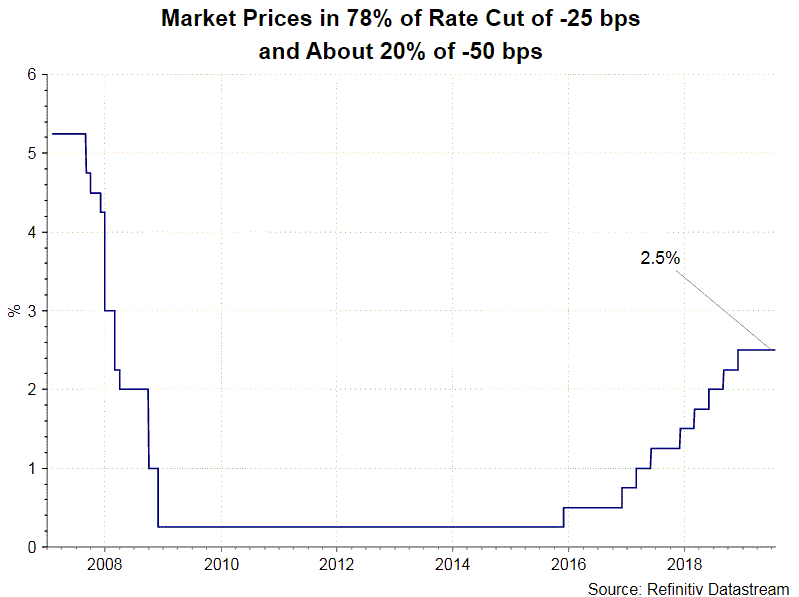
 Over the past months, Fed chair Jerome Powell, as well as other members, has given sufficient signals for a rate cut in July. Although economic growth has remained firm, inflation has recently weakened. Unresolved trade war between the US and China suggests risk to growth is to the downside. An insurance rate cut is necessary to stem sharp economic slowdown in the future. The market has currently priced in a 78% chance of a -25 bps cut and a 22% chance of -50 bps cut, compared with bets of 68% and 32%, respectively, last month. We expect the trimmed expectations of a deeper cut are driven by better economic data for June.
GDP growth eased to an annualized +2.1% q/q in 2Q19, from +3.1% in the prior quarter. However, this came in stronger that consensus of +1.8%. Consumption expenditures rose +4.3%, strongest since 4Q17, while government expenditures and gross investment soared +5%, fastest since 2Q09. On the flip side, business investment plunged -5.5%, weakest since 4Q15. On the job market, non-farm payrolls gained +224K in June, beating consensus of +165K. Although the unemployment rate edged higher, by +0.1 percentage point, to 3.7%, it stayed at the lowest level in 50 years. Meanwhile, wage growth soared +3.1% y/y, surpassing inflation. Price levels have stayed below Fed’s +2% target. Headline CPI slowed +1.6% y/y in June, from May’s +1.8%. Excluding food and energy prices, core CPI climbed to +2.1% from +2% in May. However, a downtrend appears to have developed over the past few months. PCE deflator is expected to steadied at +1.5% y/y in June, while the core reading could have improved to +1.7% from May’s 1.6%.
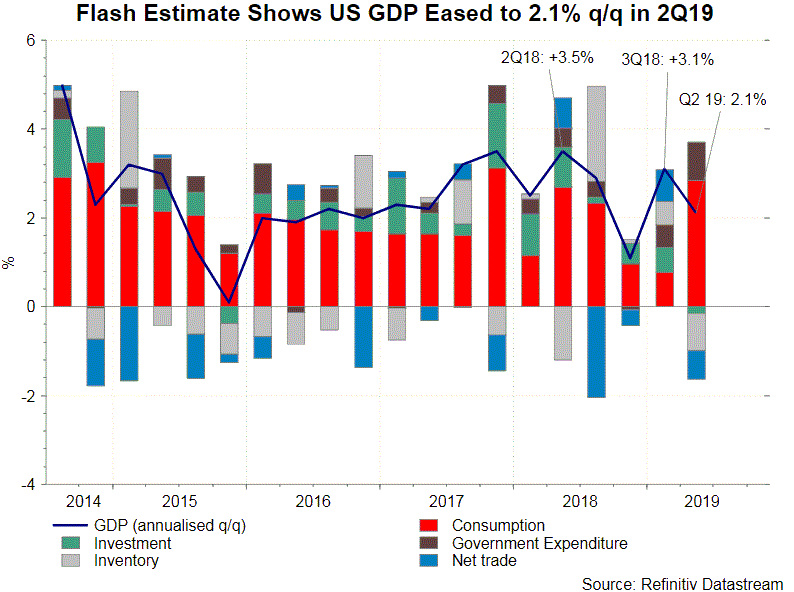
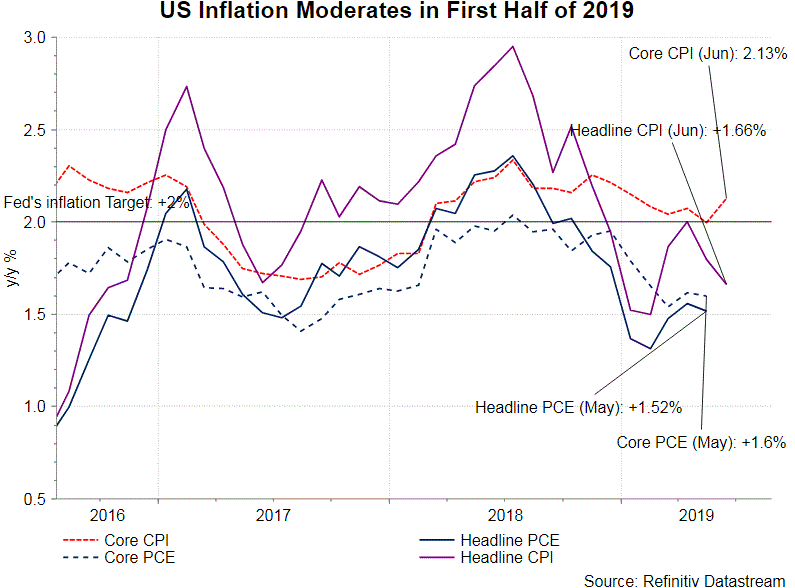
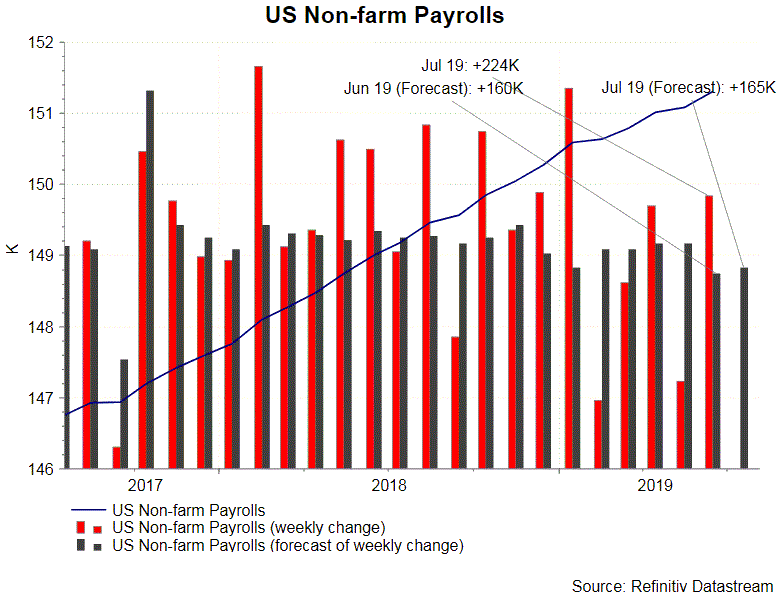
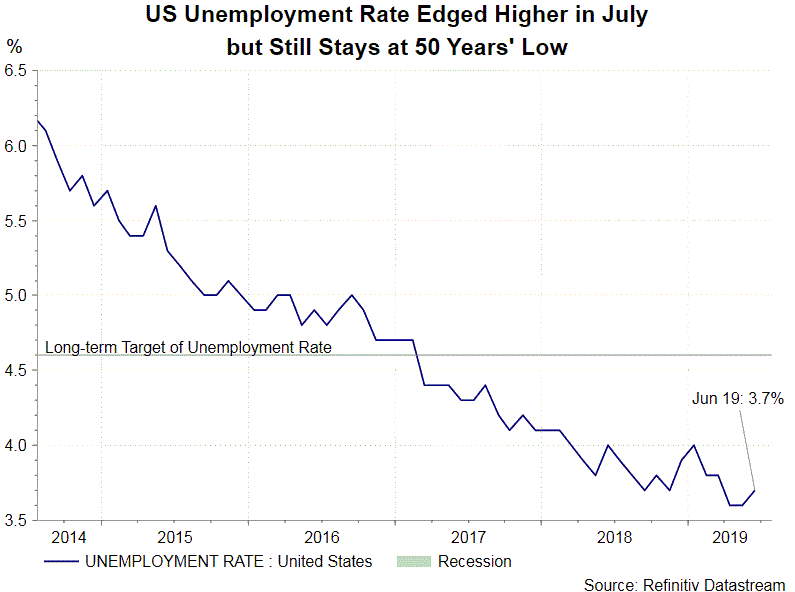 There will be no updated economic projections and median dot plot in July. At the policy statement, we expect the members to upgrade the assessments of economic development due to better- than- expected performance in the 2Q19 GDP growth and June’s job report. The pleasant surprises have also reduced the likelihood of a -50 bps rate cut this month, though an insurance cut of -25 bps is a done deal. Indeed, a -25 bps cut is far from unanimous. Kansas City Fed President Esther George and Boston Fed Eric President Rosengren have indicated their preference for leaving rates unchanged. Besides citing better data flow, Rosengren warned that “risk-on behavior actually makes an eventual pullback sometime in the future more costly”.
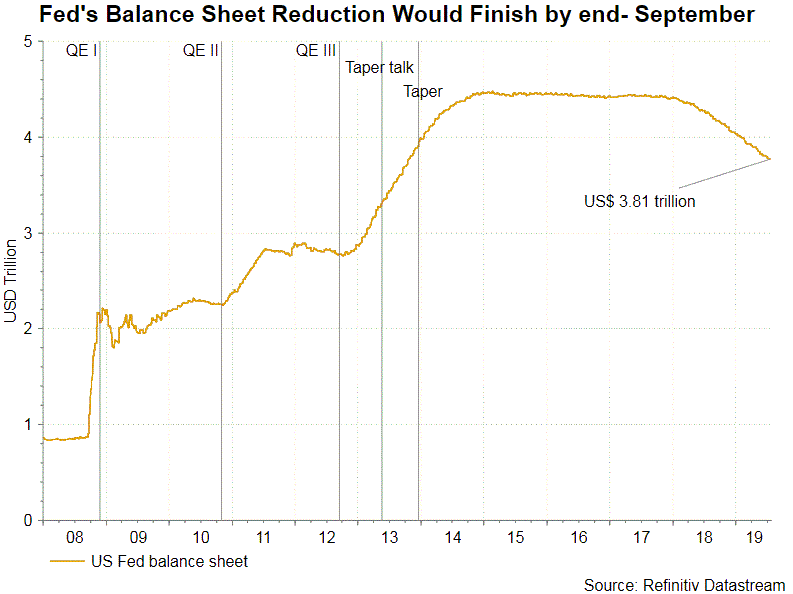
On the forward guidance, we expect the Fed reiterate that it “will closely monitor the implications of incoming information for the economic outlook and will act as appropriate to sustain the expansion”. We do not expect any change on the reduction of balance sheet. Indeed, the Fed announced in May that it is now on schedule to unwind US$35B per month in May through September. The process will finish at the end of September 2019.
Market Morning Briefing: Aussie Has Fallen Breaking Below Our Expected 0.6950
STOCKS
Near-term outlook looks mixed for equities. The outcome of the US Federal Reserve meeting on Wednesday and the developments on the US-China trade talk which is set to resume this week are likely to be key triggers to set the trend for equities. Until then the global equities are likely to consolidate sideways.
Dow (27192.45, +51.47, +0.19%) can consolidate between 27000 and 27350 ahead of the Fed meeting on Wednesday. A breakout on either side of this range will determine the next move. Our bias remains bearish on the Dow to break 27000 and decline towards 26600 while it remains below the key resistance level of 27500.
DAX (12419.90, +57.80, +0.47%) has to surpass 12450 decisively to turn the sentiment positive and rise to 12600 levels again. Inability to breach 12450 can keep it pressured to test 12200-12100 on the downside.
Nikkei (21559.35, -98.8, -0.46%) has dipped below its support at 21600 and looks vulnerable for a fall to 21400 and even 21250. Resistance is at 21750.
Shanghai (2938.22, -6.32, -0.21%) has to breach 2950 decisively to gain fresh momentum and rally to 3000. While below 2950, it can consolidate sideways between 2880 and 2950 for some more time.
Nifty (11284.30, +32.15, +0.29%) can see an intermediate corrective bounce to 11400 if it manages to sustain above 11200. But the broader picture is bearish for it to break 11200 eventually and fall to 11100-11000.
Sensex (37882.79, +51.81, +0.14%) is getting support at 37700 and while it holds, a relief rally to 38250 and 38400 is possible. But the broader picture remains bearish to see a fall to 37500 and 37000 in the coming weeks.
COMMODITIES
Commodities may remain stable with some chances of falling in the near term. Gold could test 1400, Silver may fall to 16.20 while Copper may test 2.68/66. Crude prices may also trade sideways over the next 2-3 sessions before bouncing back in the longer run.
Brent (63.24) and Nymex WTI (56.08) have dipped a bit from levels seen on Friday. Supports near 62 and 54 is holding intact for now. A bounce over the next 2-3 sessions look likely.
Gold (1421.60) and Silver (16.42) are trading stable without any major movement. Gold is trading towards the lower end of the broad 1460-1400 region and may test 1400 before rising back towards 1430 while Silver could test 16.20 before bouncing back from there. Note that 1430/40 could be important levels for Gold just now.
Copper (2.69) has come off below 2.70 and could be headed towards 2.68/66, our earlier mentioned levels last week. Near term looks weak.
FOREX
Almost all currency pairs are headed towards important supports or resistances. It would be important to see if Euro breaks below 1.11; Dollar-Yen holds below 109; Euro-Yen and Pound get support near 120 and 1.23 and whether the Indian Rupee will hold below 69 today. Markets could be softer ahead of the FOMC due on 31st July.
Dollar Index (97.96) has come off from just below 98.25. Resistance is visible near 98.50 which is likely to be tested in the next 3-6 sessions before the index falls back towards 97 again. However, in the very near term a short dip could be seen towards 97.50.
Euro (1.1131) is almost down to test 1.11 again. It would be important to see if the support near 1.11 breaks or holds as that would indicate further direction for the currency in the near to medium term. For now we may expect 1.11 to hold and produce a decent bounce.
Dollar-Yen (108.50) rose to test 108.83 on Friday but is trading lower just now. While below 109, we could expect some sideways trade between 109-107.50 region. In the longer term, say on the weekly candles, Dollar-Yen looks bullish.
Euro-Yen (120.76) has fallen below 121 again but while it remains above 120-118.82, longer term view remains bullish. We may consider a test of 118.82 if a break below 120 is seen.
Aussie (0.6907) has fallen breaking below our expected 0.6950. On the downside there is support near 0.69 and lower near 0.68 which could be tested in the near term. A bounce from 0.68 looks probable.
Pound (1.2372) has fallen in line with expectation. While below important near term resistance at 1.25, the Pound looks weak towards 1.23 in the near term. According to news sources, Brexiteers have voiced loudly that the EU must change their negotiating stance otherwise the UK will leave without a deal on October 31.
USDCNY (6.8833) has risen slightly but may remain below 6.90 in the near term. A rejection from 6.90 would take it back towards 6.88/85 or even lower in the medium term.
USDINR (68.9075) came down to test levels below 68.90 on Friday possibly indicating that a near term top has been made. While below 69, the currency pair may test 68.75 in the near term reducing chances of rising towards 69.25. Immediate view is bearish for Dollar-Rupee.
INTEREST RATES
Bond market is waiting keenly to see the outcome of the US Federal Reserve meeting on Wednesday (July 31). Market expects a 25 bps rate cut which is broadly priced in the market. So, it will be more important to see for any hints on the pace of future rate cuts which will be key in setting the trend for the market. We will have to wait and see.
The US Treasury yields have risen across tenor on Friday. The 2Yr (1.85%) and 10Yr (2.07%) were up 4 bps each and the 5Yr (1.85%) was up 5 bps. The 30Yr (2.59%) was up 2 bps. The near-term look positive. As mentioned earlier, the 2Yr and 10Yr are getting strong support near 1.80%. While this supports holds, the yields (2Yr and 5Yr) can rise to 1.93% -1.95% in the near term.
The German Yields are managing to hold above their key supports. The 2Yr (-0.77%), 5Yr (-0.67%), 10Yr (-0.38%) and 30Yr (0.20%) are stable. The 10Yr has support at -0.40% and the 30Yr at 0.19%. While these supports hold, the 10Yr can bounce to -0.30% and the 30Yr can rise to 0.30% in the coming weeks.
The 10Yr GoI (6.5254%) is holding above 6.50% but has to rise past 6.55% to gain momentum and target 6.60% and 6.65% on the upside. A dip below 6.50% can drag the 10Yr GoI lower to the key support level of 6.40%.
EUR/USD Remains In Significant Downtrend
Key Highlights
- The Euro failed to hold the 1.1200 support and declined heavily against the US Dollar.
- A major bearish trend line is forming with resistance near 1.1215 on the 4-hours chart of EUR/USD.
- The US Gross Domestic Product grew 2.1% in Q2 2019 (Prelim), more than the 1.8% forecast.
- The Spanish CPI in July 2019 (Prelim) could increase 0.4% (YoY), similar to the last change.
EURUSD Technical Analysis
The Euro made another attempt to climb above the 1.1280 resistance against the US Dollar. However, the EUR/USD pair struggled to continue higher and declined heavily below 1.1250 and 1.1200.
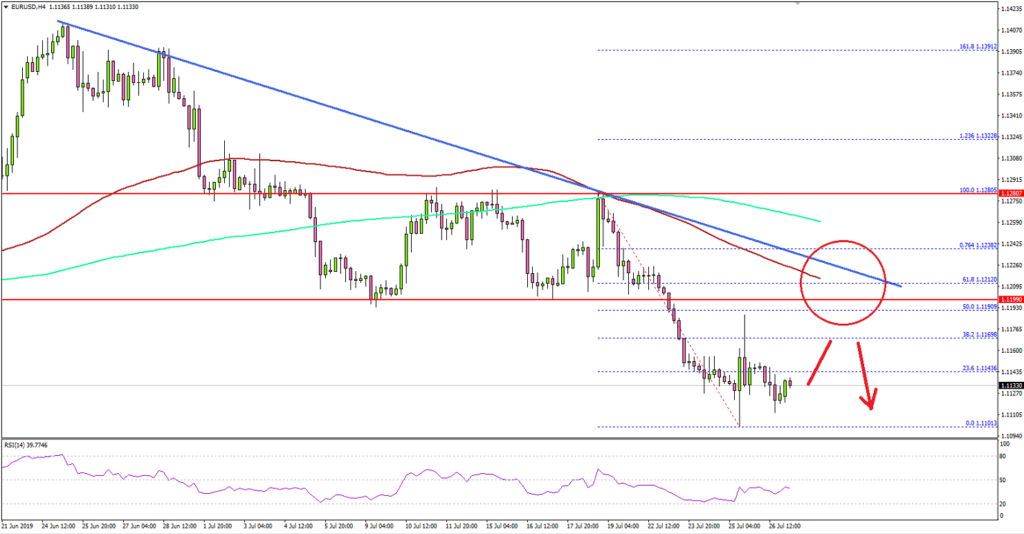
Looking at the 4-hours chart, the pair clearly made many attempts to surpass the 1.1280 and 1.1285 resistance levels. However, the bulls failed to gain strength above 1.1280, resulting in heavy downsides.
The pair broke the main 1.1200 support area to move into a bearish zone. It even declined below the 1.1150 support plus settled well below the 100 simple moving average (red, 4-hours) and the 200 simple moving average (green, 4-hours).
The pair traded close to the 1.1100 level and a new monthly low was formed at 1.1101. Later, there was a sharp upside correction above the 1.1140 and 1.1150 levels.
However, the recovery was capped by the 1.1180 resistance plus the 50% Fib retracement level of the downward move from the 1.1280 high to 1.1101 low. The pair trimmed most gains and traded below the 1.1150 level.
On the downside, the main support is near the 1.1100 level, below which the pair could start a significant downward move towards the parity level. On the upside, the main resistances are near 1.1180 and 1.1200 levels. There is also a major bearish trend line forming with resistance near 1.1215 on the same chart.
Fundamentally, the US Gross Domestic Product report for Q2, 2019 (Prelim) was released by the US Bureau of Economic Analysis. The market was expecting the US GDP to grow by 1.8%, less than the last 3.1%.
However, the actual result was better than the forecast, as the US GDP grew by 2.1% (according to the “advance” estimate).
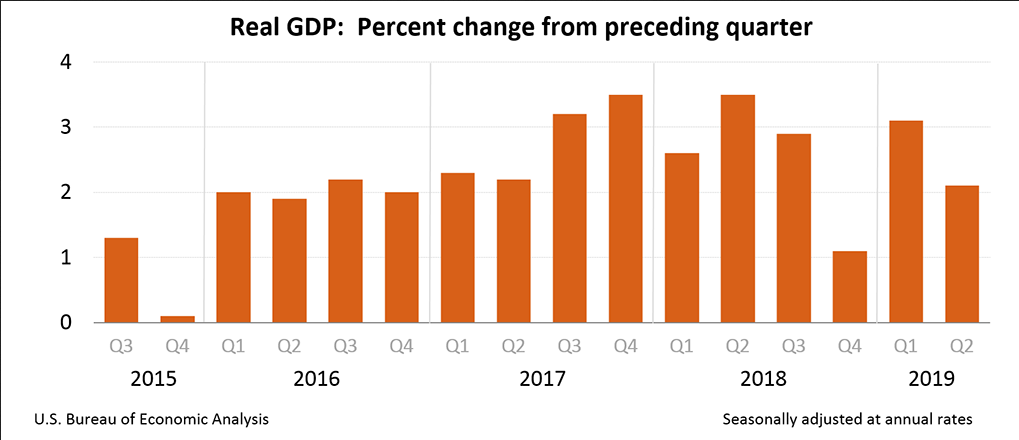
The report added:
Current-dollar GDP increased 4.6 percent, or $239.1 billion, in the second quarter to a level of $21.34 trillion. In the first quarter, current-dollar GDP increased 3.9 percent, or $201.0 billion.
Overall, the US Dollar remains in a strong uptrend and it seems like there could be more downsides in EUR/USD, GBP/USD and AUD/USD in the near term.
Economic Releases to Watch Today
Spanish CPI July 2019 (YoY) (Prelim) – Forecast 0.4%, versus 0.4% previous.
UK’s Consumer Credit June 2019 – Forecast £0.967B, versus £0.822B previous.
Daily Markets Broadcast
Wall Street climbs as growth tops estimates
US indices advanced yesterday, with the SPX500 index hitting a new record high, after US Q2 growth came in higher than expected while the NAS100 index was lifted after Google beat earnings forecasts.
US30USD Daily Chart
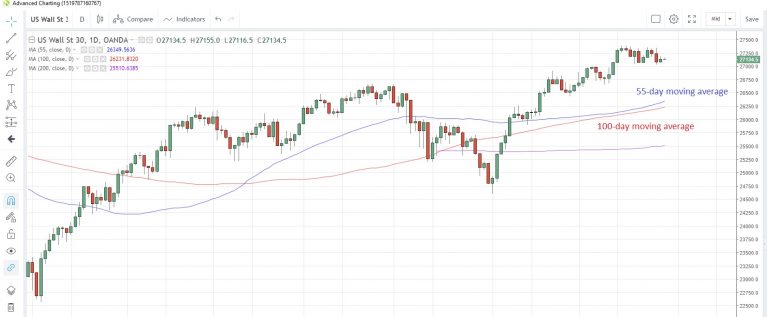
The US30 index snapped a two-day losing streak on Friday but lagged behind the other two major indices
The 55-day moving average at 26,349 is accelerating away from the 100-day moving average at 26,231
US economic growth slowed to +2.1% annualized in the second quarter, down from +3.1% in Q1 but above expectations of a 1.8% expansion. Today’s data slate includes the July Dallas Fed manufacturing business index, which is seen improving to -5.1 from -12.1 in June. It would still be the third straight month in negative territory.
DE30EUR Daily Chart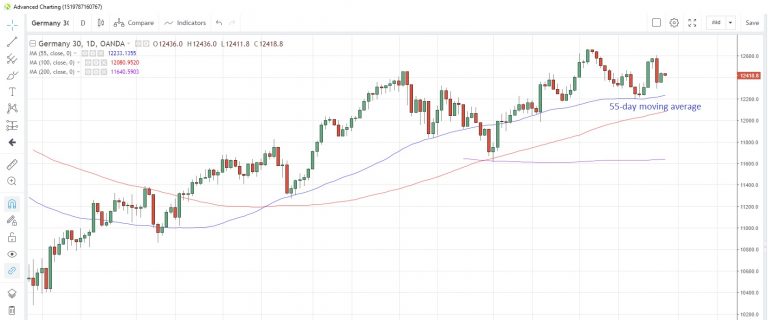
The Germany30 rebounded on Friday, taking its cue from the positive sentiment on Wall Street and heightened hopes for a September rate cut
The index is holding above the 55-day moving average at 12,233, which has supported prices on a closing basis since June 3
ECB Policymakers are reportedly leaning toward a deposit rate cut in September, with more government bond purchases likely. There are no major data releases scheduled from either Germany or the Euro-zone today.
UK100GBP Daily Chart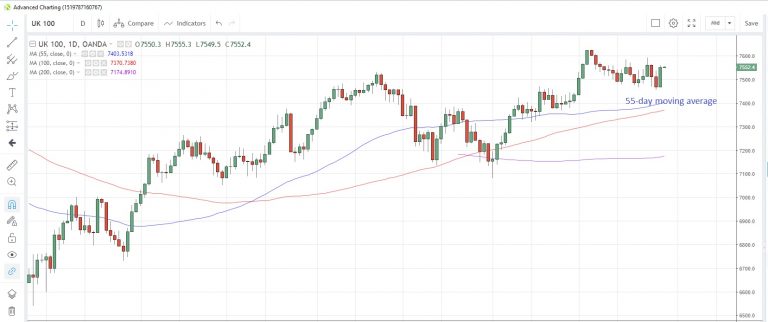
The UK100 index jumped the most in 5-1/2 weeks on Friday, buoyed by Wall Street and fighting talk on Brexit from the new PM Boris Johnson
The index is holding above the rising 55-day moving average at 7,403, which has supported prices on a closing basis since June 6
A UK government spokesman stated that PM Johnson had told Juncker the Withdrawal Agreement (WA) had been rejected three times by Parliament and would not pass in its current form. UK June house prices, as measured by the Nationwide index, are due to be released today. They rose 0.1% m/m in June. Perhaps lending support to house prices are expectations that mortgage approvals will rise to near 66,000 in the same month from 65,400 in May.
USDCHF Takes Back Two Weeks Losses
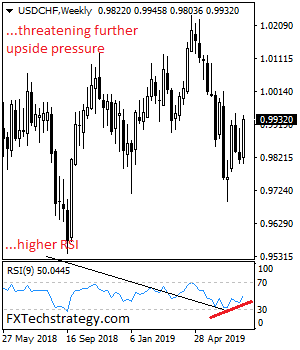
USDCHF retains its upside pressure as it took back its two-weeks looses to close higher on Friday. Resistance resides at the 0.9950 level. Above here, resistance lies at the 1.0000 level and then the 1.0000 level. Further out, resistance comes in at the 1.0050 level. Its weekly RSI is bullish and pointing higher suggesting further gain. On the downside, support is seen at the 0.9900 level with a turn below here opening the door for more decline towards the 0.9850 level. And then the 0.9800 level. Further down, support resides at the 0.9750 level. All in all, USDCHF remains biased to the upside on further corrective recovery.
Eco Data 7/29/19
[php_everywhere instance="1"]
EUR/USD Weekly Outlook
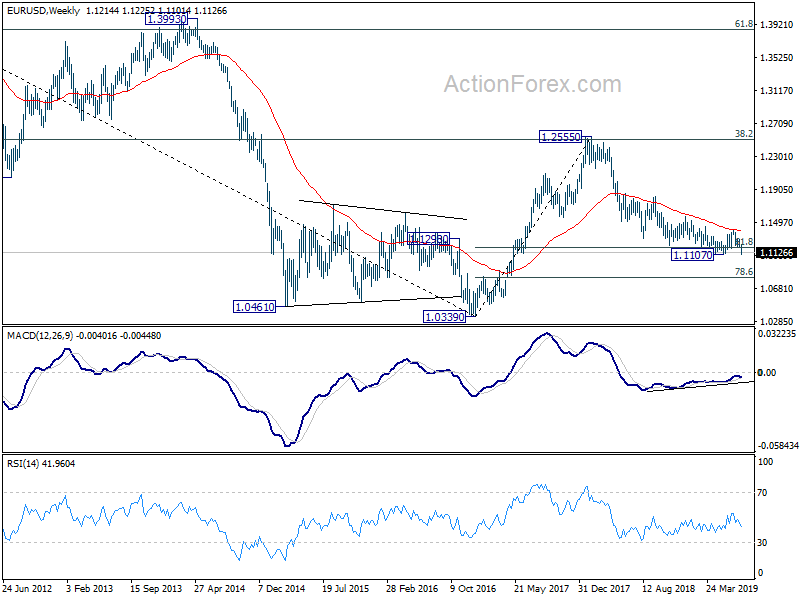
EUR/USD dropped to as low as 1.1101 last week but failed to sustain below 1.1107 low and recovered. Initial bias remains neutral this week for consolidations first. But as long as 1.1282 resistance holds, further decline is expected. Sustained break of 1.1107 low will resume larger down trend from 1.2555. Though, firm break of 1.1282 will bring stronger rise to 1.1412 resistance.
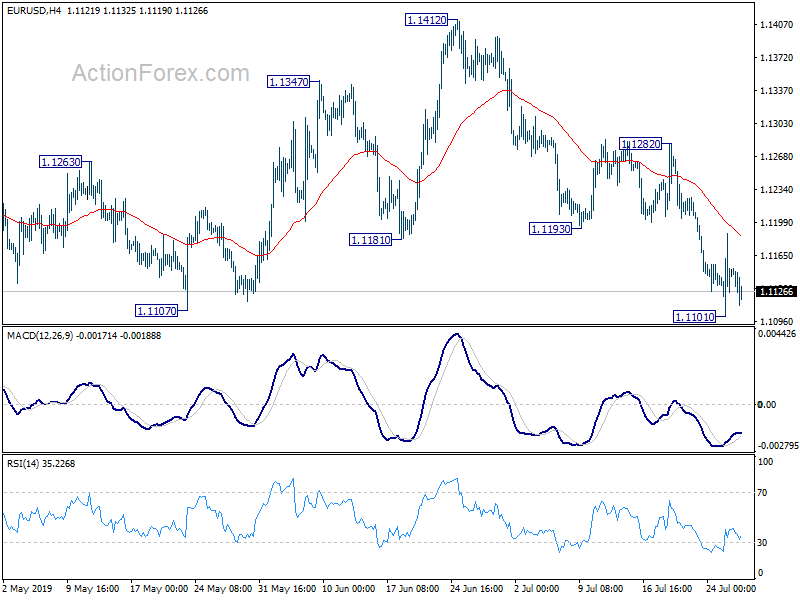
In the bigger picture, on the one hand, 1.1107 is seen as a medium term bottom on bullish convergence condition in weekly MACD. On the other hand, rejection by 55 week EMA retains medium term bearishness. Outlook stays neutral for now. On the downside, break of 1.1107 will resume the down trend from 1.2555 (2018 high) to 78.6% retracement of 1.0339 to 1.2555 at 1.0813. Meanwhile, break of 1.1412 will resume the rebound to 38.2% retracement of 1.2555 to 1.1107 at 1.1660.
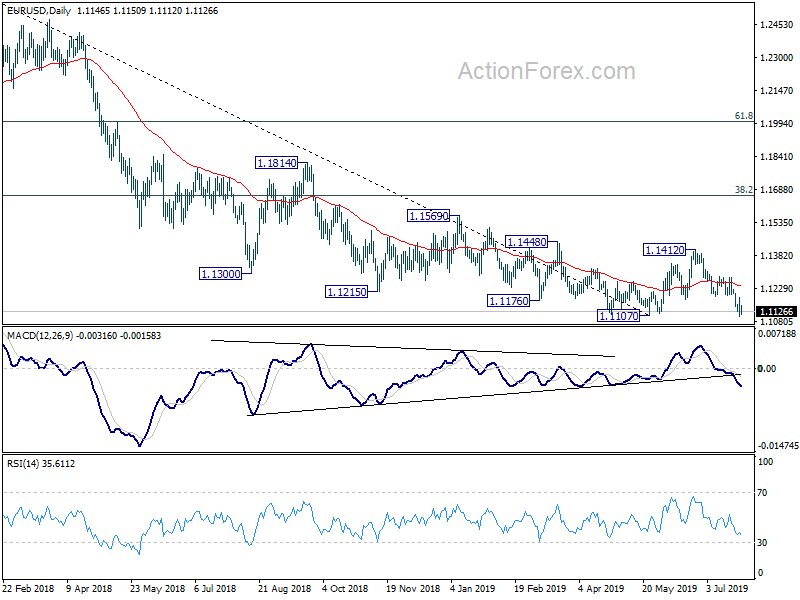
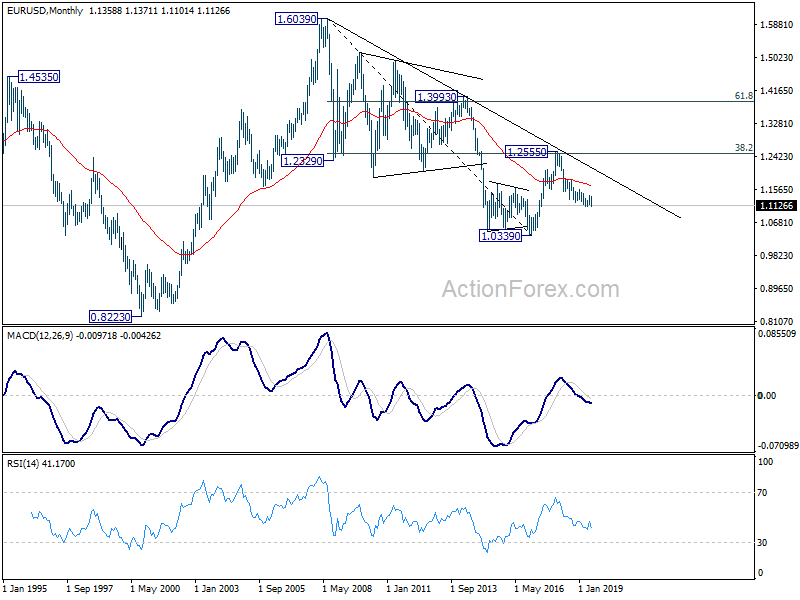
In the long term picture, outlook remains bearish for now. EUR/USD is held below decade long trend line that started from 1.6039 (2008 high). It was also rejected by 38.2% retracement of 1.6039 to 1.0339 at 1.2516 before. A break of 1.0039 low will remain in favor as long as 55 month EMA (now at 1.1658) holds).
USD/JPY Weekly Outlook
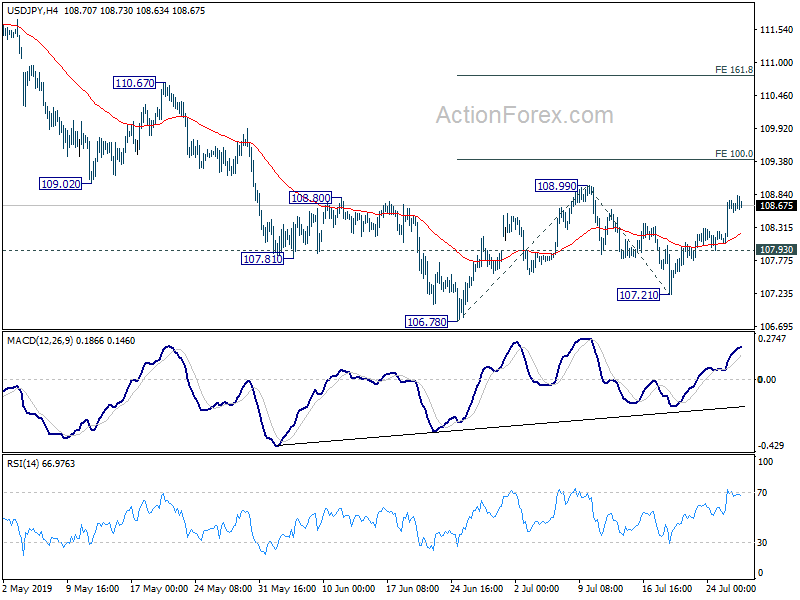
USD/JPY's strong rise last week suggests that pull back from 108.99 has completed at 107.21. And rebound from 106.78 is probably resuming. Initial bias stays on the upside this week. Break of 108.99 will target 100% projection of 106.78 to 108.99 from 107.21 at 109.42 and then 161.8% projection at 110.78. On the downside, below 107.93 minor support will turn bias back to the downside instead.
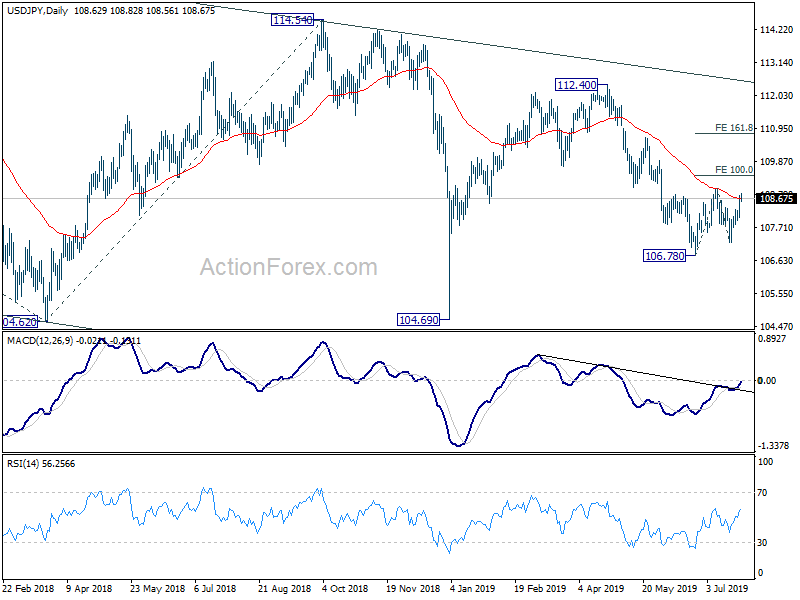
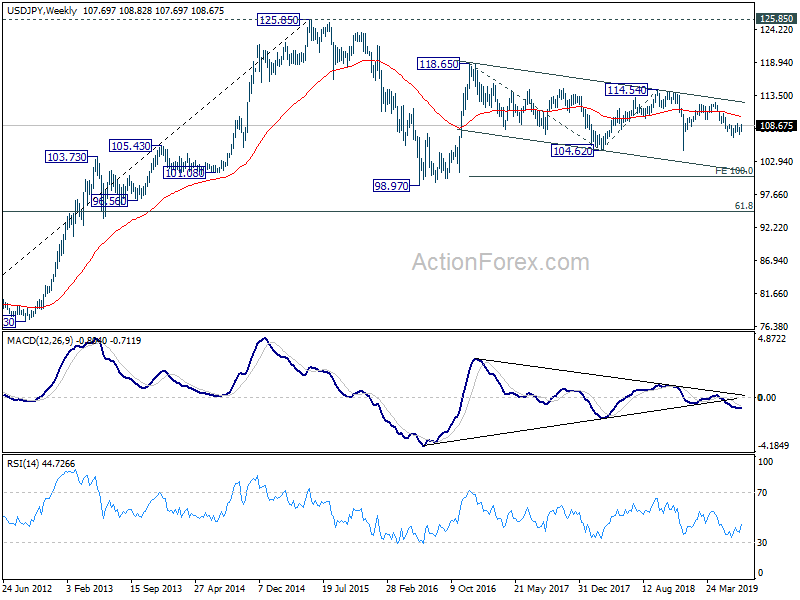
In the bigger picture, decline from 118.65 (Dec 2016) not completed yet, with the pair staying inside long term falling channel. Break of 104.62 will target 100% projection of 118.65 to 104.62 from 114.54 at 100.51. For now, we’d expect strong support above 98.97 (2016 low) to contain downside to bring rebound. In any case, break of 112.40 is needed to the first serious sign of medium term bullishness. Otherwise, further decline will remain in favor in case of rebound.
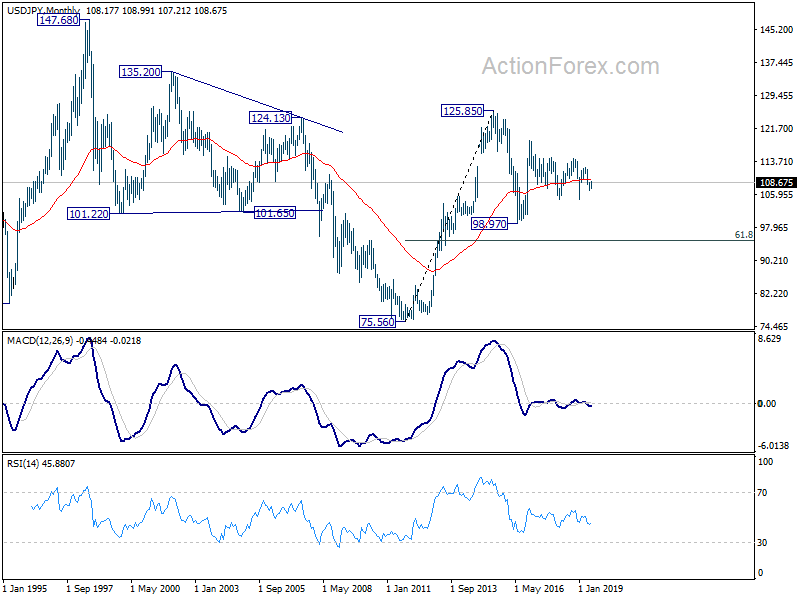
In the long term picture, the rise from 75.56 (2011 low) long term bottom to 125.85 (2015 high) is viewed as an impulsive move, no change in this view. Price actions from 125.85 are seen as a corrective move which could still extend. In case of deeper fall, downside should be contained by 61.8% retracement of 75.56 to 125.85 at 94.77. Up trend from 75.56 is expected to resume at a later stage for above 135.20/147.68 resistance zone.
GBP/USD Weekly Outlook
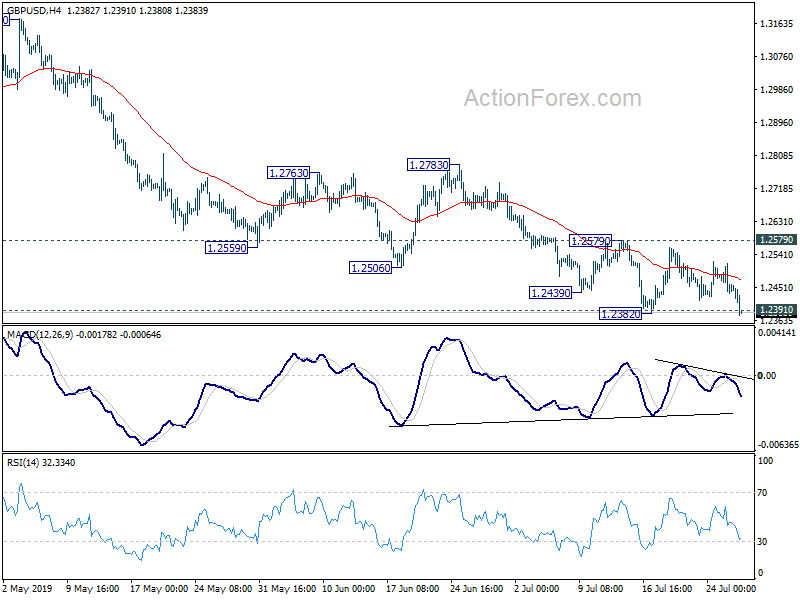
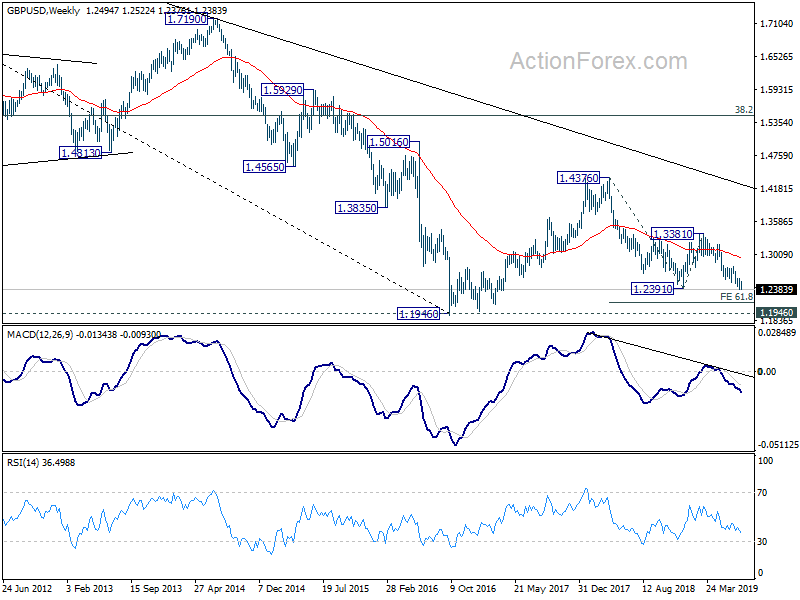
GBP/USD's recovery was limited well below 1.2579 resistance last week and broke 1.2382 after late selling. Initial bias is back on the downside this week. Sustained trading below 1.2391 key support will resume larger down trend for 61.8% projection of 1.4376 to 1.2391 from 1.3381 at 1.2154 next. In any case, outlook will remain bearish as long as 1.2579 resistance holds, in case of recovery.
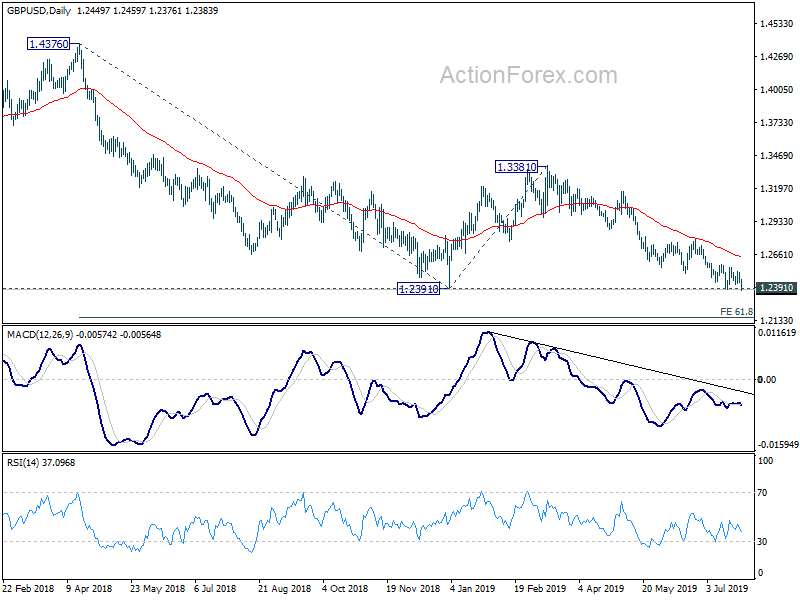
In the bigger picture, down trend from 1.4376 (2018 high) is still in progress. Break of 1.2391 would target a test on 1.1946 long term bottom (2016 low). For now, we don’t expect a firm break there yet. Hence, focus will be on bottoming signal as it approaches 1.1946. In any case, medium term outlook will stay bearish as long as 1.3381 resistance holds, in case of strong rebound.
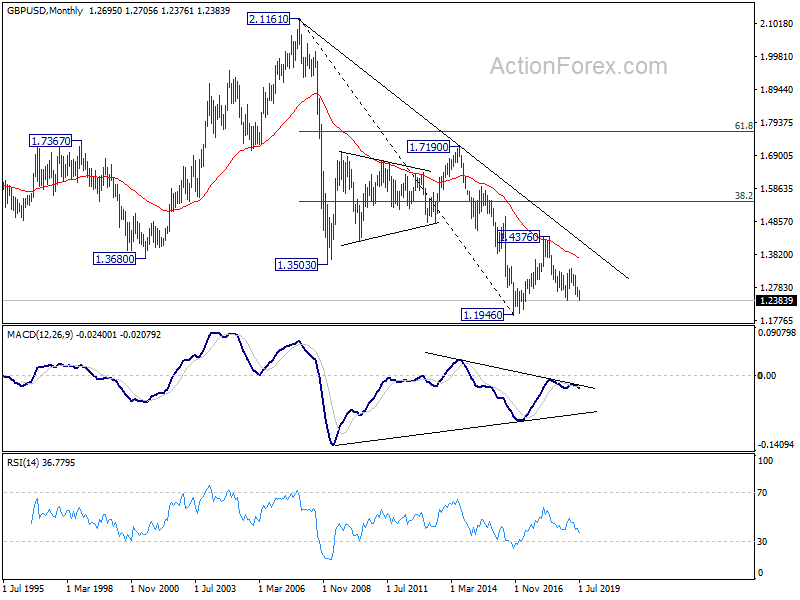
In the longer term picture, consolidative pattern from 1.1946 (2016 low) could still extend with another rising leg. But after all, decisive break of 38.2% retracement of 2.1161 (2007 high) to 1.1946 at 1.5466 is needed to indicate long term reversal. Otherwise, an eventual downside breakout will remain in favor.
USD/CHF Weekly Outlook
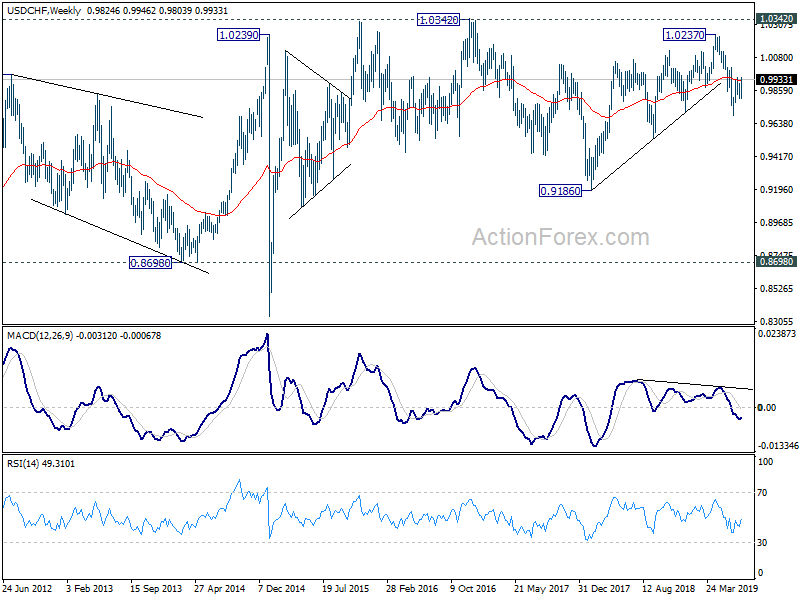
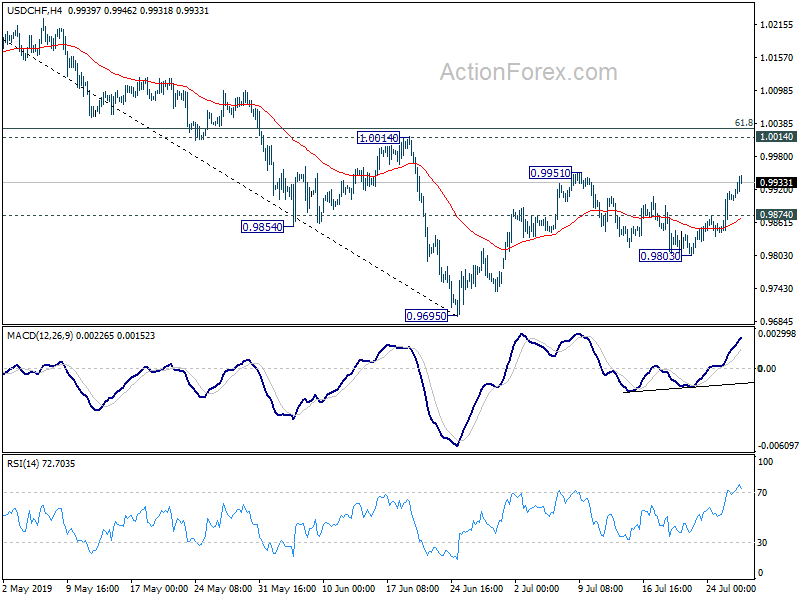
USD/CHF's strong rise last week suggest that pull back from 0.9951 has completed at 0.9803. More importantly, rise from 0.9695 is ready to resume. Initial bias stays on the upside this week. Break of 0.9951 will confirm and target 1.0014 resistance next. On the downside, break of 0.9874 minor support will turn bias back to the downside for 0.9803 support and below.
In the bigger picture, up trend from 0.9186 (2018 low) should have completed at 1.0237 already. Deeper decline would be seen to 61.8% retracement of 0.9186 to 1.0237 at 0.9587 and below. For now, USD/CHF is seen as in long term range pattern between 0.9186 and 1.0342. Hence, we'd pay attention to bottoming signal below 0.9587. However, sustained break of 1.0014 will revive medium term bullishness and turn focus back to 1.0237 high.
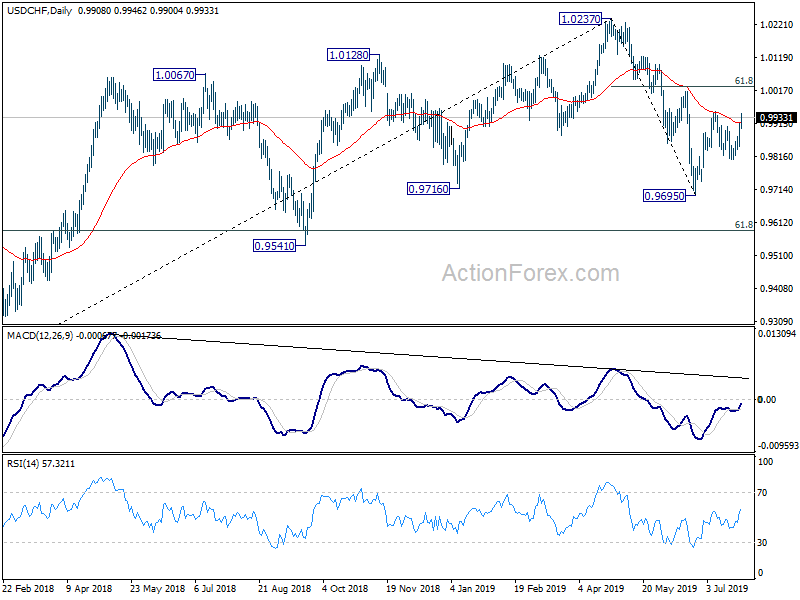
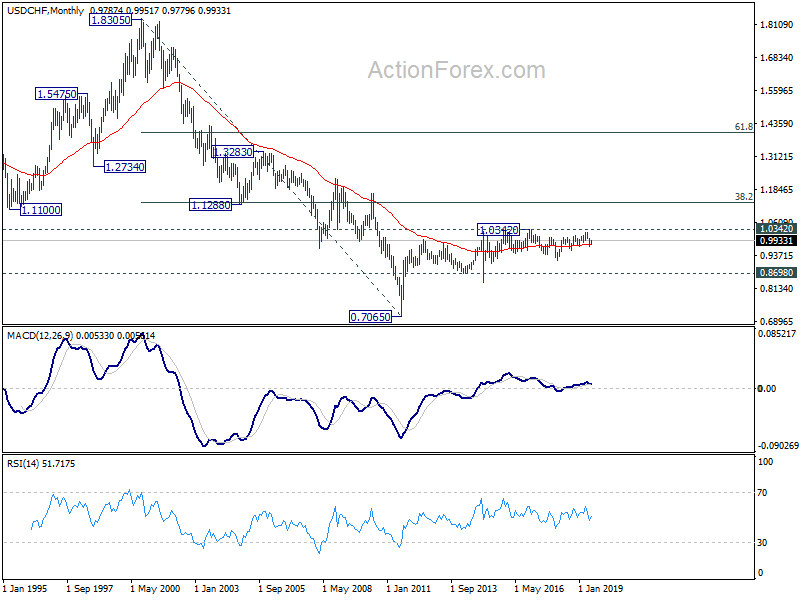
In the long term picture, price actions from 0.7065 (2011 low) are not clearly impulsive yet. Thus, we'll treat it as developing into a corrective pattern, at least, until a firm break of 1.0342 resistance.