Sample Category Title
US 500 Stock Index Records New All-Time Highs Close To 3,000
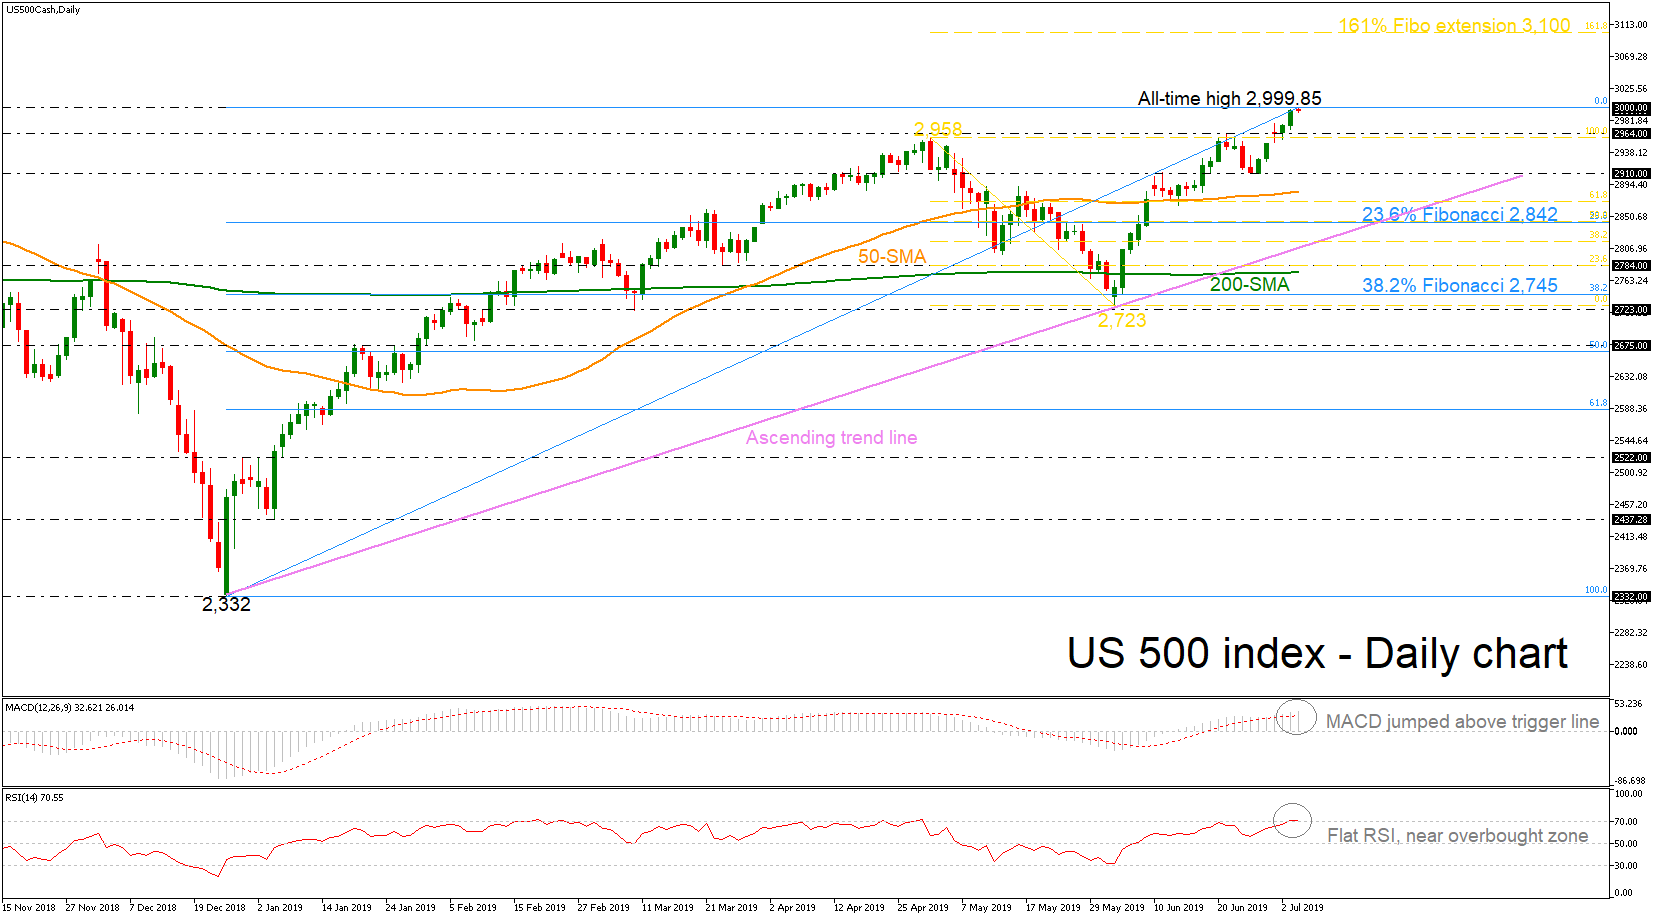
US 500 index showed a notable advance yesterday, completing a fresh all-time high around 3,000, but it ended the day in red.
The advance of the trigger line above the MACD and the bullish momentum in the indicator suggests there is some more room for improvement, while the RSI indicator seems to be flat near the overbought zone, signaling a possible overstretched market. Also, the 50- and 200-day simple moving averages (SMAs) are moving sideways despite the latest upside run.
A closing price above the 3000 psychological mark could send prices towards a new record high near the 161.8% Fibonacci extension level of the downleg from 2958 to 2723 around 3,100.
Should the market correct to the downside, the 2,964 support is coming into focus first before slipping until the 2,910 level. A more interesting battle could start near the 23.6% Fibonacci retracement level of the upleg from 2332 to 2,999.85 around 2,842, which coincides with the long-term ascending trend line.
Overall, in the bigger picture the US 500 index confirmed the upward rally from 2,332 and traders should see for more gains above 3,000. However, any decline below the 23.6% Fibo could feed speculation that a downward pattern may be on the way, with confirmation awaited around the 38.2% Fibonacci of 2,745.
Forex Technical Analysis: EUR/USD, USD/JPY, GBP/USD
EUR/USD
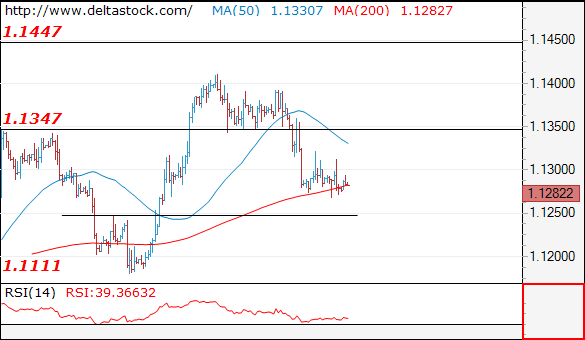
Current level - 1.1282
I favor a reversal at 1.1250, for an upswing towards 1.1350, en route to 1.1450.
| Resistance | Support | ||
| intraday | intraweek | intraday | intraweek |
| 1.1315 | 1.1570 | 1.1250 | 1.1110 |
| 1.1410 | 1.1820 | 1.1250 | 1.1010 |
USD/JPY
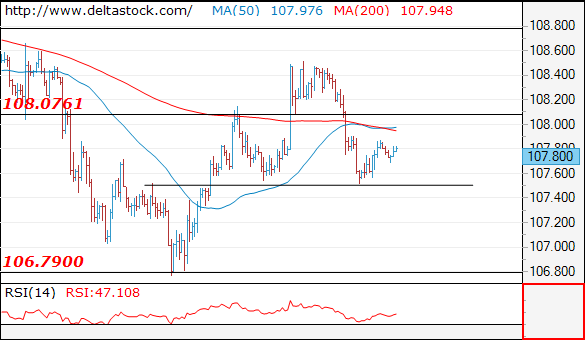
Current level - 107.80
The failure at 107.50 leads to an intraday rise, focused on 108.10 resistance
| Resistance | Support | ||
| intraday | intraweek | intraday | intraweek |
| 108.10 | 109.80 | 107.50 | 106.70 |
| 109.80 | 112.40 | 106.70 | 104.50 |
GBP/USD
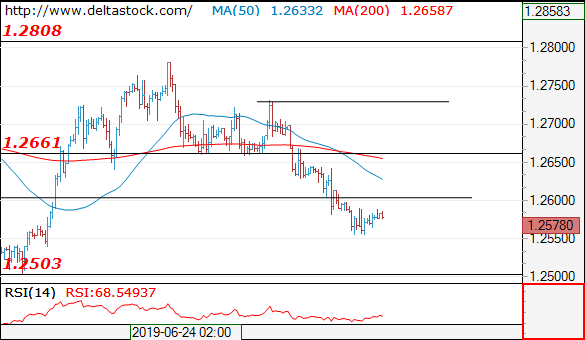
Current level - 1.2578
Initial intraday resistance lies at 1.2600, but a break through 1.2660 is needed in order to confirm a reversal of the slide since 1.2780 peak.
| Resistance | Support | ||
| intraday | intraweek | intraday | intraweek |
| 1.2660 | 1.2890 | 1.2503 | 1.2503 |
| 1.2810 | 1.3170 | 1.2503 | 1.2420 |
US Stocks Sail Into Uncharted Waters, Loonie Shines
- American equities soar to record highs, as 'bad news is good news' again
- Loonie advances to best levels this year on Fed-BoC policy divergence
- Trump calls for weaker dollar, but dollar yawns
US stocks hit new records
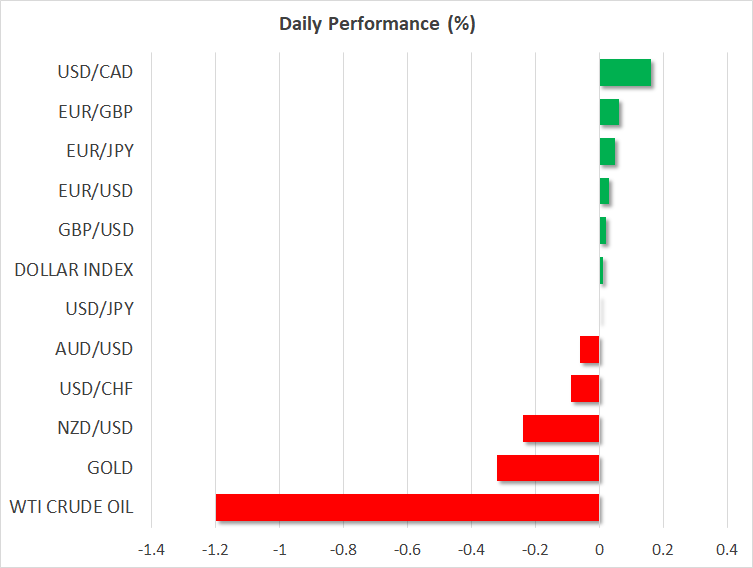
American equity markets sailed into uncharted waters yesterday, with all the major indices – the S&P 500 (+0.77%), Dow Jones (+0.67%), and Nasdaq Composite (+0.74%) – closing at new record highs. In a classic case of 'bad news is good news for stocks', the catalyst behind these gains was a batch of disappointing US data, which reinforced expectations that the Fed will act with force in reducing rates over the coming months. Lower interest rates typically boost riskier assets like stocks.
The ADP employment print for June clocked in at a mere 102k, lower than the expected 140k, igniting worries that the official payrolls number that is due tomorrow may also miss forecasts. Likewise, the ISM non-manufacturing PMI declined by more than projected to hit a two-year low, signaling that the malaise in manufacturing may have started to infect services as well.
US markets will remain closed today in celebration of Independence Day. For traders, that means liquidity will be thinner than usual, so any headline could generate a disproportionately large market impact.
Loonie shines as commodity currencies crawl higher
In the FX market, the positive equities' mood translated into a boost for the commodity currencies. The aussie, loonie, and kiwi outperformed their major peers, without much in the way of news out of those economies.
The loonie in fact touched a new high for 2019 against the dollar, supported by an uptick in oil prices and the overarching theme of policy divergence between the Fed and the Bank of Canada (BoC). Canadian data have been strong lately, in contrast to other developed economies, which puts the BoC in the odd situation of being the only major central bank not about to cut rates. That could make the loonie much more attractive from a relative rates viewpoint, implying that the currency may still have a lot of room to appreciate from here.
Trump hammers on about currency manipulation, dollar yawns
The American president made headlines again on Wednesday, after he tweeted: “China and Europe playing big currency manipulation game”, adding that the US should “match” what they are doing. Admittedly, this is not anything new from Trump – he has made many similar comments on currency manipulation despite the US Treasury not labeling those economies as manipulators.
What stands out though is the comment that the US should “match”, which is effectively a call for a weaker dollar, likely aimed at the Fed. The greenback fell slightly on the news but recovered almost immediately to close the session nearly flat against a basket of six major currencies.
GBP/JPY Daily Outlook
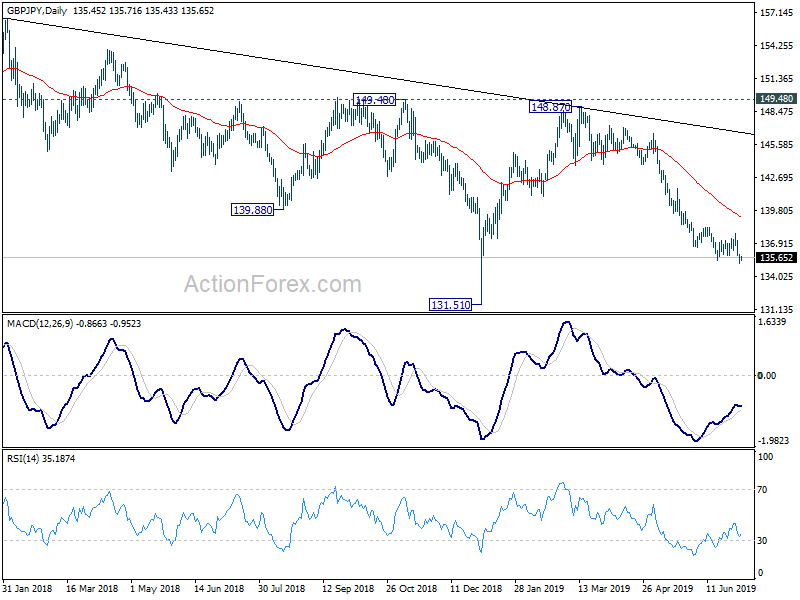
Daily Pivots: (S1) 135.20; (P) 135.56; (R1) 135.94; More...
Intraday bias in GBP/JPY remains on the downside at this point. Recent fall from 148.87 has just resumed and further fall should be seen to 131.51 low next. On the upside, break of 137.78 resistance is needed to indicate short term bottoming. Otherwise, outlook will remain bearish in case of recovery.
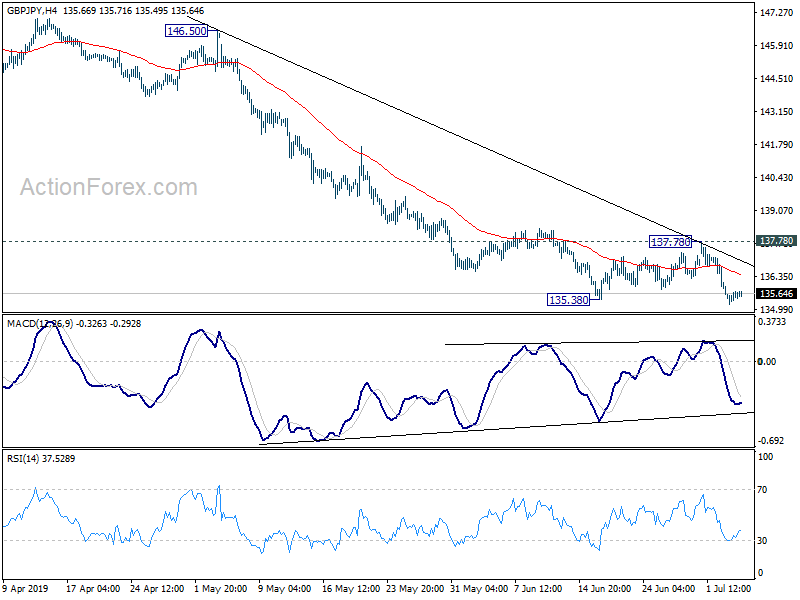
In the bigger picture, current development suggests that GBP/JPY's medium term fall from 156.59 (2018 high) is still in progress. Break of 131.51 will target 122.36 (2016 low). Structure of such decline is corrective looking so far, arguing that it's just the second leg of consolidation from 122.36. Thus, we'd expect strong support from 122.36 to contain downside to bring reversal.
LTCUSD Under Key Support
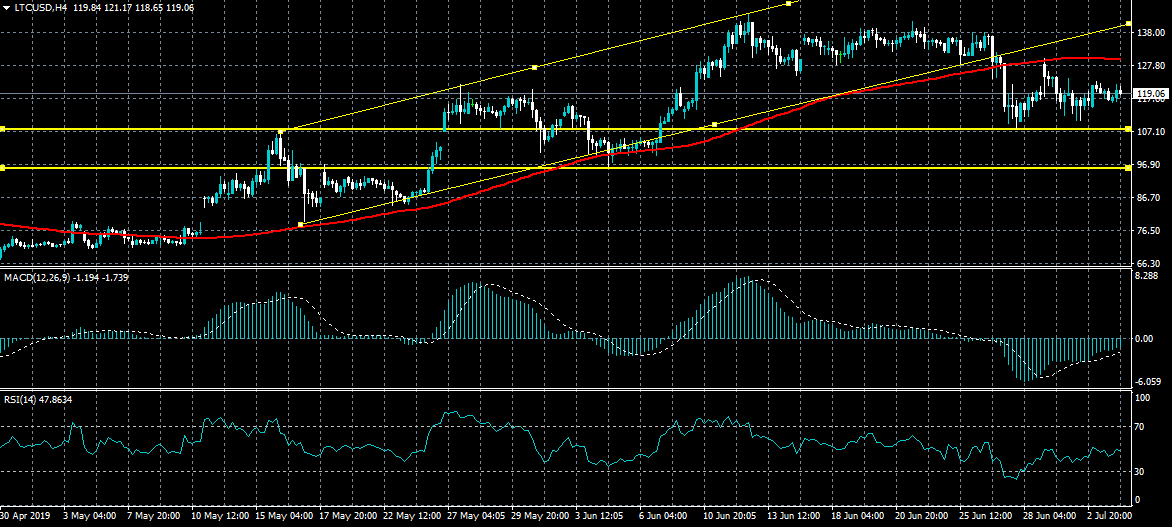
Litecoin continues to struggle to find a directional bias in early Thursday trade, with the LTUSD pair trapped between the $125.00 to $110.00 levels. The four-hour time frame shows that a bearish head and shoulders pattern with a $20.00 downside projection still remains valid. A move above the $125.00 level may prompt buying interest back towards the important $40.00 level.
The LTCUSD pair is only bullish while trading above the $125.00 level, key resistance is found at the $140.00 and $160.00 levels.
If the LTCUSD pair trades below the $125.00 level, key support is found at the $110.00 and $95.00 levels.
EUR/JPY Daily Outlook
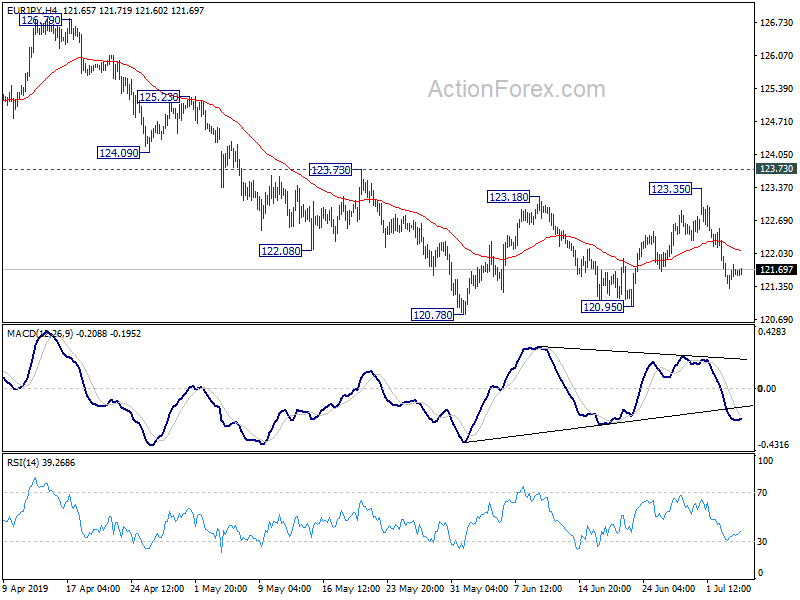
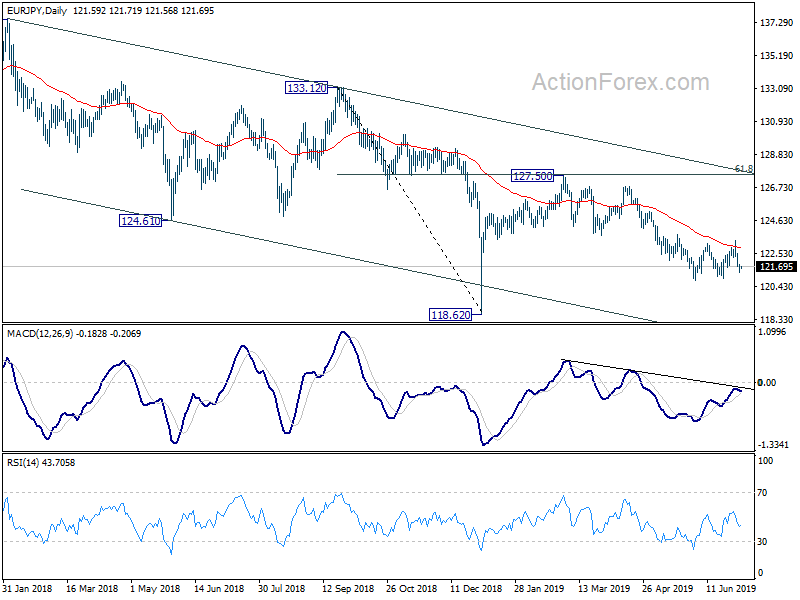
Daily Pivots: (S1) 121.21; (P) 121.71; (R1) 122.09; More....
Intraday bias in EUR/JPY remains mildly on the downside for the moment. Consolidation pattern from 120.78 should have completed with three waves to 123.35. Decisive break of 120.78 low will resume larger fall from 127.50 to 118.62 low next. On the upside, in case of another rise, upside should be limited below 123.73 to bring down trend resumption.
In the bigger picture, down trend from 137.49 is still in progress with the cross staying inside long term falling channel. Break of 118.62 will extend the fall to 109.48 (2016 low). On the upside, break of 127.50 resistance is needed to be the first sign of medium term reversal. Otherwise, outlook will remain bearish in case of strong rebound.
GBPUSD 1.2548 Interm Support
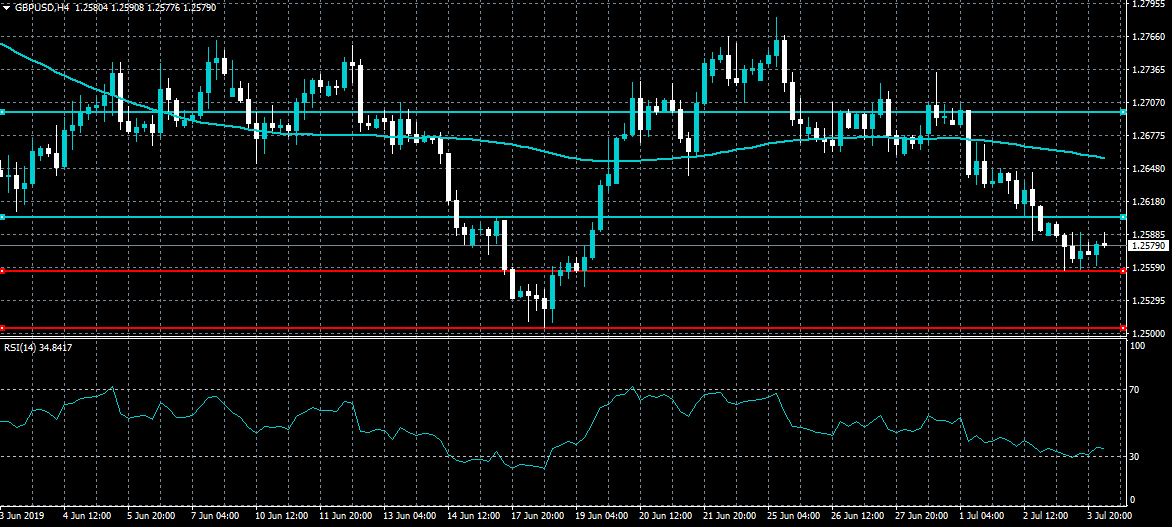
The British pound continues to trade below the 1.2600 level against the US dollar in early Thursday trade, with the pair suffering three days of consecutive losses. The 1.2548 level is now interim support, with the 1.2505 level major weekly support for the GBPUSD pair. The four-hour time frame shows that a bullish inverted head and shoulders pattern is close to being invalidated.
The GBPUSD pair is bearish while trading below the 1.2610 level, key support is found at the 1.2548 and 1.2510 levels.
GBPUSD pair is only bullish while trading above the 1.2610 level, key resistance is found at the 1.2660 and 1.2700 levels.
EURUSD Testing Support
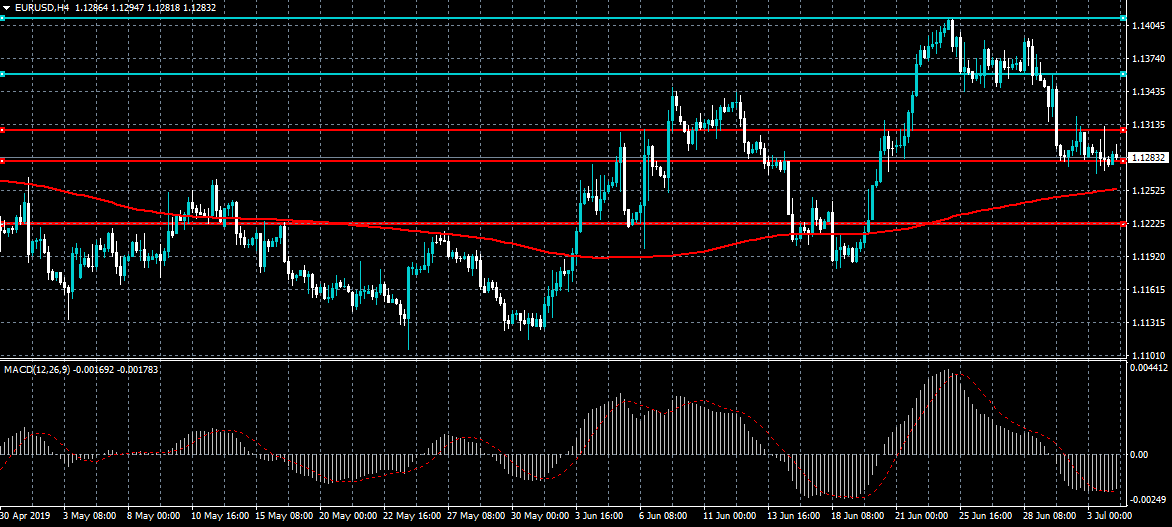
The euro currency is testing towards the worst levels of the month against the US dollar, following more technical rejections from the 1.1300 resistance level. The four-hour time frame shows that a sustained break under the 1.1280 level is needed to provoke the next round of EURUSD selling. Key bearish targets under the 1.1280 level remain the 1.1255 and 1.1222 support regions.
The EURUSD pair is only bullish while trading above the 1.1310 level, key technical resistance is found at the 1.1355 and 1.1400 levels.
If the EURUSD pair trades below the 1.1280 level, key support is found at the 1.1255 and 1.1222 levels.
Wall Street Soars As Investors Brace For Weaker Monetary Policy
Wall Street ended the day at record highs as investors cheered the prospect of a weaker monetary policy among the world’s largest banks. The S&P 500 ended the day 5 points below the important psychologically-important level of $3,000. The rally in US stocks also continued in the Asian session, where the Hang Seng and Nikkei rose by 22 and 26 points respectively. With the US markets closed today, the rally in US stocks will determine on the jobs numbers that will be released tomorrow. In a preview, data from ADP showed that the US private companies added 102k jobs in June.
The US dollar was relatively unmoved after ADP released its reading on US employment in June. The initial jobless claims rose by 221k while the continuing jobless claims increased to 1,686k. In June, exports increased to $210k while imports increased to $266k, leading the trade deficit to widen by more than $55 billion. This is a testament of how hard it is for the US to reduce its deficit. The ISM non-manufacturing PMI declined to 55.1 from the previous 56.9 while factory orders declined by -0.7%. The non-manufacturing business activity dropped to 58.2 from the previous 61.2. Weak data from the US show that the country is getting bruised in the ongoing trade conflict.
The price of crude oil moved lower as investors focused on the crude oil inventories data from the US. Yesterday, data from the EIA showed that the inventories declined by more than 1.085 million barrels. This was a slight decline compared to the previous week’s 12.78 million barrels. It was also lower than the 2.96 million barrels that traders were expecting. Meanwhile, gasoline inventories declined by 1.58 million barrels while the national gas storage increased to 89B. These numbers came after the OPEC+ cartel agreed to extend the limits on production.
EUR/USD
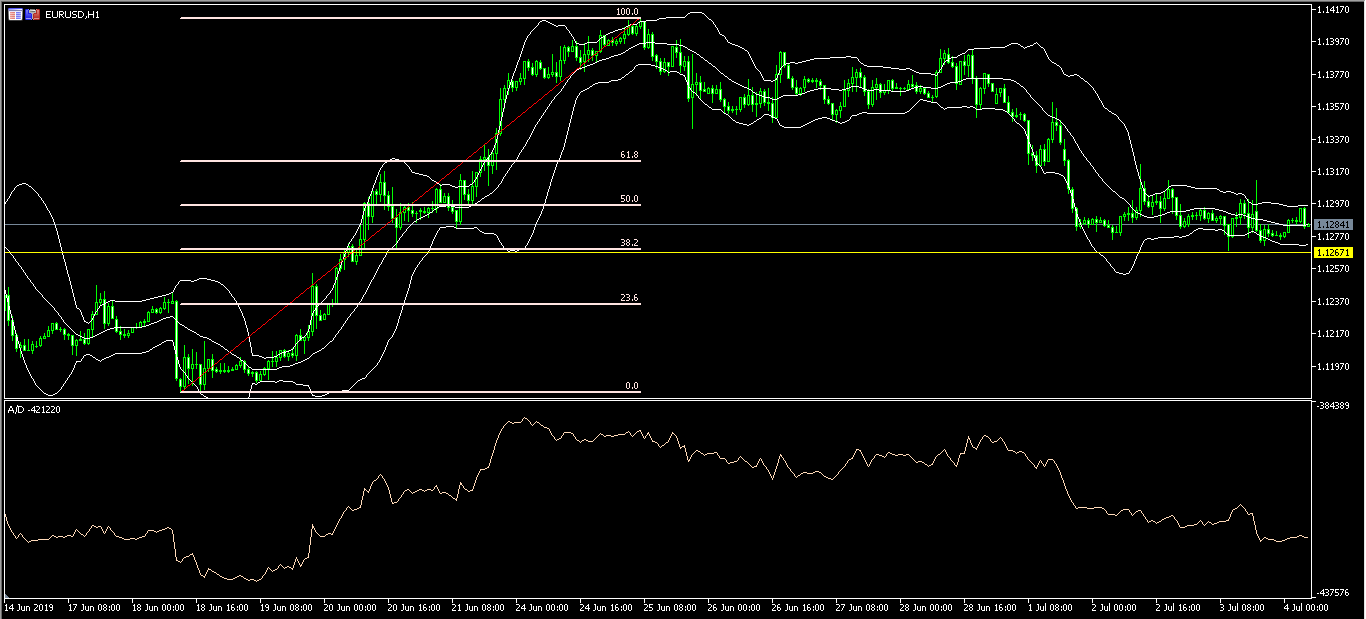
The EUR/USD pair was relatively unchanged in the Asian session and is now trading at the 1.1283 level. The price is between the 50% and 38.2% Fibonacci Retracement level and along the middle line of the Bollinger Bands. The accumulation/distribution indicator has been moving lower. With no major economic data expected today, and with the US markets closed, the pair could remain in the holding pattern ahead of the US jobs numbers expected tomorrow.
USD/JPY
The USD/JPY pair was relatively unchanged in the Asian session. It is now trading at 107.76, which is along the 50% Fibonacci Retracement level. The price is also below the 25-day and 50-day moving averages while the on balance volume has been moving lower. With the pair consolidating, it is likely that it will break out in either direction after the US data is released.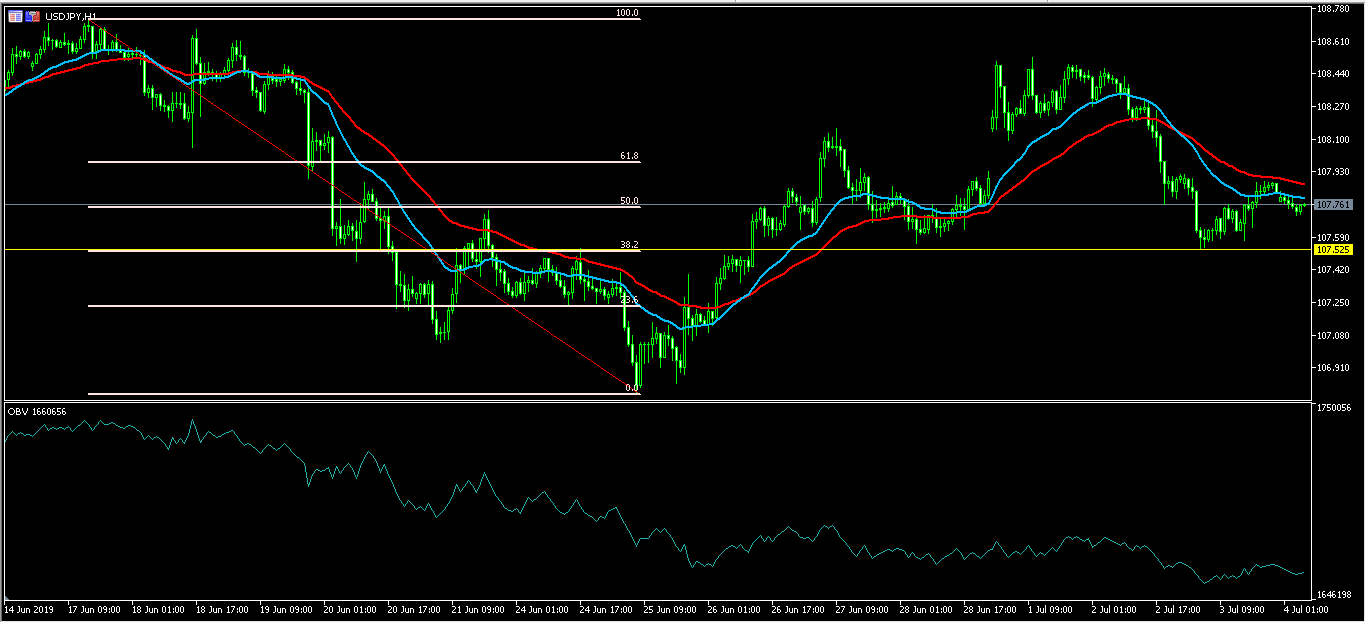
XBR/USD
The XBR/USD pair declined to a low of 63.20 after the US inventories data. On the hourly chart, the pair is trading slightly above the 50% Fibonacci Retracement level. It is along the middle line of the Bollinger Bands while the moving average oscillator has moved slightly lower. The pair is likely to continue moving lower to test the 61.8% Fibonacci Retracement level of 61.90.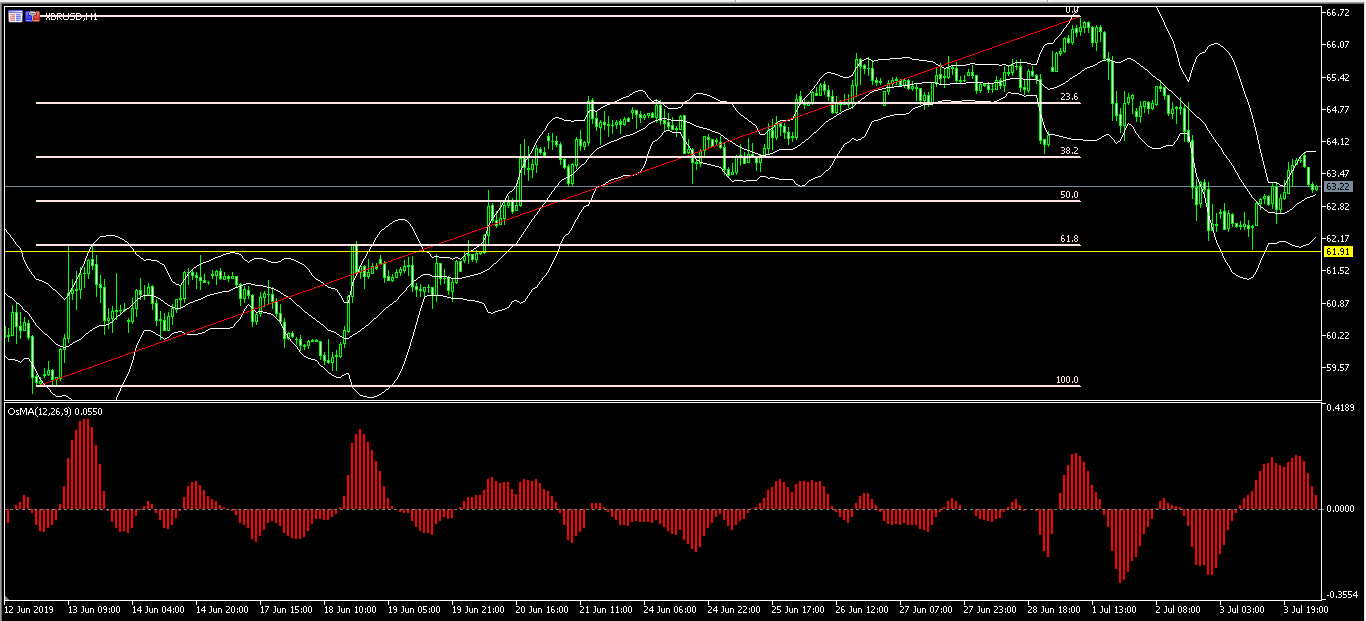
EUR/GBP Daily Outlook
Daily Pivots: (S1) 0.8955; (P) 0.8972; (R1) 0.8987; More...
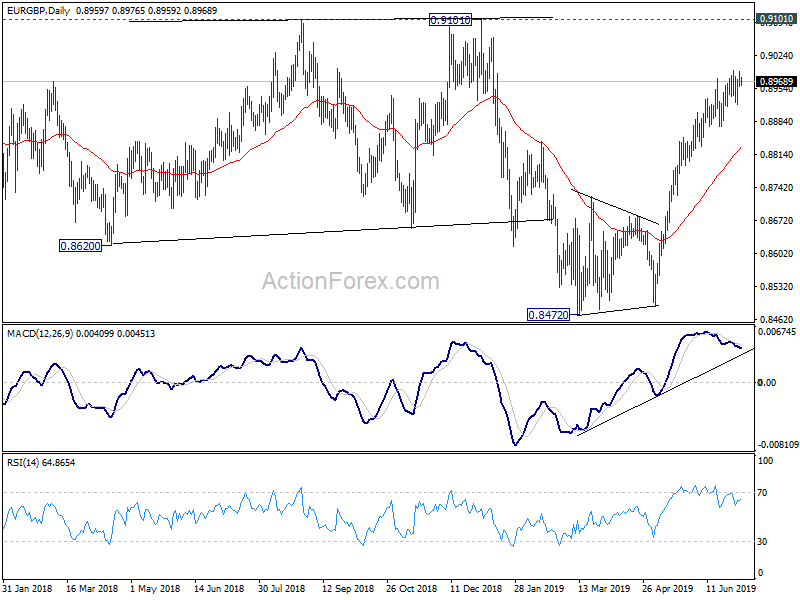
EUR/GBP is staying in consolidation from 0.8992 and intraday bias remains neutral. Outlook is unchanged and further rise is expected as long as 0.8872 resistance holds. But considering bearish divergence condition in 4 hour MACD, we'd look for topping signal as it approaches 0.9101 key resistance. On the downside, break of 0.8872 will indicate short term topping. Deeper pull back could be seen to 55 day EMA (now at 0.8830) first.
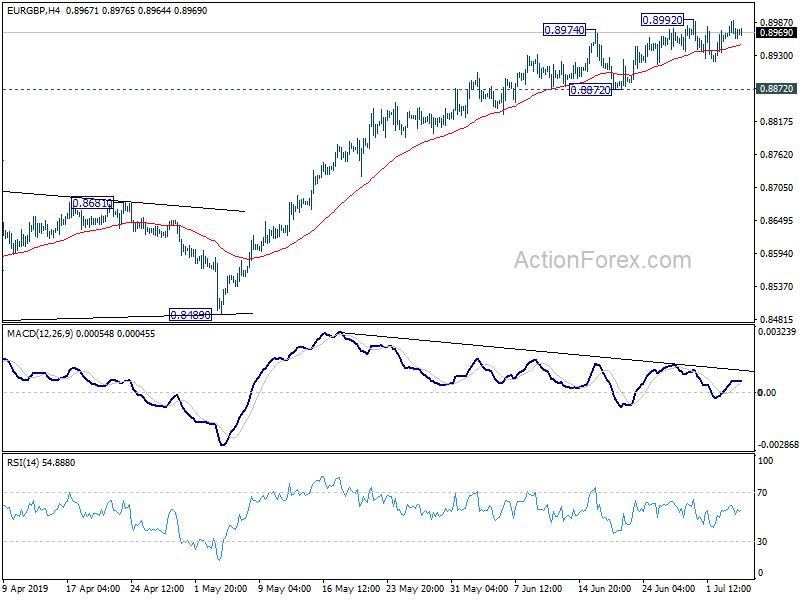
In the bigger picture, medium term decline from 0.9305 (2017 high) is seen as a corrective move. No change in this view. Current development argues that it might have completed with three waves down to 0.8472, just ahead of 38.2% retracement of 0.6935 (2015 low) to 0.9306 at 0.8400, after hitting 55 month EMA (now at 0.8527). Decisive break of 0.9101 resistance will confirm this bullish case. Nevertheless, as EUR/GBP is still staying inside long term falling channel, correction from 0.9305 could still extend to 0.8400 fibonacci level before completion, if upside is rejected by 0.9101.