Sample Category Title
EUR/AUD Daily Outlook
Daily Pivots: (S1) 1.5989; (P) 1.6078; (R1) 1.6130; More...
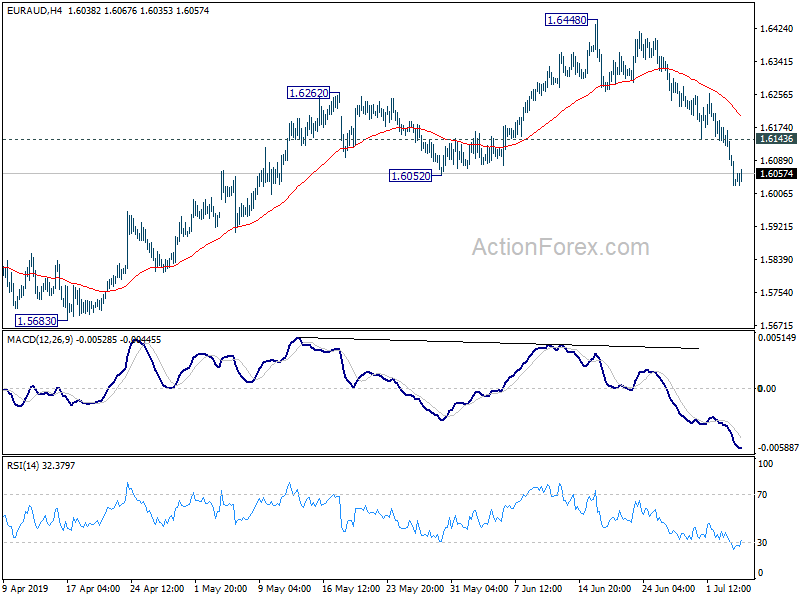
EUR/AUD's fall from 1.6448 is deeper than originally expected. Break of 1.6052 support suggests that rebound from 1.5683 has completed at 1.6448. Intraday bias is back on the downside for 1.5683 next. On the upside, above 1.6143 minor resistance will turn intraday bias neutral and bring recovery first.
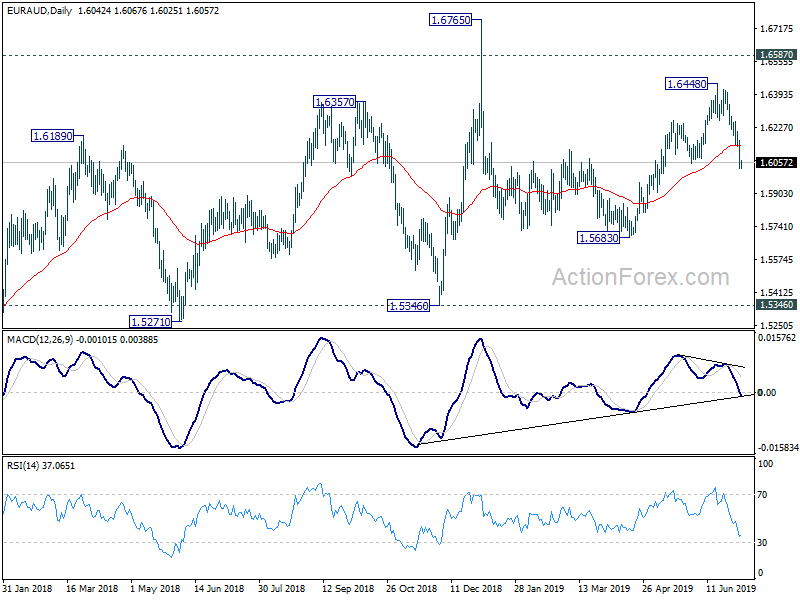
In the bigger picture, as long as 1.5346 support holds, outlook will still remain bullish. Up trend from 1.1602 (2012 low) is expected to resume sooner or later. Break of 1.6765 will target 61.8% retracement of 2.1127 (2008 high) to 1.1602 at 1.7488 next. However, firm break of 1.5346 key support will indicate trend reversal and turn outlook bearish.
The Worse, The Better: Hope For The Central Bank Stimulus Is Fuelling Market Growth
Markets switched to a mode that can be briefly described as “the worse, the better.” On Wednesday, the indices updated highs on the rather weak US macroeconomic data. Trade deficit rose to the highest levels this year, while Non-Manufacturing ISM fell to its lowest level in almost two years. June's ADP data noted an increase in the private sector employment by 102K – after 42K the previous month. This is much weaker than expectations (140K), reflecting a clear loss in employment growth in recent months. It may also hint to a weak official report, set to be published this coming Friday.
The markets are convinced that the largest central banks will come to the rescue in time. Christine Lagarde, appointed as the new Head of the ECB, is expected to maintain the position of economic stimulus. In addition, Trump has nominated two candidates – for positions in the Fed – that are inclined to a soft monetary policy, which also increases the chances of easing and supports the demand in the stock markets and puts pressure on the yield of long-term treasuries.
Stocks
On the stock markets, investors continue to look for yielding assets, which reinforces the purchase of shares and gold. The Dow Jones and S&P500 closed at historic highs during a shortened trading session on Wednesday. European Euro50 finished the day at the highest levels of the last 14 months.
On Thursday, due to the holiday in the United States, trading activity is expected to be suppressed, forcing it to focus on Friday's data on the US labour market. Currently, SPX is close to the psychologically important round mark of 3000, and Dow Jones is just shy of 27,000. By breaking through these levels, buyers can be inspired to proceed.
EURUSD
Bulls did not leave attempts to move forward above 1.1300 on Wednesday. American statistics strengthened speculation about the imminent rate cut, which put pressure on the dollar quotes. However, EURUSD was actively selling above 1.1300. Also pay attention to the lower intraday highs and lows in the pair during the last week, which reflects the strengthening position of sellers. Further pressure could be placed on the single currency rate if the ECB, as expected, does not linger with new stimulus.
Gold Trades Below Key Resistance Zones
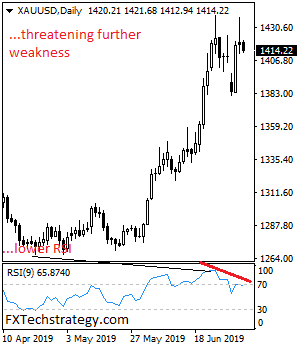
GOLD trades below key resistance zones as it looks to follow through lower on the back of its price rejection. On the downside, support comes in at the 1,408.00 level where a break will turn attention to the 1,400.00 level. Further down, a cut through here will open the door for a move lower towards the 1,390.00 level. Below here if seen could trigger further downside pressure targeting the 1,380.00 level. Its daily RSI is bearish and pointing lower suggesting more weakness. Conversely, resistance resides at the 1,420.00 level. Further out, resistance resides at the 1,430.00 level where a break will aim at the 1,440.00 level. A turn above there will expose the 1,450.00 level. Further out, resistance stands at the 1,460.00 level. All in all, GOLD looks to weaken further on corrective pullbacks.
The US NFP Data And What To Expect
European trading action is expected to remain reticent today as the biggest market in the world, the US, is closed to celebrate the 4th of July. Trading over in Asia has also been somewhat quiet as traders await the next action by the Federal Reserve. Of course, the market expectations are that the Fed is likely to make a U-turn with respect to their monetary policy. There is no doubt that everything is very much data dependent and the Fed has made this clear from day one, and it is in this essence, that this week’s economic numbers are of significant importance.
Yesterday, the US payroll economic numbers increased less than the market expectations. The US Private payroll number increased nearly 102K while the market expectations were 135K. This number sets the stage for the mother of all data, the US NFP (which matter the most for the Fed). Looking at economic numbers released so far, the short bets on the dollar index have eased off, despite the fact that the market isn’t expecting a solid number at all on Friday.
The Fed cannot afford any kind of economic risk to the economy. It will derail all the hard work done by them. We have strong evidence for the economic recovery to halt if there is no help provided by the Fed.
Having said this, there is always an argument that how the economy can stall when the stock market has been hitting record. Well, the stock market has been running on something which I call “Hopium”- there is just a lot of hope among traders that the Fed is going to be aggressive in cutting the interest rate in order to provide that extra help.
This is mainly due to the difference in expectation between the Fed and market. The market is also more optimistic in relation to the upcoming dovish monetary policy members because president Trump is determined to push two more new members (of his choice) in the Federal Reserve committee who will help to shape the dovish monetary policy. Christopher Waller and Judy Shelton are the top choices by the president as per his recent tweet.
Going back to the main agenda, the US NFP data (due tomorrow), the payroll growth for this year has seen a major downtrend, currently sitting at 17 month low of 174.5K. on the flip side, the ISM manufacturing data for the month June, another important indicator for the US NFP, confirmed that the employment index isn’t under s major threat. It rose to 54.5 in June and touched three month high. The index is now above the 6-month average. The recent data from the Fed Beige Book suggest strong employment growth and the labour market is also tight. In addition to this, the NFIB survey says that a large number of firms cannot fill in the jobs mainly due to shortage of workers with right skills.
Furthermore, the labour participation rate is at 62.8%, and the hope is that new workers will enter into the job market due to the rising wage growth. However, the evidence to support this argument hasn't proven its track record for some time now.
From a trading perspective, it will be worth keeping an eye on the gold price. Since 30th May, it has been rising sharply and ever since we have not seen the price turning back (with the exceptions of a few retracements which have proven themselves a healthy opportunity to join the trend).
If the upcoming US NFP headline number stays above the 130K, it means that the jobs market is robust. Firms outside the manufacturing department are keen to recruit more workers and this mean the wage growth may continue to grind higher. The average hourly number is expected to rise from 0.2% to 0.3% and the unemployment number is expected to rise.
The combination of the above is likely to push the Fed’s hand to introduce an interest cut in July and this could be 25 basis points. As long as the gold price stays above the 1380 mark, the long term trend will remain intact.
EUR/CHF Daily Outlook
Daily Pivots: (S1) 1.1109; (P) 1.1123; (R1) 1.1138; More....
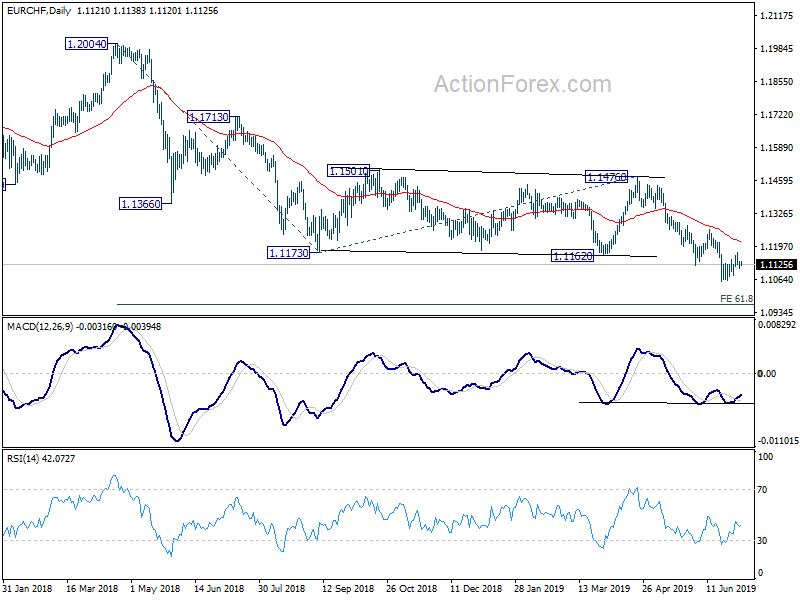
EUR/CHF is staying in consolidation from 1.1056 and intraday bias remains neutral for the moment. In case of another recovery, upside should be limited below 1.1264 resistance to bring fall resumption. On the downside, break of 1.1056 will extend the larger down trend for 61.8% projection of 1.2004 to 1.1173 from 1.1476 at 1.0962 next.
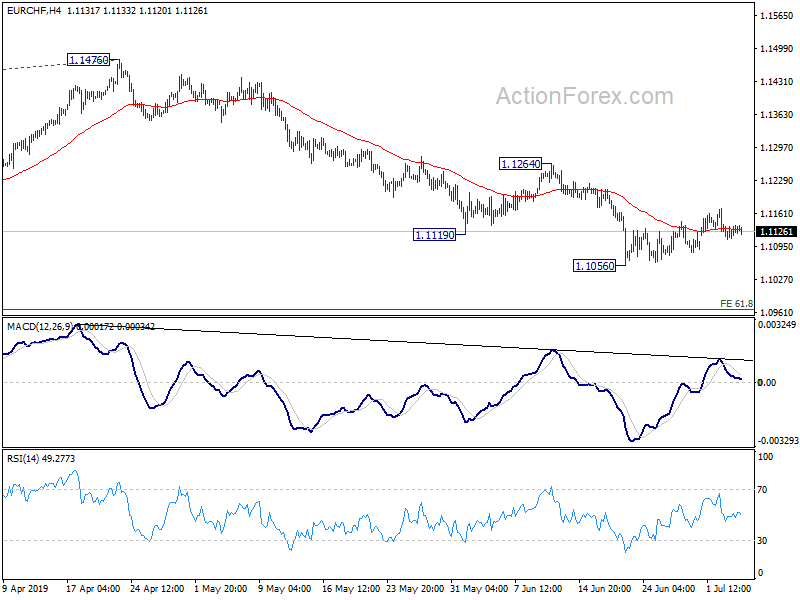
In the bigger picture, current development firstly suggests that down trend from 1.2004 is still in progress. More importantly, it's likely a long term down trend itself, rather than a correction. Outlook will remain bearish as long as 1.1476 resistance holds. EUR/CHF could target 1.0629 support and below.
AUD/USD Stabilizes After Yesterday’s Rally
The Aussie strengthened against the USD yesterday, marking a two-month high, however stabilized during the Asian session. The rally occurred as media report that the Australian government seems to be close in getting the necessary votes to pass a tax cut legislation. It should be noted that the US President overnight had accused China and the EU of playing a “big currency manipulation game”. In addition to that, White House economic advisor Kudlow mentioned that the US would not be lifting tariffs on Chinese products during trade talks. White House officials stated that talks are already underway. On the other hand, Australia’s retail sales growth rate accelerated, showing growth again, despite narrowly missing its target and pushed the AUD somewhat higher, albeit for a short period of time. We maintain the view that the AUD is to remain data driven, yet we would not be surprised to see fundamentals about the US-Sino relationships affecting it once again. AUD/USD continued its rise yesterday, breaking the 0.7000 (S1) resistance line, now turned to support. We maintain a bullish outlook for the pair, as the upward trendline incepted since the 2nd of July, seems to continue to guide the pair’s direction. Should the pair find fresh buying orders along its path, we could see it breaking the 0.7065 (R1) resistance line and aim for higher grounds. Should the pair come under the selling interest of the market, we could see it breaking the prementioned upward trendline, as well as the 0.7000 (S1) support line and aim for 0.6925 (S2) support level.
Bitcoin rises even further
Bitcoin has risen sharply in the last 24 hours, especially in today’s Asian session, breaking the 11500 psychological threshold. There does not seem to be any clear fundamental reasoning yet, behind yesterday’s rally and some speculation maybe in play. Never the less, the cryptocurrency’s bulls were once again full at play and a positive sentiment is surrounding Bitcoin. Should actually the only fuel being provided for the crypto’s rise be the positive feeling of the market, we would maintain our reservations about its course, as it might easily be changed. Please note that there is lots of talk, yet only a few actually walk in the crypto market, with volatility threatening to tumble the crypto once again. Once again, should the positive sentiment continue to dominate the crypto market, we could see Bitcoin rising even further. Bitcoin rose yesterday, breaking the 11580 (S1) resistance line, now turned to support. We maintain a bullish outlook for the crypto currency, as the upward trendline remains intact since the 2nd of July. Should the bulls maintain control over Bitcoin’s direction, we could see it breaking the 12360 (R1) resistance line. Should the bears take over, we could see Bitcoins’ price action, breaking the prementioned upward trendline, the 11580 (S1) support line and aim for lower grounds.
Other economic highlights, today and early tomorrow
It’s expected to be a slow day today as the US market’s will be closed for the 4th of July public holiday and there are only a few high impact financial releases available. Please bear in mind that due to the holiday, thin trading risks may rise especially during the American session. During the European session, we get Eurozone’s retail sales growth rate for May, and during tomorrow’s Asians session, we get Japan’s household spending rate also for May. As for speakers, ECB’s Lane, De Guidos and Enria are scheduled to speak.
AUD/USD H4
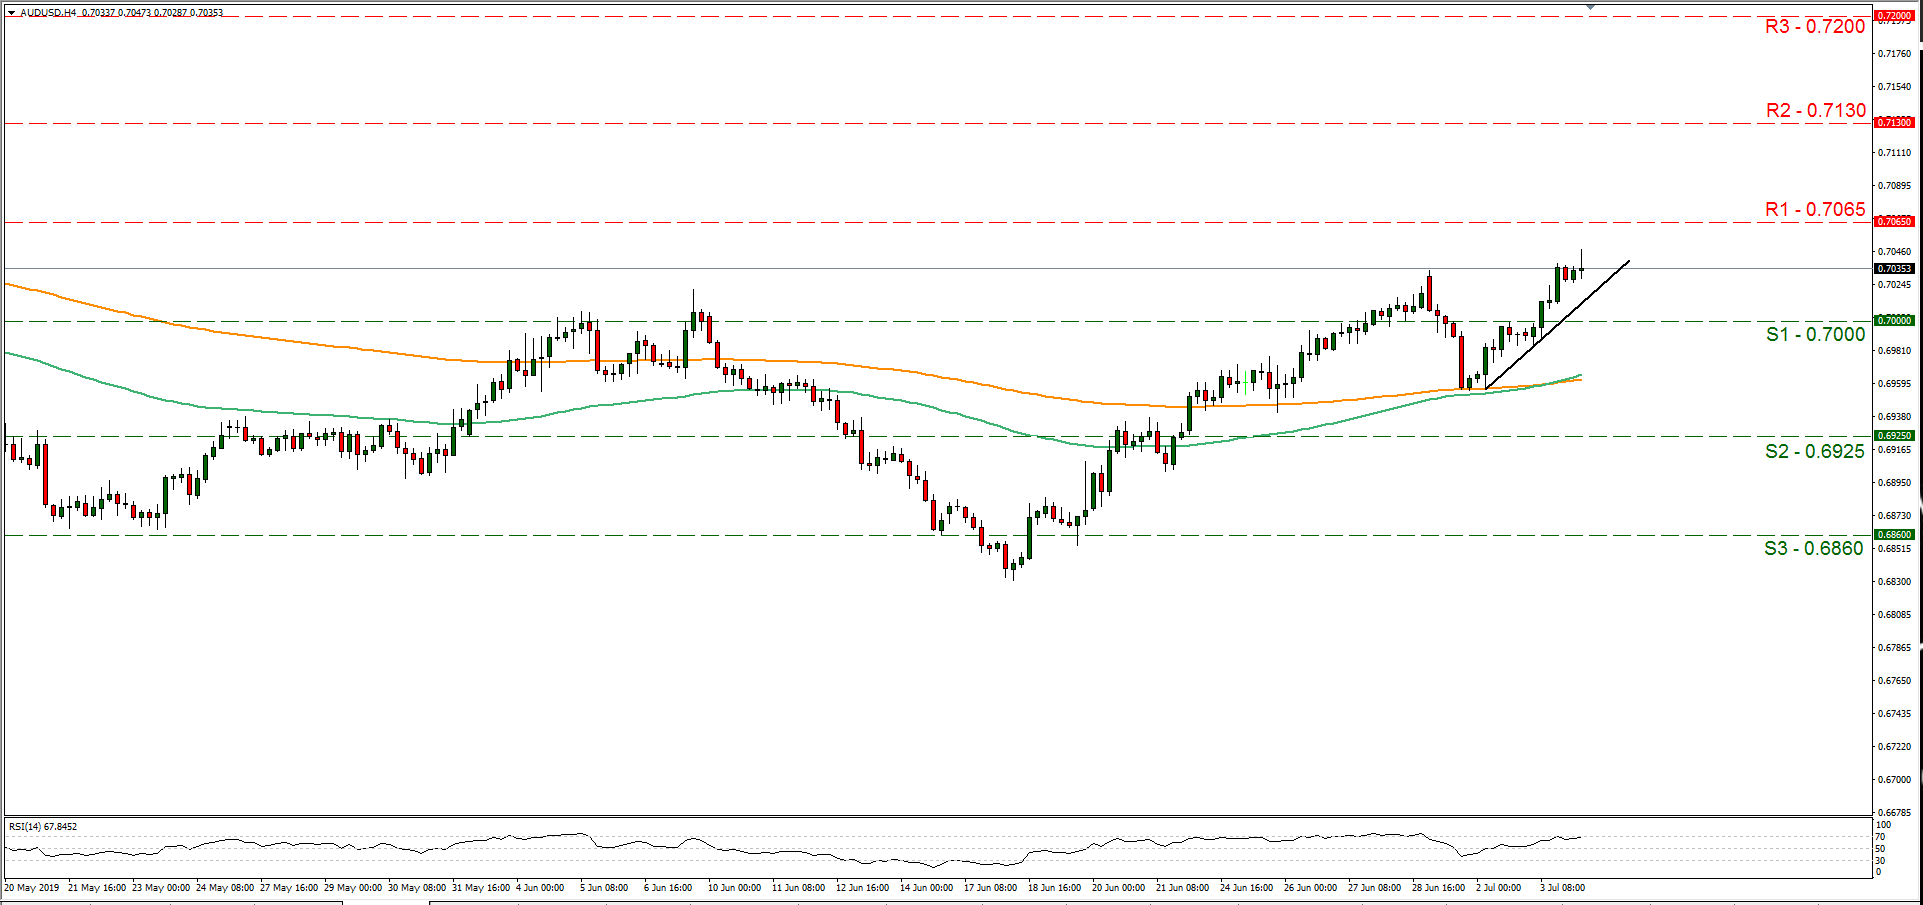
Support: 0.7000 (S1), 0.6925 (S2), 0.6860 (S3)
Resistance: 0.7065 (R1), 0.7130 (R2), 0.7200 (R3)
Bitcoin H4
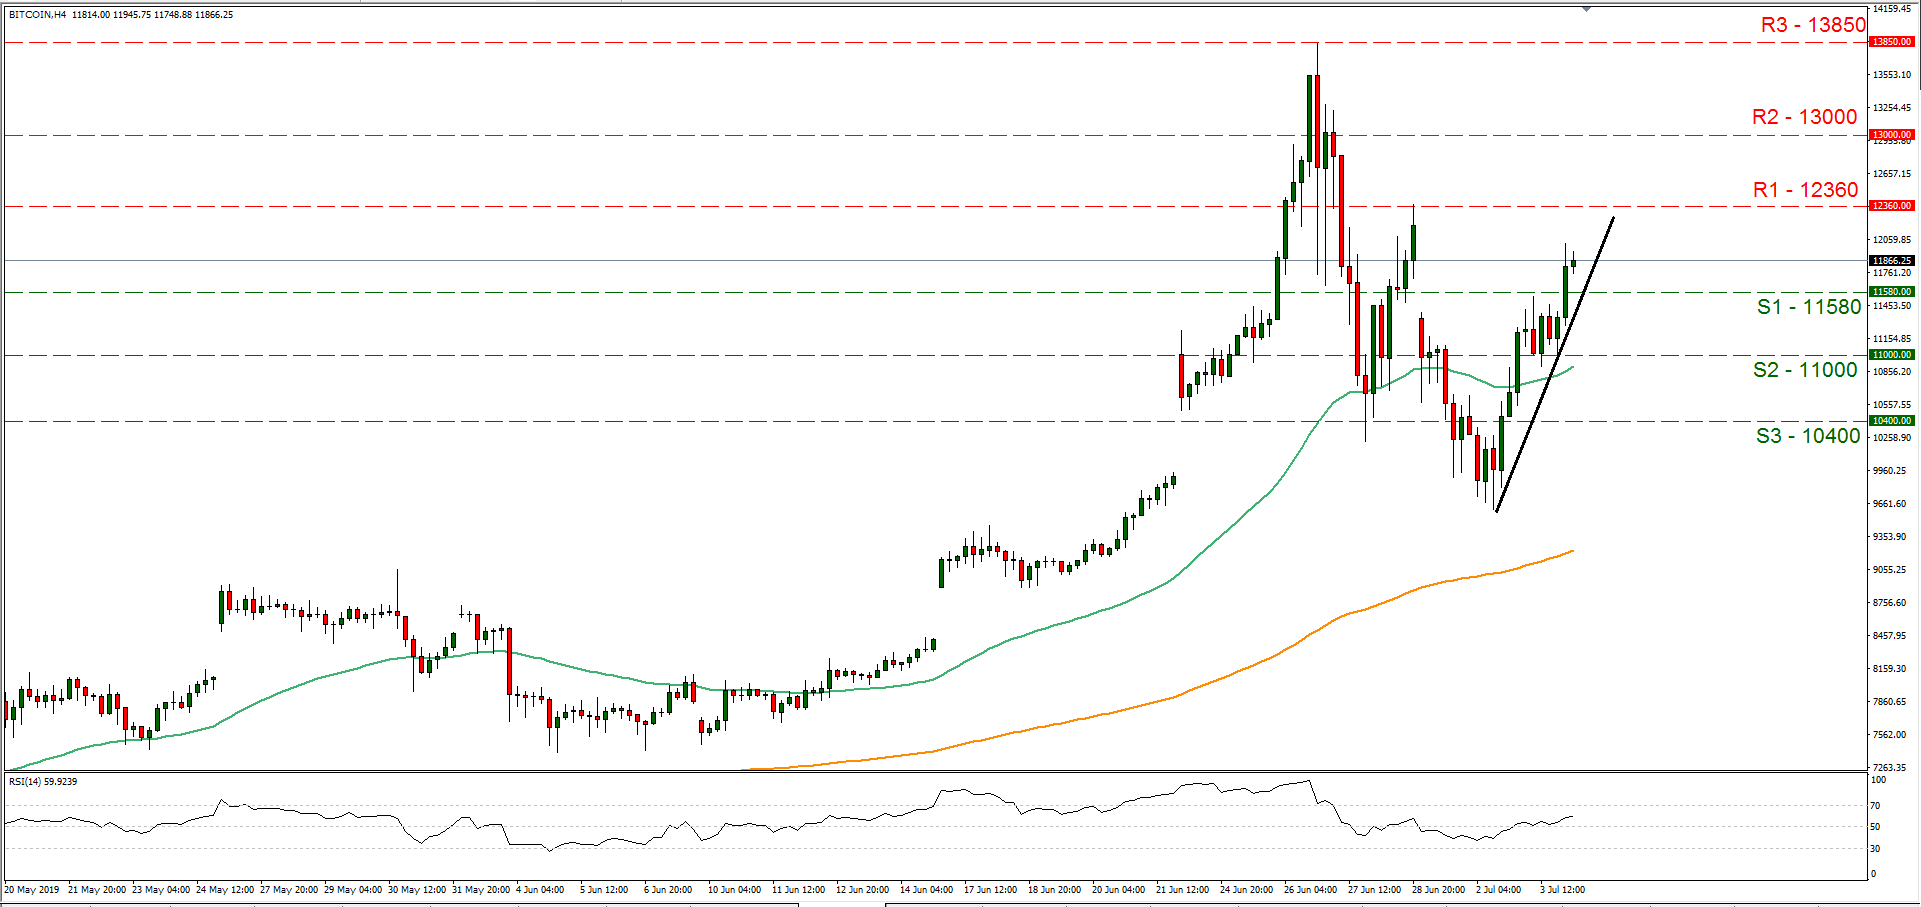
Support: 11580 (S1), 11000 (S2), 10400 (S3)
Resistance: 12360 (R1), 13000 (R2), 13580 (R3)
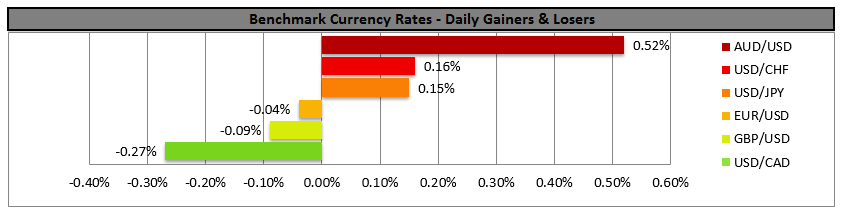
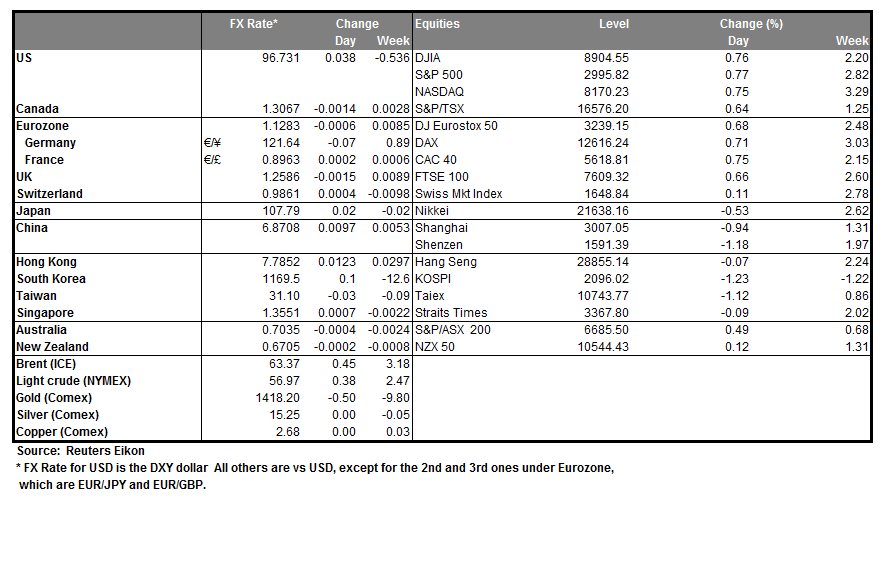
The Analytical Overview Of The Main Currency Pairs
The EUR/USD currency pair
Technical indicators of the currency pair:
Prev Open: 1.12841
Open: 1.12776
% chg. over the last day: -0.03
Day's range: 1.12776 - 1.12951
52 wk range: 1.1111 - 1.2009
EUR/USD continues to consolidate. There is no defined trend. The local support and resistance levels are 1.12750 and 1.13100. Financial market participants took a wait-and-see attitude until the US labor market report for June, which will be published on Friday July 5th. Today trading activity and volatility may be reduced due to the celebration of Independence Day in the United States. We recommend to open positions from key levels.
At 12:00 (GMT + 3:00) the EU will publish a report on the volume of retail sales.
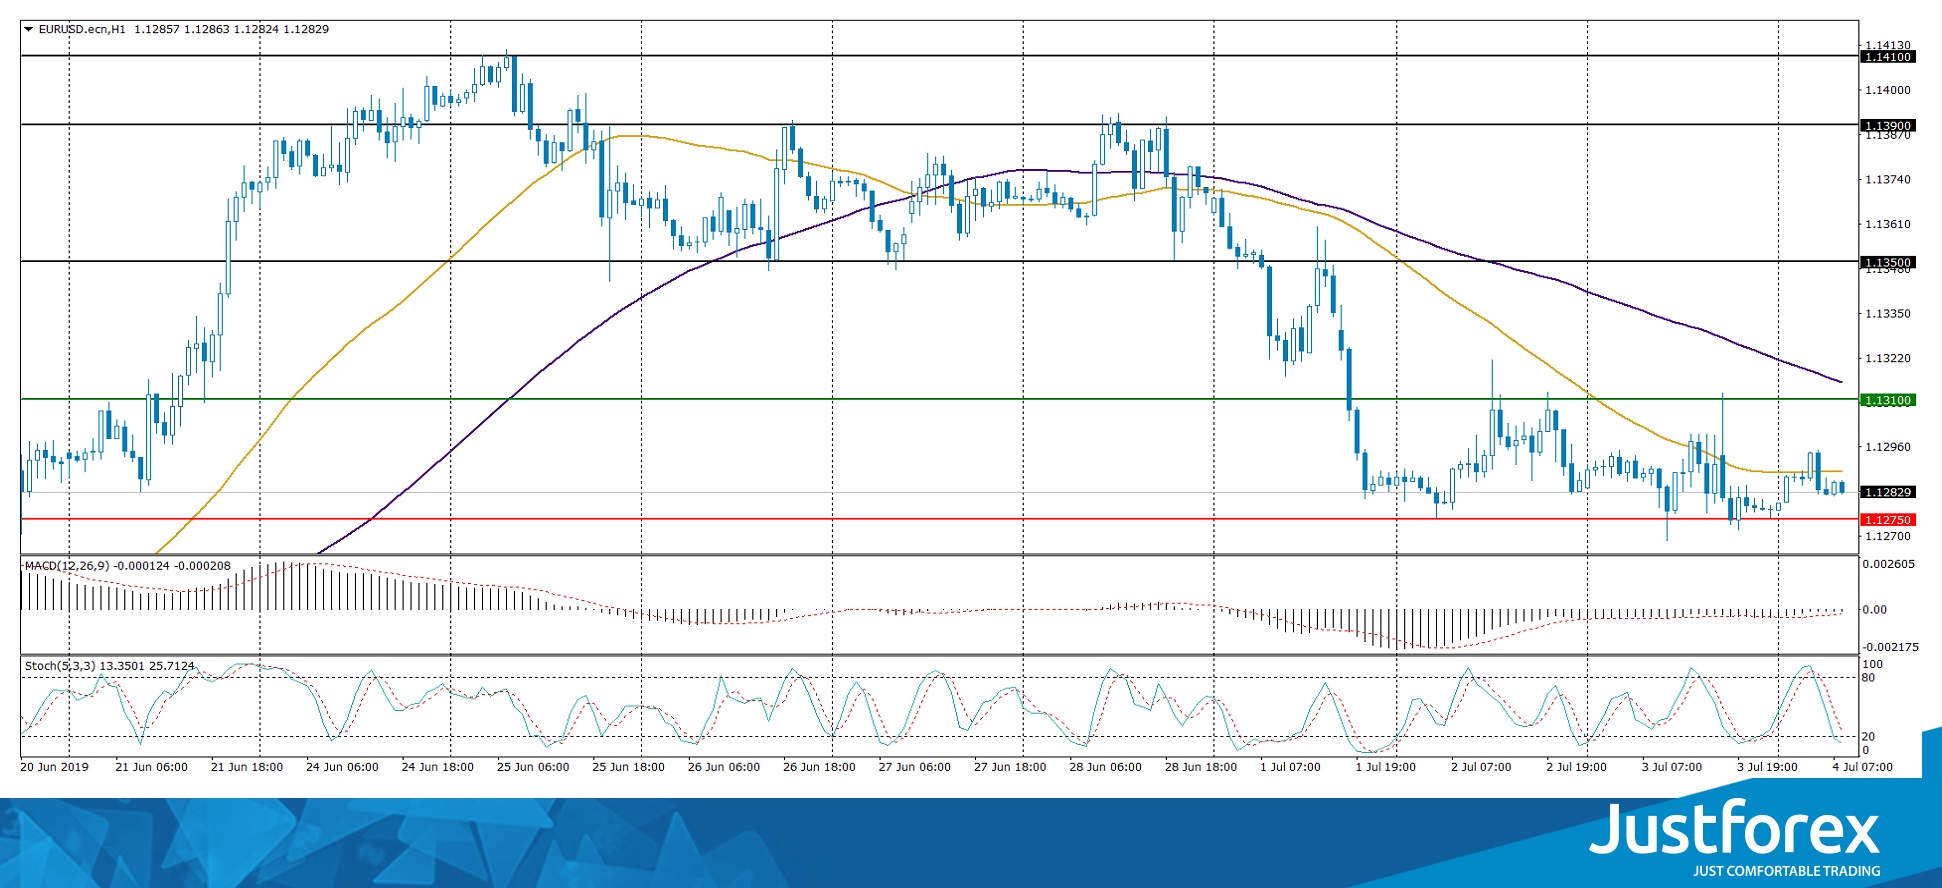
The indicators do not give accurate signals: the price crossed 50 MA.
The MACD histogram is close to the 0 mark.
Stochastic Oscillator is in the neutral zone, the% K line is below the% D line, which indicates bearish moods.
Trading recommendations
Support levels: 1.12750, 1.12400
Resistance levels: 1.13100, 1.13500, 1.13900
If the price fixes below 1.12750, expect further descend towards 1.12400-1.12200.
Alternatively, the quotes can recover toward 1.13400-1.13600.
The GBP/USD currency pair
Technical indicators of the currency pair:
Prev Open: 1.25907
Open: 1.25647
% chg. over the last day: -0.08
Day's range: 1.25623 - 1.25913
52 wk range: 1.2438 - 1.3631
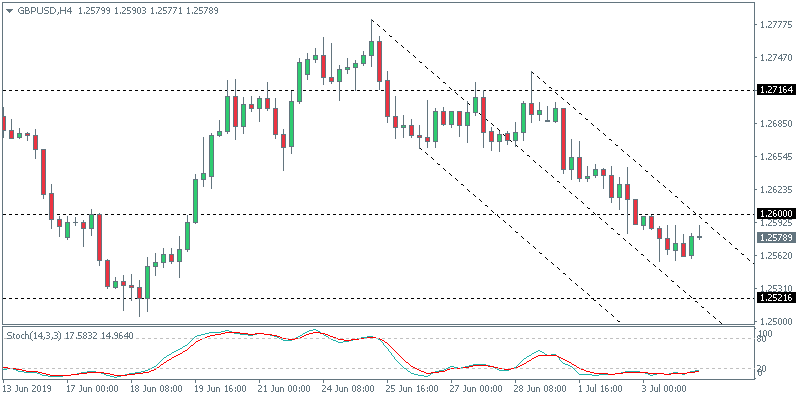
GBP/USD has stabilized after a sharp fall since the beginning of the current week. GBP is consolidating. The key support and resistance levels are 1.25600 and 1.26000. GBP remains under pressure due to weak business activity in the UK. GBP/USD quotes can decline further. The positions must be opened from key levels.
Today, the news background on the UK economy is calm. We recommend to keep up to date information on Brexit.
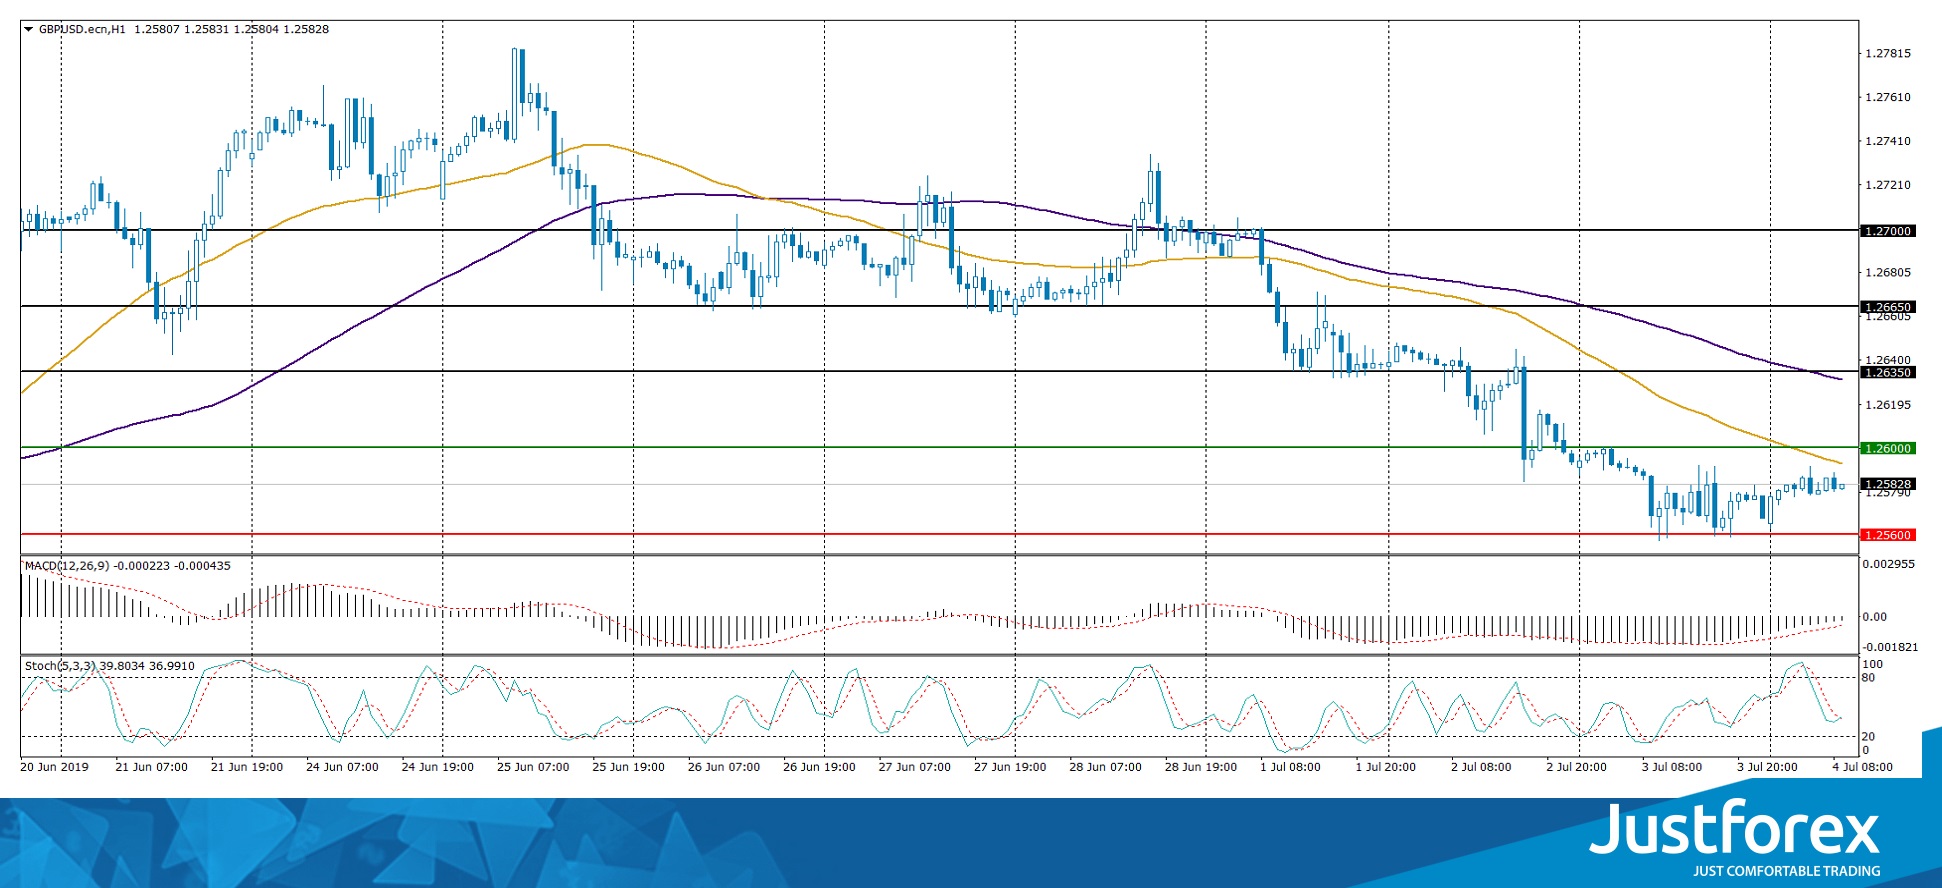
The price has fixed below 50 MA and 100 MA, which indicates the power of the sellers.
The MACD histogram began to rise and approached 0. There are no signals at the moment.
The Stochastic Oscillator is in the neutral zone, the %K line crossed the %D line. At the moment, there are no accurate signals.
Trading recommendations
Support levels: 1.25600, 1.25300, 1.25000
Resistance levels: 1.26000, 1.26350, 1.26650
If the price consolidates below 1.25600, expect a decline toward 1.25300-1.25000.
Alternatively, the quotes can grow toward 1.26300-1.26500.
The USD/CAD currency pair
Technical indicators of the currency pair:
Prev Open: 1.31055
Open: 1.30595
% chg. over the last day: -0.37
Day's range: 1.30552 - 1.30733
52 wk range: 1.2727 - 1.3664
The USD/CAD currency pair has once again moved to a decline. Yesterday, the quotes fell by more than 45 points and updated local minima. CAD is consolidating, tyhe key support and resistance levels are 1.30550 and 1.30850. In the near future, we do not exclude technical correction of the trading instrument. Pay attention to the dynamics of oil prices and open positions from key levels.
The Economic News Feed for 04.07.2019 is calm.
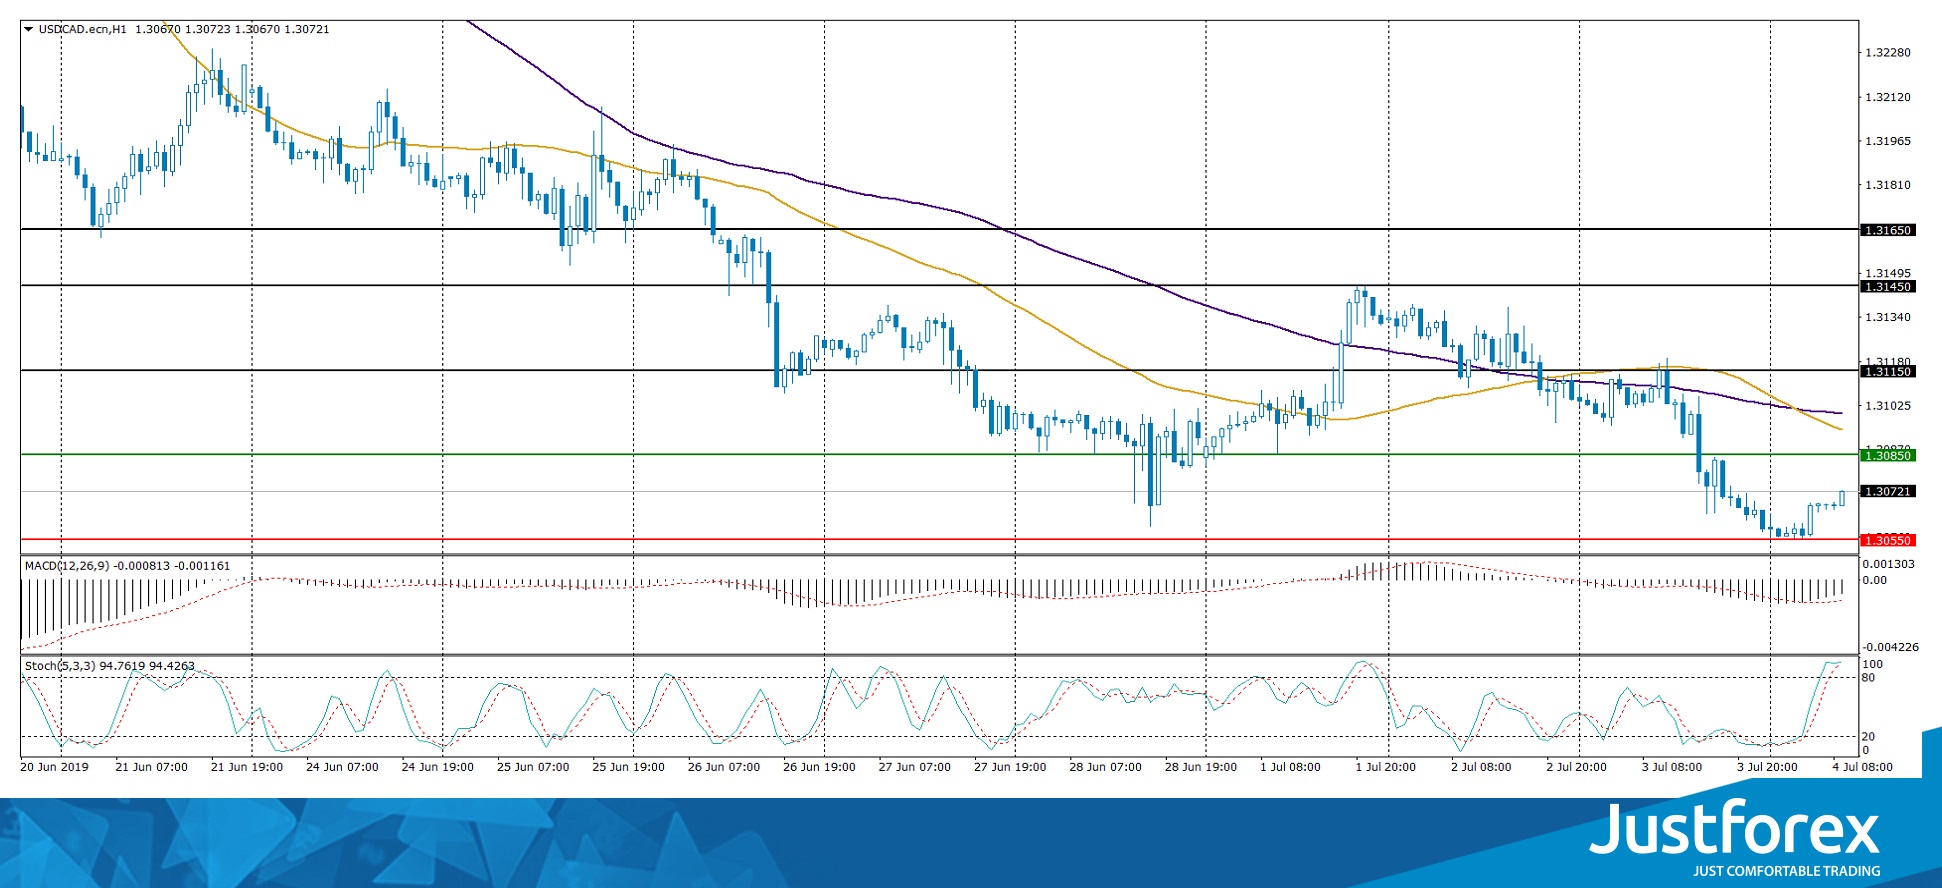
The price has fixed below 50 MA and 100 MA, which indicates the power of the sellers.
The MACD histogram is in the negative zone, but above the signal line, which gives a weak signal to sell USD/CAD.
The Stochastic Oscillator is in the overbought zone, the %K line has started to cross the %D line. There are no signals at the moment.
Trading recommendations
Support levels: 1.30550, 1.30000
Resistance levels: 1.30850, 1.31150, 1.31450
If the price consolidates above 1.30850, the quotes can rise toward 1.31150-1.31300.
Alternatively, the quotes can fall toward 1.30200-1.30300.
The USD/JPY currency pair
Technical indicators of the currency pair:
Prev Open: 108.427
Open: 107.878
% chg. over the last day: -0.56
Day's range: 107.533 - 107.913
52 wk range: 104.97 - 114.56
The USD/JPY has gone down. During yesterday's and today's trading, the drop in quotes exceeded 80 pips. The trading instrument has established new local minimums. At the moment, the safe harbor currency is consolidating. The key support and resistance levels are 107.500 and 107.850, respectively. The focus is on economic reports from the United States. The technical picture signals a further drop in the USD/JPY quotes. We recommend to open positions from key levels.
The Economic News Feed for 04.07.2019 is calm.
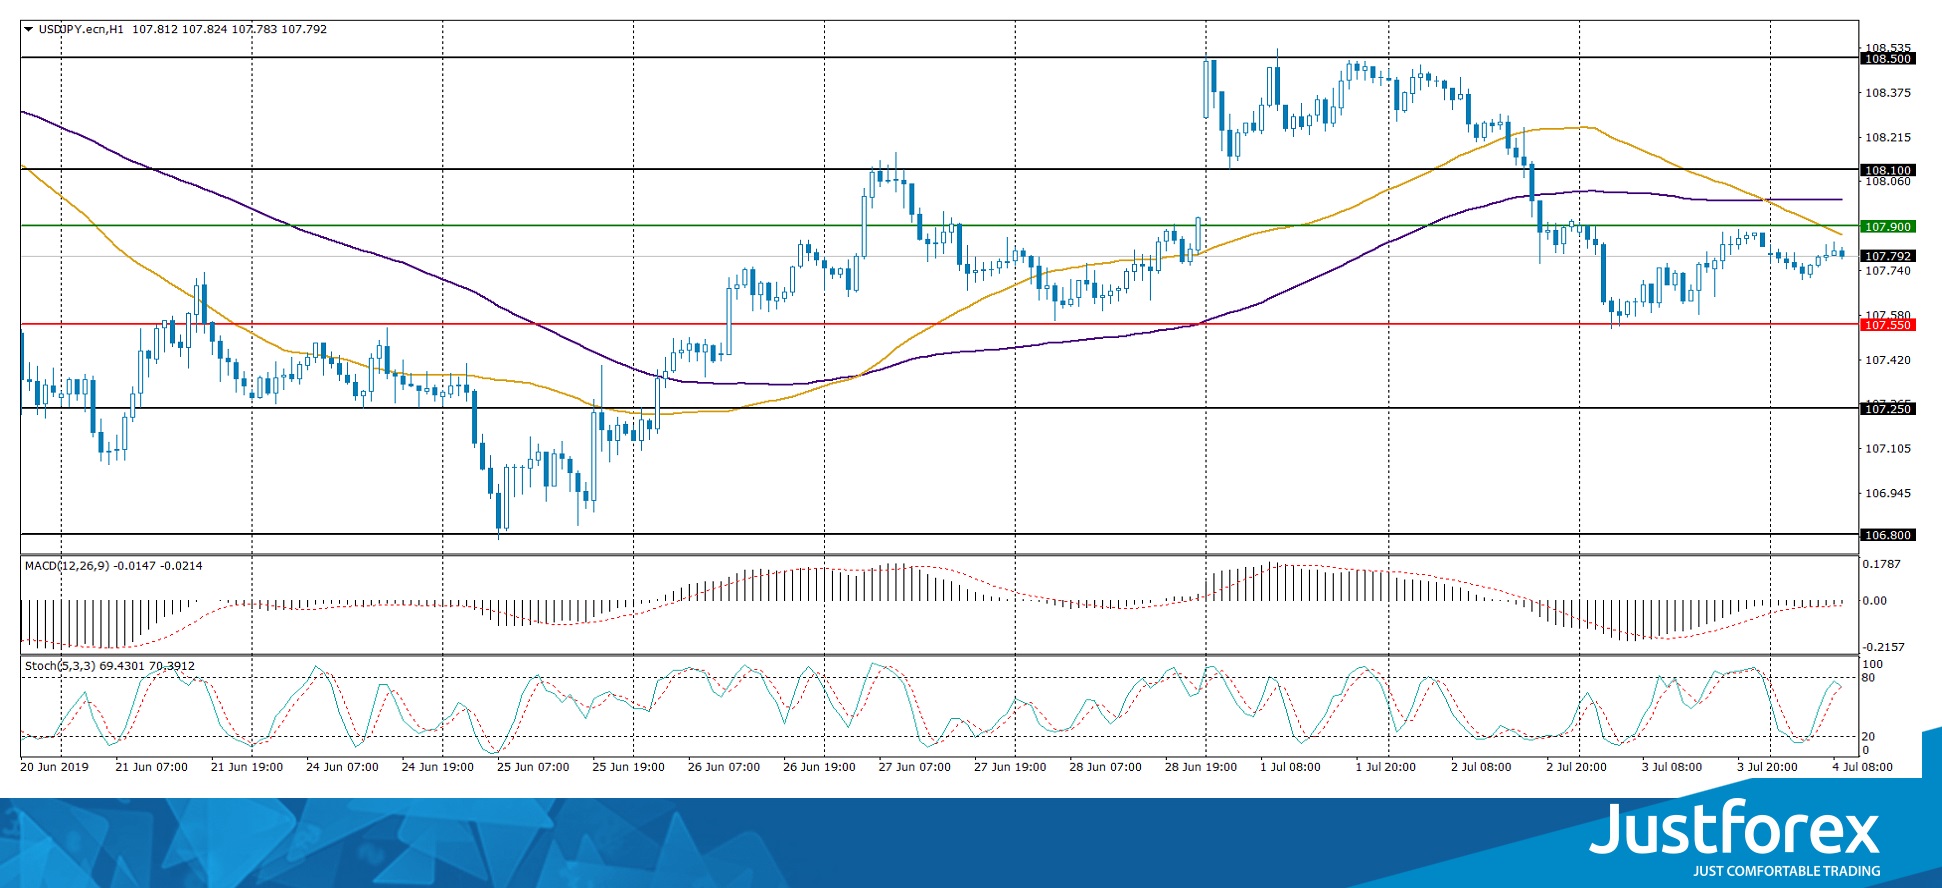
The price has fixed below 100 MA, which indicates the strength of the sellers.
The MACD histogram is in the negative zone and below the signal line, which gives a strong signal to sell USD / JPY.
The Stochastic Oscillator is in the neutral zone, the% K line is above the% D line, which indicates bullish moods.
Trading recommendations
Support levels: 107.500, 107.100, 106.800
Resistance levels: 107.850, 108.100, 108.500
If the price consolidates below 107.500, a further fall in the USD / JPY quotes is expected. The potential movement to 107.200-107.000.
An alternative could be the growth of the USD / JPY currency pair to 108.100-108.300
USDJPY Continues Selling Interest In Short Term
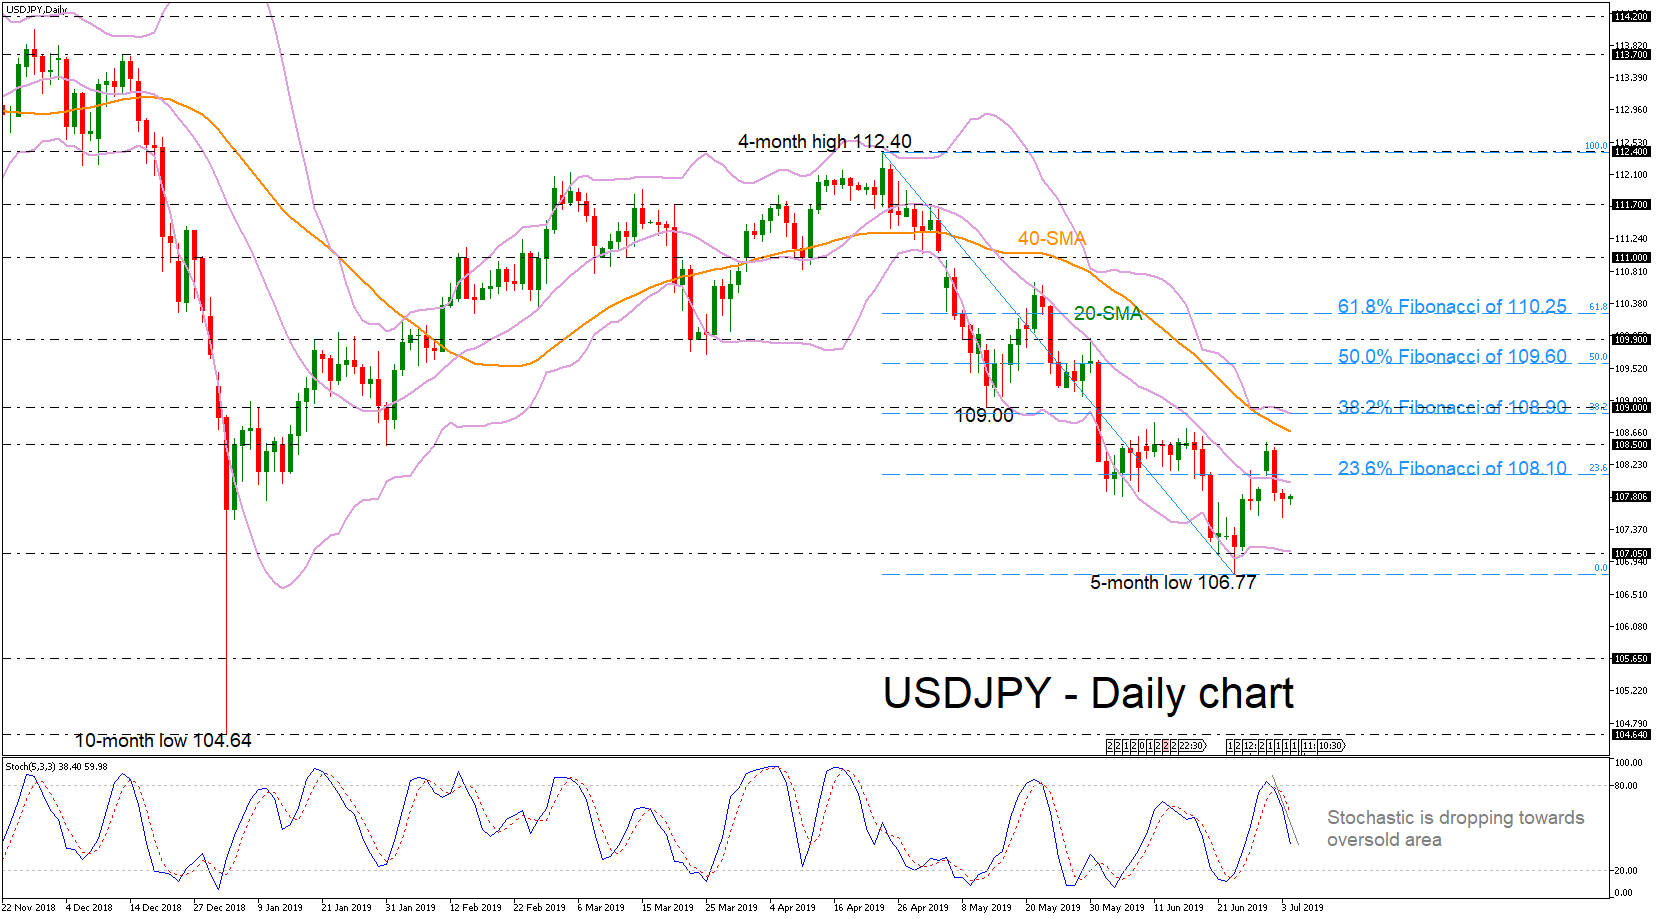
USDJPY held in losses over the previous couple of days, dropping back below the 23.6% Fibonacci retracement level of the downfall from 112.40 to 106.77 near 108.10 and the 20-day simple moving average (SMA). The negative bias in the near term is supported by the deterioration in the stochastic oscillator. The %K line of the stochastic is falling sharply towards oversold levels and posted a bearish crossover with the %D line.
If prices continue to head lower, support should come from the lower Bollinger band, which overlaps with the 107.05 barrier. A drop below this line would open the door for the five-month low of 106.77, while even lower the ten-month low of 104.64 comes into play, reinforcing the bearish bias.
However, should an upside reversal take form, immediate resistance will likely come from the 23.6% Fibonacci mark of 108.10, before touching the latest high of 108.50. A successful advance above this level would take the market until the 40-day SMA currently at 108.66 ahead of the strong resistance near the 109.00 handle, which encapsulates the upper Bollinger band and the 38.2% Fibo.
In the short-term, the outlook remains negative since prices hold below all the moving average lines after the decrease from the 112.40 hurdle.
Gold Trades Flat On Risk Off Sentiment
After paring losses, gold prices closed Wednesday on a somewhat flat note. Investors sought risk assets which saw the equities pushing to fresh all-time highs. Expectations of a Fed rate cut led to increased risk appetite. However, in the short term, gold is likely to remain in favor amid easy monetary policy.
Is Gold Due to Correct Lower?
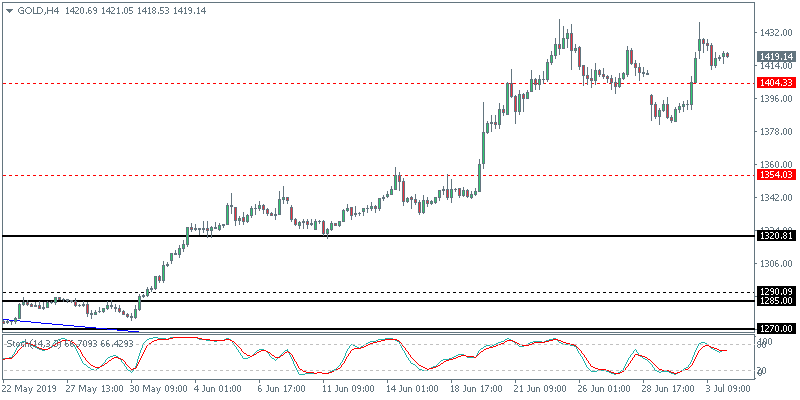
The recent price action in gold saw a retest to the previous six-year high before closing somewhat bearish. The Stochastics oscillator on the daily chart signals a lower high, indicating a possible move to the downside. Price will need to close below 1404.00 in order to confirm the downside bias. The next downside target is seen at 1354.00.
Sterling Slips As Services Sector Falls Closer To 50
The UK's monthly services activity saw another weak month, tracking the slowdown across the manufacturing and construction sectors. Data from Markit saw the UK's services sector easing to 50.2 in June. This was down from 51.0 estimates and the same level in May. The services activity caps a weak month of June which saw all three sectors showing a slowdown in the economy.
Can the GBPUSD Reverse Losses?
The currency pair has been posting solid declines for three consecutive days. Price action is now close to June 16, 17th lows of 1.2532. If this level is breached, then the potential inverse head and shoulders pattern is likely to become invalid. GBPUSD will need to post a daily close above 1.2600 in order to confirm any potential upside move.