

Sample Category Title
EUR/USD Outlook: Extended Bulls Crack Key Fibo Barrier But May Slow Here
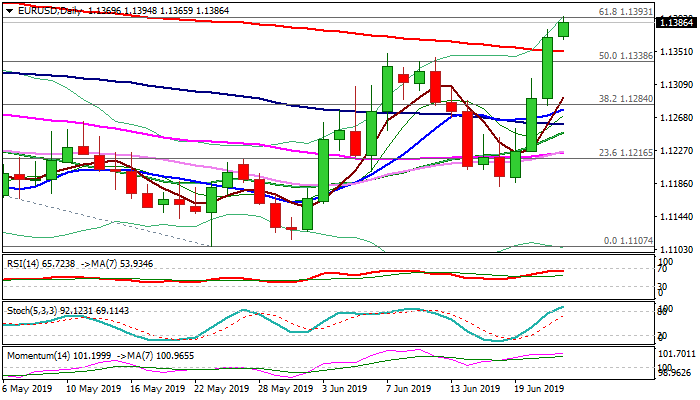
The Euro cracked strong Fibo barrier at 1.1393 (61.8% of 1.1569/1.1107) on Monday, in extension of past three days 1.6% advance, which resulted in break and close above falling 200SMA (1.1350) on Friday.
Strong bullish momentum remains intact and supportive for break through 1.1393 /1.1400 pivots (Fibo / psychological barrier) that would open way towards 20 Mar lower top at 1.1448.
On the other side, overbought stochastic and weaker than previous month German ZEW data (June 94.2 vs May 95.2) may slow bulls.
Failure to clear 1.1393 barrier would result in consolidation, which needs to hold above broken 200SMA to keep bulls intact.
Break and close below 200SMA would signal deeper pullback.
Res: 1.1393, 1.1437, 1.1448, 1.1460
Sup: 1.1365, 1.1350, 1.1300, 1.1279
EUR/GBP Daily Outlook
Daily Pivots: (S1) 0.8888; (P) 0.8918; (R1) 0.8951; More...
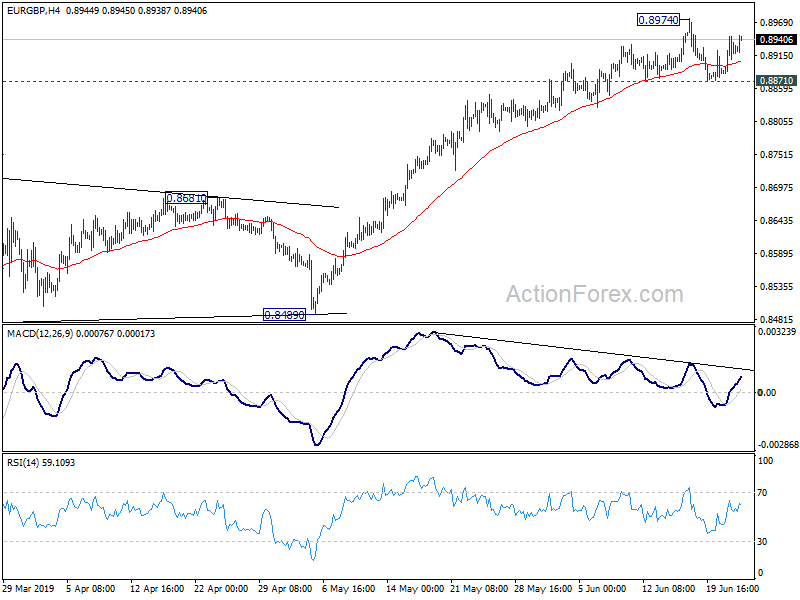
Intraday bias in EUR/GBP remains neutral and consolidation from 0.8974 might extend. with 0.8871 support intact, further rise is expected. On the upside, break of 0.8974 resistance will resume larger rally to 0.9101 key resistance next. However, considering bearish divergence condition in 4 hour MACD, break of 0.8871 will indicate short term topping. Deeper pull back could be seen to 55 day EMA (now at 0.8781).
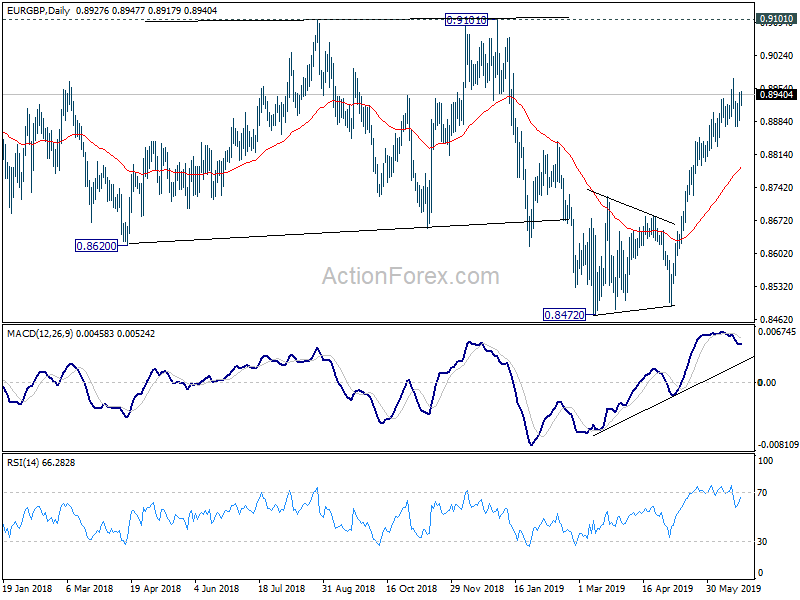
In the bigger picture, medium term decline from 0.9305 (2017 high) is seen as a corrective move. No change in this view. Current development argues that it might have completed with three waves down to 0.8472, just ahead of 38.2% retracement of 0.6935 (2015 low) to 0.9306 at 0.8400, after hitting 55 month EMA (now at 0.8527). Decisive break of 0.9101 resistance will confirm this bullish case. Nevertheless, as EUR/GBP is still staying inside long term falling channel, correction from 0.9305 could still extend to 0.8400 fibonacci level before completion, if upside is rejected by 0.9101.
Forex Technical Analysis: EUR/USD, USD/JPY, GBP/USD
EUR/USD
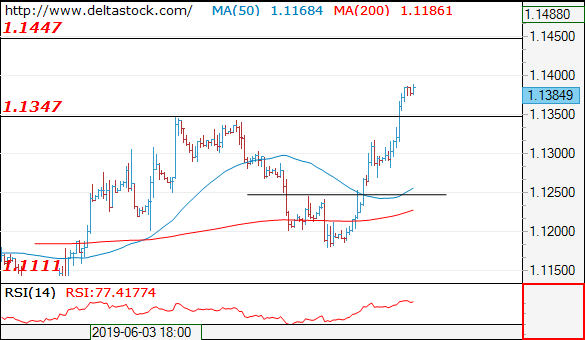
Current level - 1.1384
The break through 1.1350 resistance shows a continuation towards 1.1450 and on the senior frame this signals a completion of the whole slide since 1.2540 peak, thus setting new medium-term targets at 1.1820 and 1.2100 area.
| Resistance | Support | ||
| intraday | intraweek | intraday | intraweek |
| 1.1450 | 1.1570 | 1.1350 | 1.1110 |
| 1.1570 | 1.1820 | 1.1250 | 1.1010 |
USD/JPY
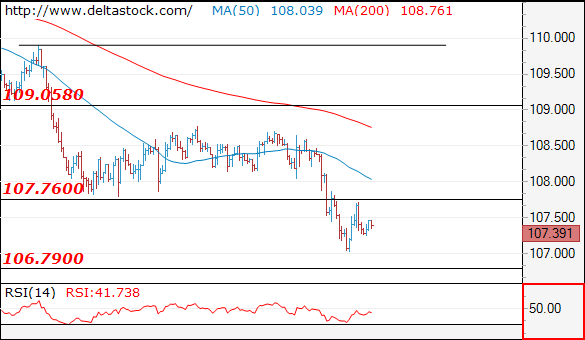
Current level - 107.39
The rebound above 107.00 low led to a test of 107.70 resistance and the intraday bias is neutral within the current range.
| Resistance | Support | ||
| intraday | intraweek | intraday | intraweek |
| 107.70 | 109.90 | 106.70 | 106.70 |
| 108.70 | 112.40 | 106.70 | 104.50 |
GBP/USD
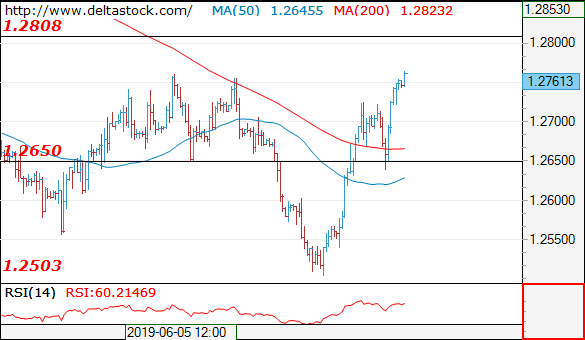
Current level - 1.2761
The support at 1.2650 led to a renewal of the rise and the bias is positive, for a test of 1.2810 resistance. Minor intraday support lies at 1.2720.
| Resistance | Support | ||
| intraday | intraweek | intraday | intraweek |
| 1.2760 | 1.2890 | 1.2650 | 1.2503 |
| 1.2810 | 1.3170 | 1.2600 | 1.2420 |
EUR/AUD Daily Outlook
Daily Pivots: (S1) 1.6327; (P) 1.6379; (R1) 1.6470; More...
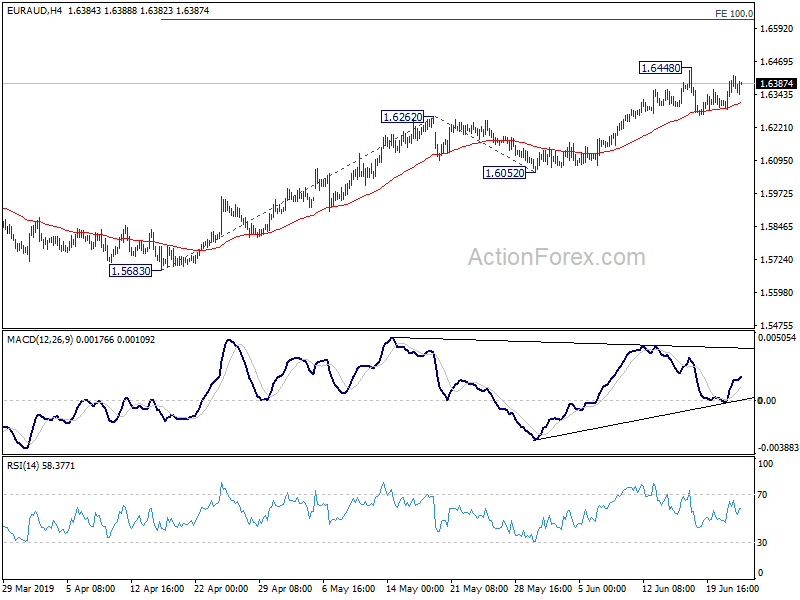
Intraday bias in EUR/AUD remains neutral for the moment and consolidation from 1.6448 is still in progress. In case of another fall, downside should be contained above 1.6052 support to bring rise resumption. On the upside, break of 1.6448 will resume the rally from 1.5683 and target 100% projection of 1.5683 to 1.6262 from 1.6052 at 1.6631 next.
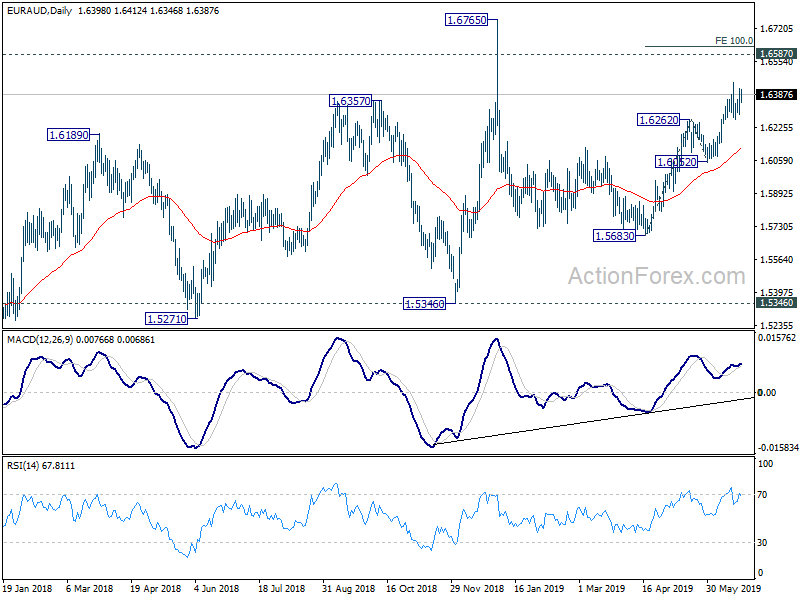
In the bigger picture, as long as 1.5346 support holds, outlook will still remain bullish. Up trend from 1.1602 (2012 low) is expected to resume sooner or later. Break of 1.6765 will target 61.8% retracement of 2.1127 (2008 high) to 1.1602 at 1.7488 next. However, firm break of 1.5346 key support will indicate trend reversal and turn outlook bearish.
Cautious Optimism Ahead Of G20 Summit, Dollar Slips To 3-Month Lows
- All eyes this week are on planned meeting between Presidents Trump and Xi at the G20 summit
- Cautious optimism that progress can be made in stalled trade talks lifts equities on Monday
- But growing tensions between the US and Iran weigh on sentiment
- Dollar remains under pressure as markets expect a near-term rate cut by the Fed
Hopes rise of positive talks at G20 summit
Markets started the week on a positive note on Monday on hopes that the talks between US President Trump and Chinese President Xi on the sidelines of the G20 summit on June 28-29 will lead to a resumption of trade negotiations between the two countries that have been on hold since early May. Shares in Asia were mostly in the green, while US and European stock futures were pointing to modest gains for Monday. The S&P 500, which surged to record highs last week after the Fed opened the door to rate cuts, was looking to advance 0.3% at the US open.
Earlier today, China’s Vice Commerce Minister, Wang Shouwen, urged both sides to compromise. But a major breakthrough is unlikely as only on Friday the US Commerce Department added several Chinese companies to the ‘entity list’ that restricts them from buying American technology without the approval of the US government. In response, China added US firm FedEx to its own ‘unreliable entities list’, raising the prospect of further tit-for-tat measures.
Tensions continue to brew between US and Iran
President Trump may have called off a military strike on Iran last week but tensions in the region remain heightened as Washington plans to announce new sanctions on the country on Monday in response to the recent attacks on oil tankers. Although an imminent conflict may have been averted for now, future military action remains a strong possibility as Trump has threatened “obliteration like you’ve never seen before” if Iran does not return to the negotiating table.
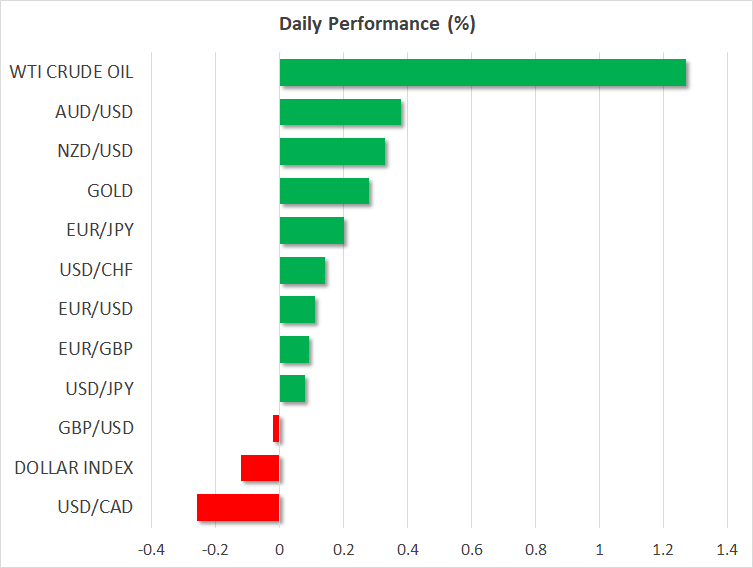
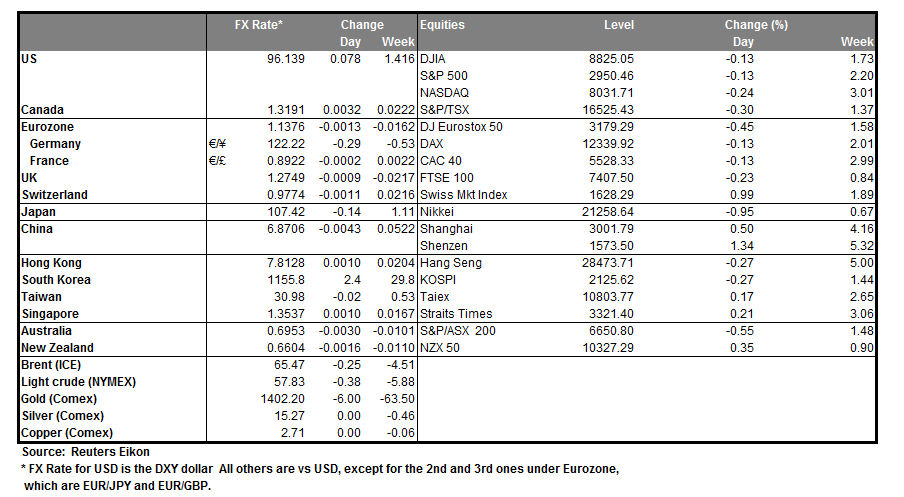
The recent escalation has bolstered oil prices, with both WTI and Brent crude surging to more than 3-week highs. Further supporting oil over the past week is the improving demand picture on the back of the global shift by major central banks to cut interest rates.
Similarly, gold has also received a double boost from the rising geopolitical tensions and falling sovereign bond yields, especially in the US, that lifted the precious metal to six-year highs on Friday. Gold was able to hold on to the $1400 an ounce level today, trading just above the handle.
Dollar still struggling after dovish Fed
The increased geopolitical risks and a more dovish Fed have not been good news for the US dollar, however, as the greenback slips to 3-month lows against a basket of currencies. Investors continue to heavily price a rate cut by the Federal Reserve at its next meeting in July and PCE inflation data due later in the week should provide a further clue about the Fed’s intentions in the coming weeks.
The dollar was trading slightly above Friday’s 5½-month low of 107.04 yen, while the euro scaled 3-month highs, touching $1.1389. The euro got a boost on Friday from better-than-expect Eurozone PMIs for June even as the European Central Bank signals that ‘additional stimulus’ may be needed as price pressures remain muted. This puts the focus on the flash June inflation readings due later in the week.
The pound also benefited from the fading dollar, climbing above the $1.27 level. Though the prospect of Boris Johnson likely becoming the next prime minister of the United Kingdom kept sterling’s gains in check.
The Australian and New Zealand dollars were on the front foot too despite strong expectations that both the RBA and RBNZ will cut rates further over the coming months. The Reserve Bank of New Zealand holds its next meeting on Wednesday and is anticipated to hold rates unchanged but could signal more cuts. There were mixed messages, however, from RBA Governor Philip Lowe, who today appeared to question the effectiveness of monetary easing having hinted at the need for more rate cuts only last week.
EUR/CHF Daily Outlook
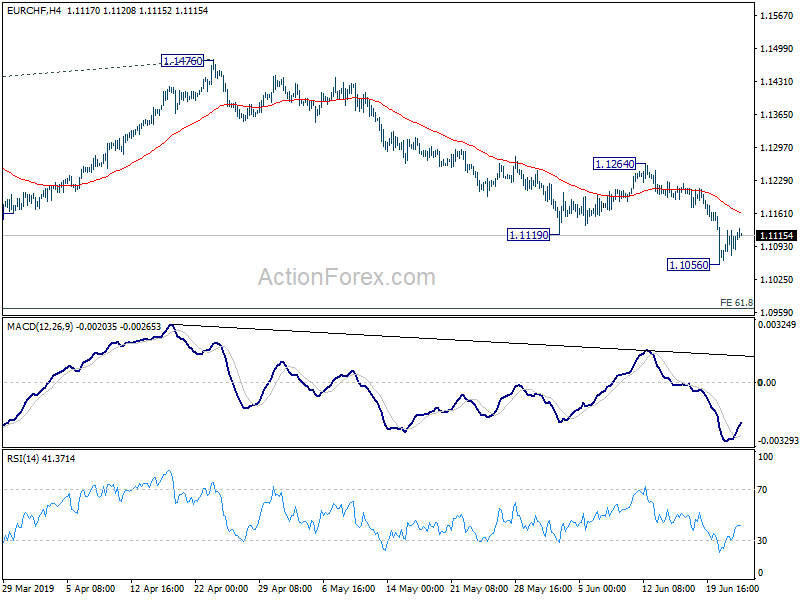
Daily Pivots: (S1) 1.1072; (P) 1.1100; (R1) 1.1127; More...
EUR/CHF's consolidation from 1.1056 is still in progress and intraday bias remains neutral first. In case of stronger recovery, upside should be limited below 1.1264 resistance to bring further decline. On the downside, break of 1.1056 will resume the larger down trend for 61.8% projection of 1.2004 to 1.1173 from 1.1476 at 1.0962 next.
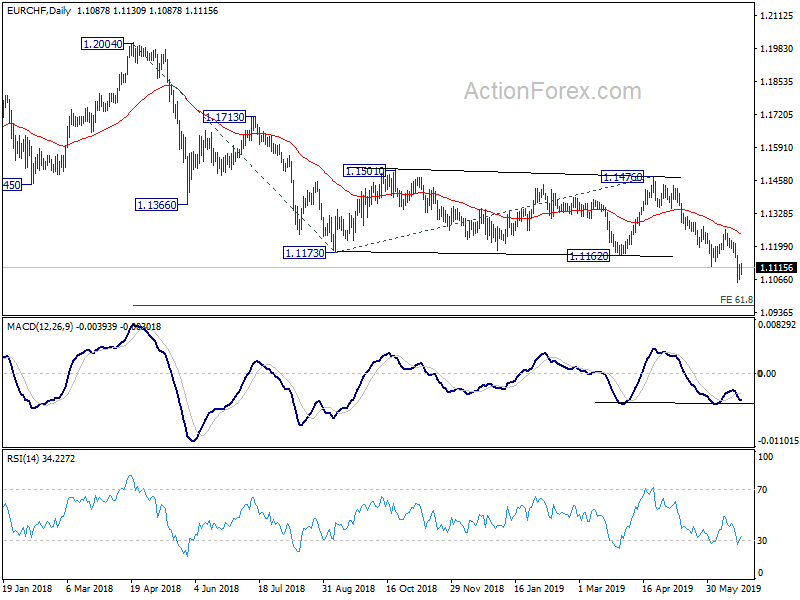
In the bigger picture, current development firstly suggests that down trend from 1.2004 is still in progress. More importantly, it's likely a long term down trend itself, rather than a correction. Outlook will remain bearish as long as 1.1476 resistance holds. EUR/CHF could target 1.0629 support and below.
Bitcoin: Could 100K Be New 10K?
There was only one dominant talk over the weekend and it was about Bitcoin. The crypto king blasted the level of $10,000 and made a new high for 2019 which stands at $11,251. Although, it has retraced from that level now and currently trading at 10,757. Nonetheless, this is a strong comeback, everyone has been waiting for this for a long time. From a price perspective, bitcoin has recovered more than 50% off its losses from its all-time high of $20,000. The strong resurgence in the bitcoin price is mainly due to the renewed mainstreaming interest in crypto currencies and the technology which underlines it. Projects like Facebook's Libra has provided much needed tailwind for this space.
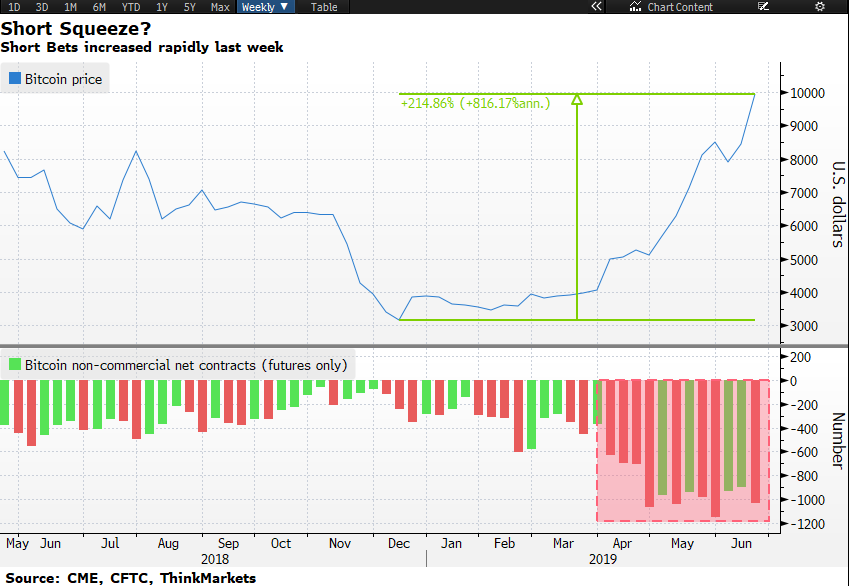
In our previous research, we mentioned that the move to the upside could be highly volatile and the reason for that was speculators holding large number of short bets as per the CFTC data released last Friday. Large number of short bets give birth to short squeeze. The below chart shows large number of short bets for Bitcoin: Non-commercial net contract bets confirmed increase in short interest while the price was up nearly 214% from its 2018 low.
Nonetheless, the most important thing was the 24 hour volume for bitcoin, It was at its highest level since December 2007 when the price was trading at $20,000. This shows that the game is on because of the mainstream enterprises jumping in this space. This is because investors didn't lose their interest when the first bubble busted, they simply moved on the side-line waiting for the next bull run to start.
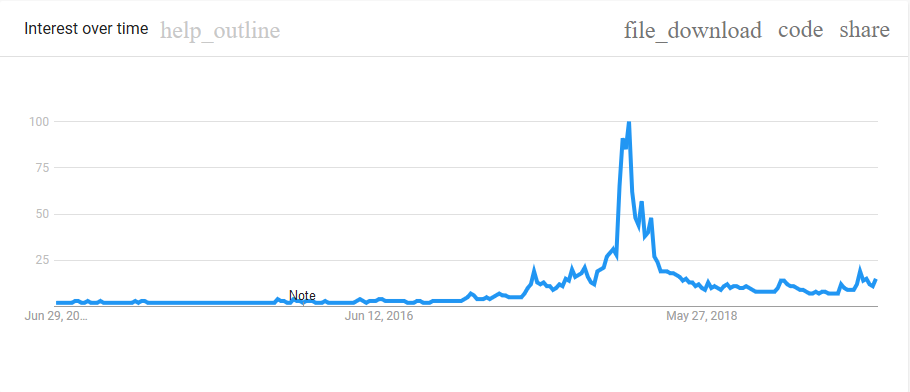
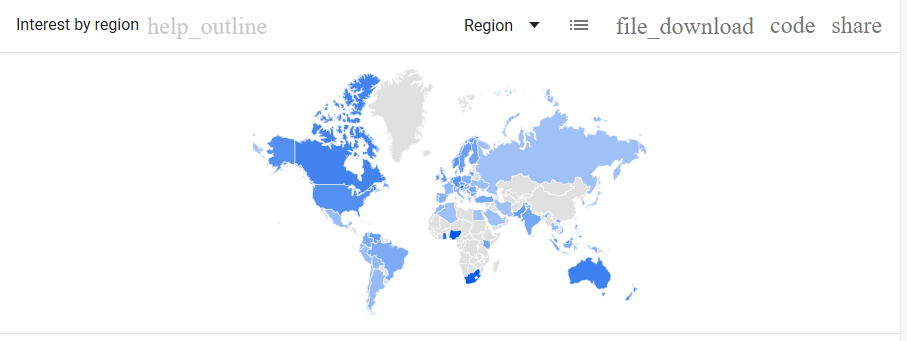
Google trend search for “Buy Bitcoin” shows that the largest number of searches are coming from mostly African country with Nigeria taking the top place followed by South Africa and Ghana. However, the overall the trend is still well below the level seen back in May 2009, This confirms that the surge in the Bitcoin price is mainly due to the institutional participation.
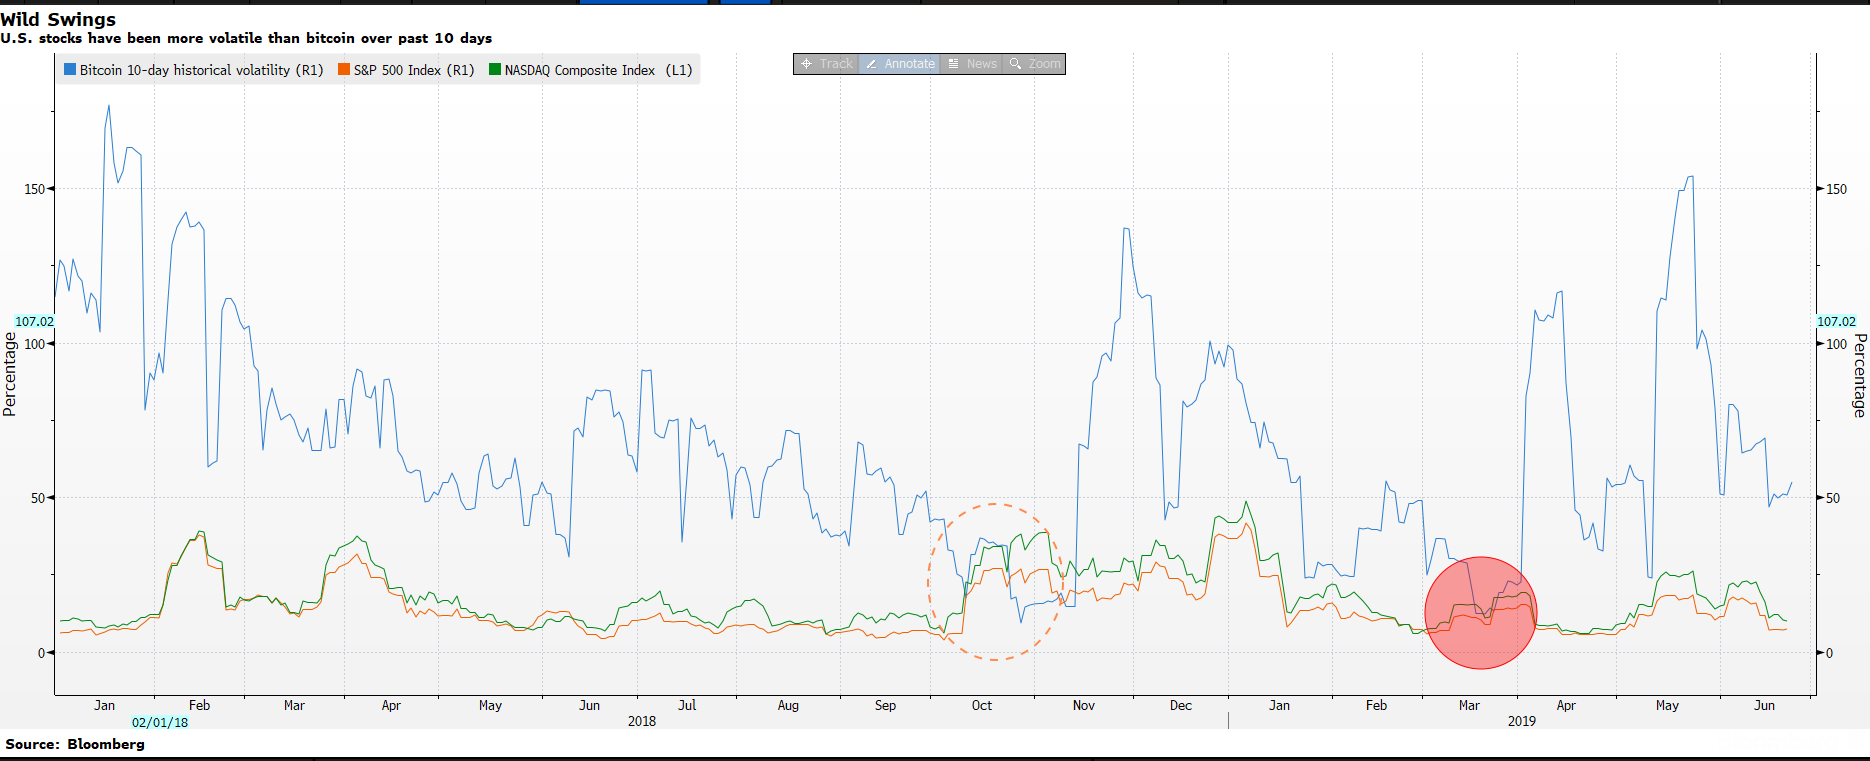
In terms of volatility, the beast is unleashed once again. Back in October 2018, Bitcoins 10-day volatility was lower than the S&P 500 index and the Nasdaq, it did drop below the S&P500's 10-day volatility in March 2019 again, but since then, it has been increasing.
To concolude, I do think the next rally is going to be a lot more stronger than the previous one, one can call it a bubble, but this time the range could very well be between $60,000 to $100,000
EUR/USD Strengthens On Fed Easing
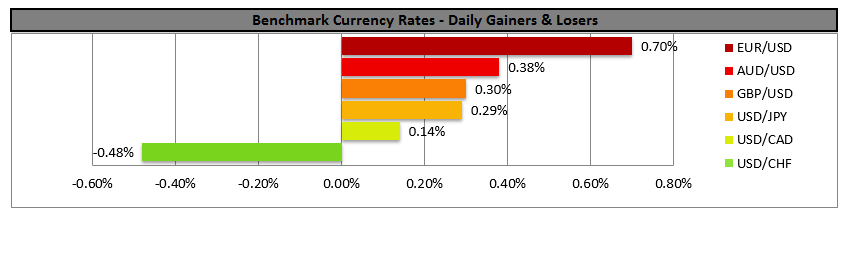
EUR/USD rose on Friday and during today's Asian session, reaching a three-month high, as the bearish sentiment for the USD continued. The prospect of the Fed's possible easing scared USD bulls away, weighing on the USD. The comparison of the prospects of the two central banks, ECB and the Fed, continues to provide an advantage for the common currency. On other news there seems to be mobility on the US-Sino trade relationships, as Chinese officials stated that both the US and China should make compromises for the two countries to find a solution. Should worries about the Fed's expected easing be maintained, we could see the USD weakening further, yet markets could be keeping an eye out for the G20 meeting in Osaka near the end of the week. The pair rallied on Friday breaking the 1.1300 (S2) and the 1.1340 (S1) resistance lines (now turned to support) and continued its rise testing the 1.1380 (R1) resistance level. The pair seems to be finding substantial resistance at the prementioned level, yet as the upward trendline incepted since the 19th of June, has not been broken, we maintain our bullish bias. Please note that the RSI indicator of the 4-hour chart, surpassed the reading of 70, implying a rather overcrowded long position. Should the bulls maintain control over the pair's direction, we could see it breaking the 1.1380 (R1) resistance line and aim for the 1.1415 (R2) resistance level. Should the bears take over, we could see the pair breaking the 1.1340 (S1) support line and aim for lower grounds.
WTI prices rise as Middle East tensions continue to worry markets.
Oil prices continued to rise during today's Asian session, as tension stayed at a high level in the Middle East. US Secretary of State Pompeo stated that “significant” sanctions on Tehran would be announced, yet also stated that the US is prepared to negotiate without any preconditions. The sanctions should aim at depriving Persia from resources that the country uses to fund its activities in the region, according to media. Please note that last week, US President Trump stated that he cancelled an airstrike on Iran, yet on Sunday also stated that was not seeking war with Iran. Should tensions remain at a high level and the supply of black gold under threat, we could see WTI prices rise further. WTI prices maintained bullish tendencies on Friday and during today's Asian session broke the 57.70 (S1) resistance line (now turned to support). We tend to maintain a bullish bias for the pair as long the upward trendline incepted since the 18th of June remains intact. Should the commodity find fresh buying orders along its path, we could see its prices breaking the 59.50 (R1) resistance line. Should WTI come under the selling interest of the market, we could see its prices breaking the 57.70 (S1) support line and aim for the 56.00 (S2) support level. Please note that the RSI indicator in the 4-hour chart is above the reading of 70, implying that the commodity may be overbought.
Other economic highlights, today and early tomorrow
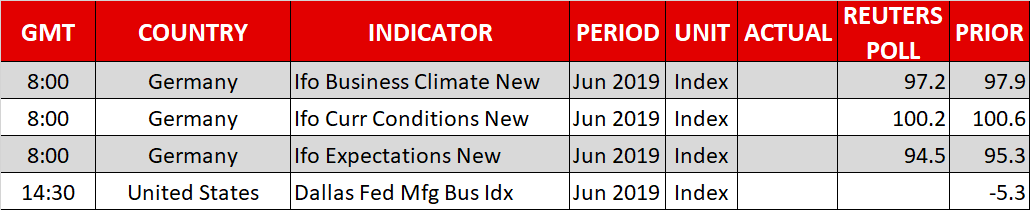
Today during the European session, we get France's final GDP growth rate for Q1 and Germany's Ifo Business Climate for June. During tomorrow's Asian session, we get New Zealand's trading data for May.
As for the rest of the week:
On Tuesday, we get from the US the CB consumer sentiment for June and Fed Chair Powell speaks. On Wednesday, we get from New Zealand RBNZ's interest rate decision, from Germany the GfK consumer Sentiment for July, from the Czech Republic CNB's interest rate decision, and from the US the durable goods orders growth rates for May. On Thursday, we get from Japan the retail sales for May, from Germany the preliminary HICP rate for June and the final US GDP growth rate for Q1. On Friday, we get from Japan, Tokyo's CPI rates for June and the industrial production for May. From the UK we get the final GDP growth rate for Q1, from the Eurozone the preliminary HICP rate for June and Canada's GDP for April.
EUR/USD H4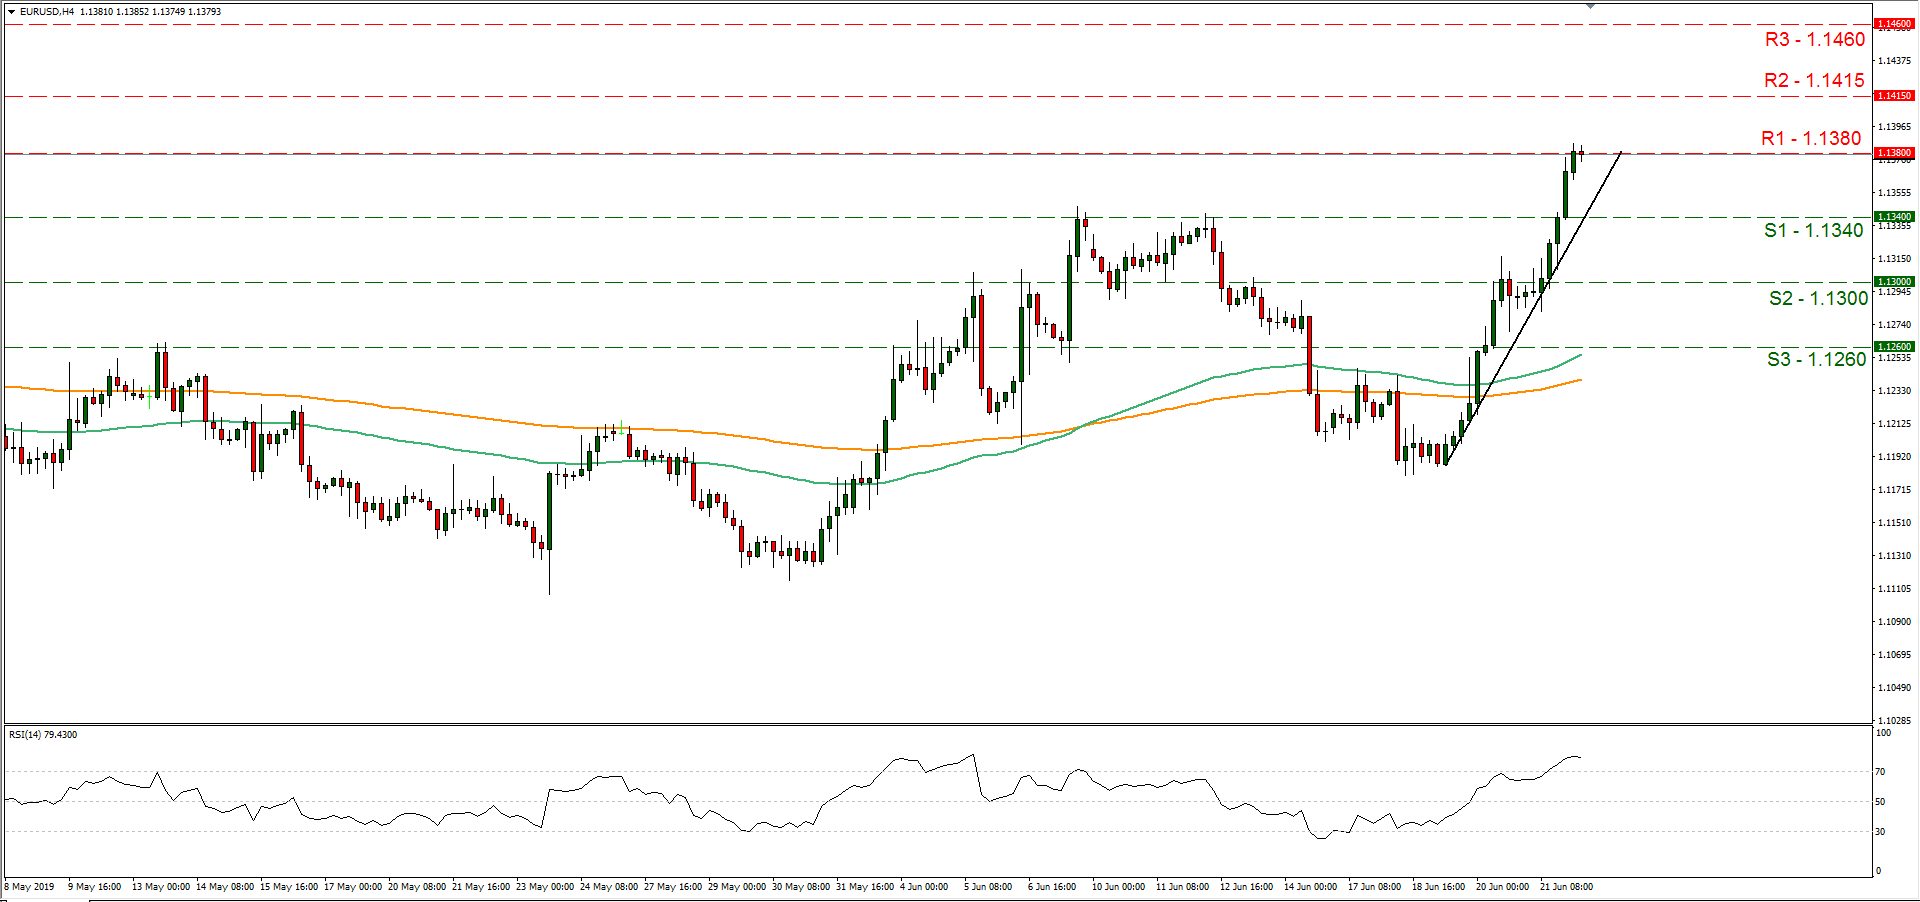
Support: 1.1340 (S1), 1.1300 (S2), 1.1260 (S3)
Resistance: 1.1380 (R1), 1.1415 (R2), 1.1460 (R3)
WTI H4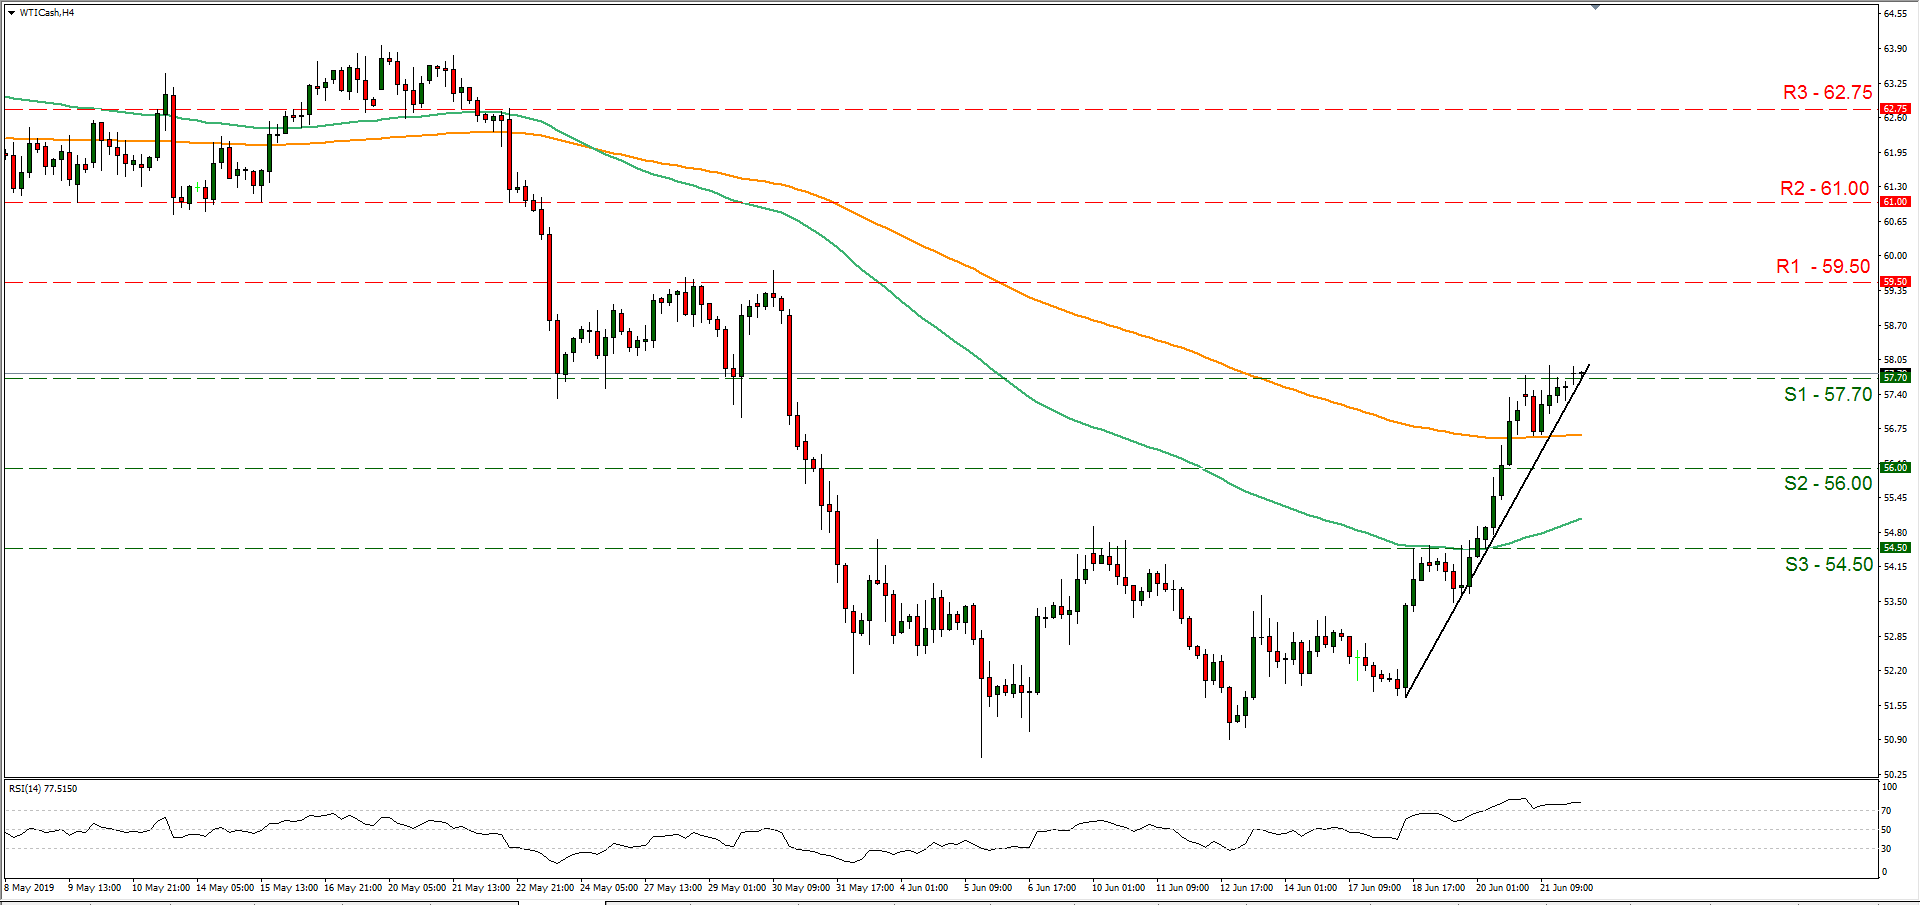
Support: 57.70 (S1), 56.00 (S2), 54.50 (S3)
Resistance: 59.50 (R1), 61.00 (R2), 62.75 (R3)
GBP/USD Outlook: Bulls Face Headwinds From Pivotal Barrier At 1.2763
Cable eased from new one-month high at 1.2766 in early European trading on Monday after bulls faced strong headwinds from key barrier at 1.2763 (Fibo 38.2% of 1.3179/1.2505 / 7 June high).
Strong four-day advance from 1.2505 low is taking a breather, as bulls remain supported by expectations of Fed rate cut by 0.5% and may position for fresh advance.
Overbought stochastic and weakening momentum on daily chart, support scenario, with dips expected to ideally hold above 30SMA (1.2688) and keep bulls in play for renewed probe through 1.2763 pivot.
Firm break here would open way towards falling 55SMA / 50% retracement (1.2837/42).
Converged 10/20SMA's (1.2657/62) mark pivotal support, loss of which would sideline bulls and shift near-term focus lower.
Res: 1.2763, 1.2810, 1.2842, 1.2900
Sup: 1.2723, 1.2688, 1.2672, 1.2657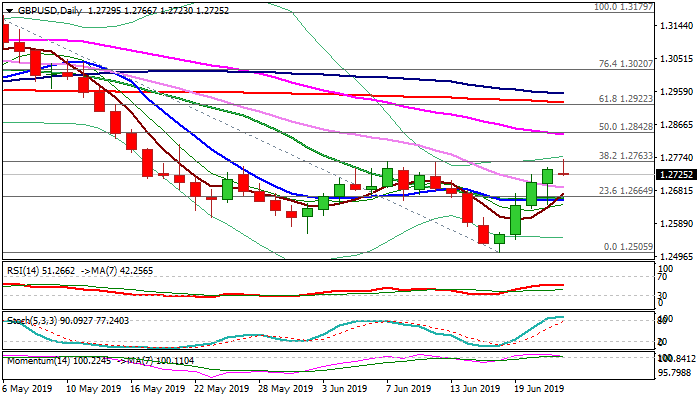
The Analytical Overview Of The Main Currency Pairs
The EUR/USD currency pair
Technical indicators of the currency pair:
Prev Open: 1.12942
Open: 1.13704
% chg. over the last day: +0.67
Day's range: 1.13657 – 1.13863
52 wk range: 1.1111 – 1.2009
EUR\USD remains in a bullish mood. Last week, the euro updated key extremes and reached three-month highs. The demand for Greenback has weakened significantly since the Fed meeting. The regulator is ready to consider the question of lowering interest rates at upcoming meetings. Additional support for the single currency provide positive data on business activity in the euro area, which were published on Friday. At the moment, EUR/USD quotes are consolidating. Local levels of support and resistance are 1.13550 and 1.13850, respectively. Trading instrument has the potential for further growth. Positions must be opened from key levels.
The Economic News Feed for 24.06.2019:
IFO Business climate index (EU) – 00:00 (GMT+3:00);
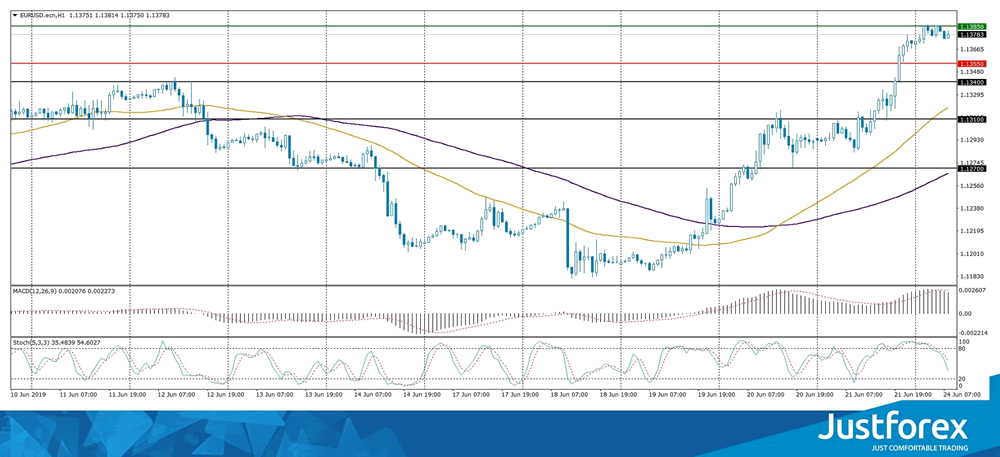
The price fixed above 50 MA and 100 MA which points to the power of the buyers.
The MACD histogram is in the positive zone but below the key line which gives a weak signal t buy EUR\USD
The Stochastic Oscillator is in the neutral zone, the %K line is below the %D line which points to a correction of EUR\USD.
Trading recommendations
Support levels: 1.13550, 1.13400, 1.13100
Resistance levels: 1.13850, 1.14000, 1.14400
If the price fixes above 1.13850, expect a growth towards 1.14200-1.14400.
Alternatively, the quotes can correct towards 1.13200-1.14400.
The GBP/USD currency pair
Technical indicators of the currency pair:
Prev Open: 1.27033
Open: 1.27328
% chg. over the last day: +0.32
Day's range: 1.27297 – 1.27595
52 wk range: 1.2438 – 1.3631
GBP/USD shows a steady uptrend. Currently, sterling is consolidating near monthly highs. GBP/USD quotes are testing local resistance at 1.27600. 1.27250 is already a "mirror" support. Demand for the USD remains at a fairly low level. Trading instrument has the potential for further growth. We recommend to keep track of current information on the issue of Brexit. Positions must be opened from key levels.
The Economic News Feed for 24.06.2019 is calm.
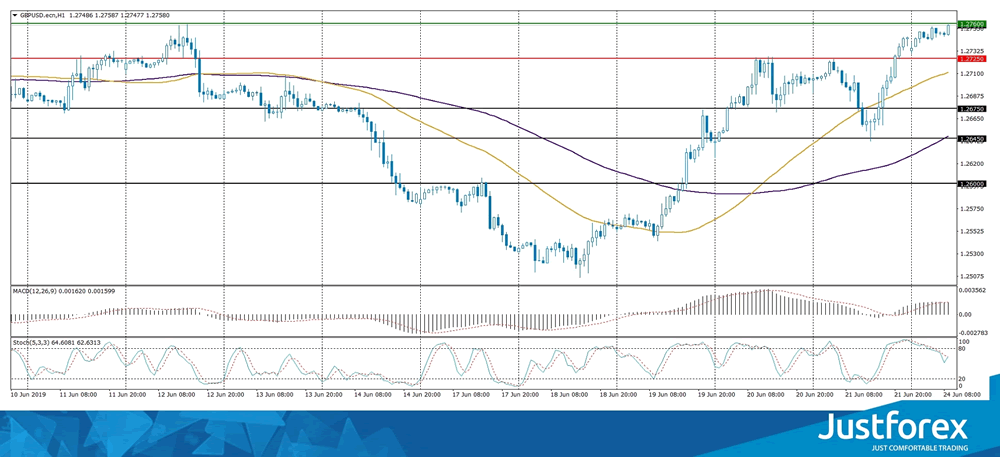
The price fixed above 50 MA and 100 MA which points to the power of the buyers.
The MACD histogram is in the positive zone and keeps rising which gives a strong signal to buy GBP\USD.
The Stochastic Oscillator is in the neutral zone, the %K line is crossing the %D line. There are no signals at the moment.
Trading recommendations
Support levels: 1.27250, 1.26750, 1.26450
Resistance levels: 1.27600, 1.28000
If the price fixes above 1.27600, expect further growth towards 1.28000.
Alternatively, the quotes can descend towards 1.26900-1.26600.
The USD/CAD currency pair
Technical indicators of the currency pair:
Prev Open: 1.31897
Open: 1.32137
% chg. over the last day: +0.24
Day's range: 1.31817 – 1.32164
52 wk range: 1.2727 – 1.3664
USD/CAD continues to consolidate. There is no unidirectional trend. CAD is testing local supply and demand zones: 1.31500-1.31750 and 1.32250-1.32500, respectively. USD/CAD quotes can decline further. Additional support for the CAD is provided by the positive dynamics of oil prices. Positions must be opened from key levels.
The Economic News Feed for 24.06.2019 is calm.
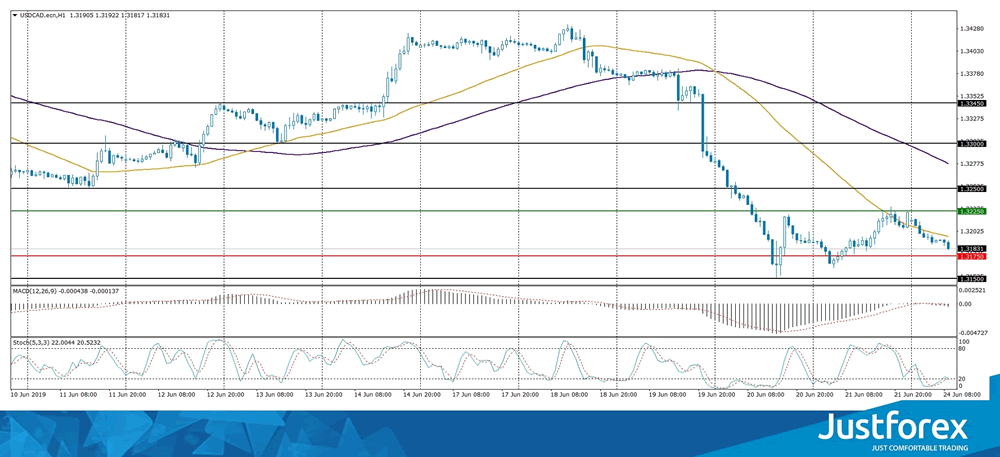
The indicators do not provide precise signals, the price has crossed 50 MA.
The MACD histogram started to descend which points to the bearish mood.
The Stochastic Oscillator is in the oversold zone, the %K line is crossing the %D line. There are no signals at the moment.
Trading recommendations
Support levels: 1.31750, 1.31500, 1.31200
Resistance levels: 1.32250, 1.32500, 1.33000
If the price fixes below 1.31750, expect further descend towards 1.31400-1.31200.
Alternatively, the quotes can grow towards 1.32600-1.32800.
The USD/JPY currency pair
Technical indicators of the currency pair:
Prev Open: 107.288
Open: 107.304
% chg. over the last day: +0.02
Day's range: 107.266 – 107.481
52 wk range: 104.97 – 114.56
The USD / JPY currency pair stabilized after a sharp decline last week. The technical picture is ambiguous. At the moment, the USD / JPY quotes are consolidating. Local levels of support and resistance are: 107.250 and 107.500, respectively. The yen has the potential for further growth against the US dollar. We recommend to pay attention to the dynamics of the yield of US government securities. Positions must be opened from key levels.
The Economic News Feed for 24.06.2019 is calm.
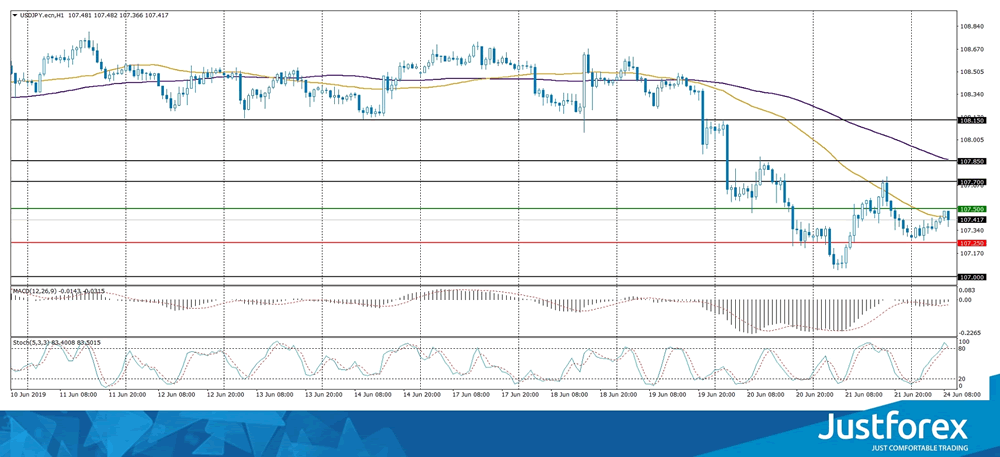
The indicators do not provide precise signals, the price has crossed 50 MA.
The MACD histogram is close to 0. There are no signals.
The Stochastic Oscillator is in the overbought zone, the %K line is crossing the %D line. There are no signals.
Trading recommendations
Support levels: 107.250, 107.000
Resistance levels: 107.500, 107.700, 107.850
If the price fixes below 107.250, expect further descend towards 107.000-106.800.
Alternatively, the quotes can grow towards 107.800-108.000.