

Sample Category Title
UK GDP contracted -0.4% in April, widespread weakness across manufacturing, EUR/GBP upside breakout
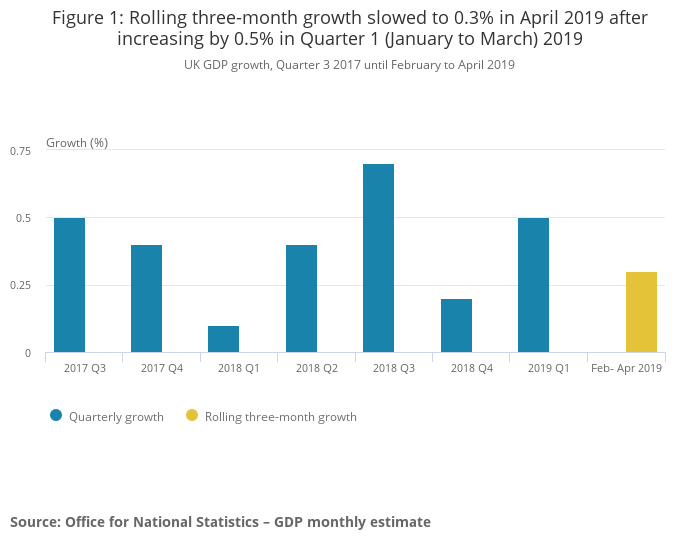
UK GDP contracted -0.4% mom in April, much worse than expectation of -0.1% mom. Index of production dropped -2.7%, manufacturing dropped -3.9% and construction dropped -0.4%. Index of services and agriculture were flat mom. In the three months to April, GDP grew 0.3%, slowed from 0.5% in the period from January to March..
Head of GDP Rob Kent-Smith said: "GDP growth showed some weakening across the latest 3 months, with the economy shrinking in the month of April mainly due to a dramatic fall in car production, with uncertainty ahead of the UK's original EU departure date leading to planned shutdowns. There was also widespread weakness across manufacturing in April, as the boost from the early completion of orders ahead of the UK's original EU departure date has faded."
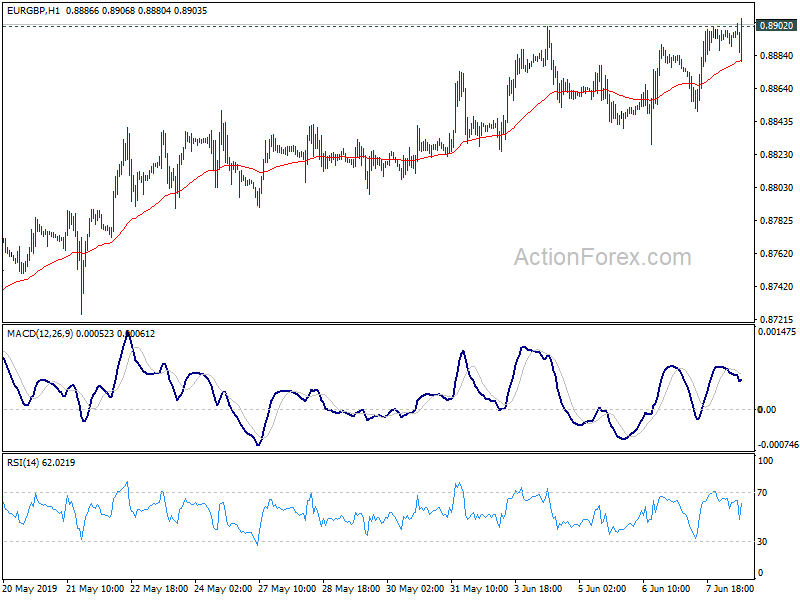
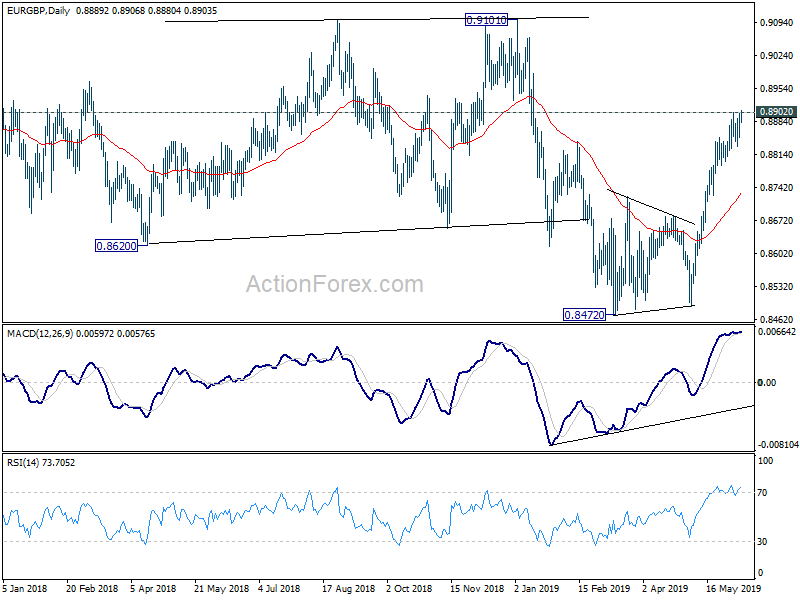
EUR/GBP breached 0.8902 temporary top after the release. It should be resuming recent rise from 0.8472 towards 0.9101 key resistance.
USD/MXN Drops As Trariffs On Mexico Are Called Off
USD/MXN returned to prior levels as the US President made a U-turn and the two sides stroke a deal avoiding tariffs. We suspect that the political pressure within the US President’s party, may also have contributed to the agreement being reached. USD gains though, seem to remain in check, as on Friday a weak US employment report was released. We expect that the weak employment data for May, released on Friday to increase pressure on the Fed to proceed with a rate cut as a loss of economic momentum seems to be threatening the US economy. We expect the USD to book some gains as it recovers from Friday’s drop yet the prospect of a Fed rate cut may keep any gains under control. USD/MXN dropped during today’s Asian session, breaking all support levels set and landing below the 19.265 (R1) support line (now turned to resistance). We could see the pair dropping even further, in the aftermath of the deal struck, yet at a technical level it should be noted that the RSI indicator in the 1-hour chart remains below the reading of 30 (implying a rather overcrowded short position. Should the bears maintain control over the pair’s direction, we could see it breaking the 19.175 (S1) support line and aim the 19.090 (S2) support level. Should the pair’s direction be dictated by the bulls, we could see it breaking the 19.265 (R1) resistance line and aim for the 19.365 (R2) resistance level.
WTI prices rise as OPEC cuts are expected
WTI prices are on the rise, as the market seems to expect the OPEC+ group to maintain its production cuts. On Friday, Saudi officials had stated that the group was close to agree extended supply cuts. The rise seems to have been moderated somewhat as the US lifted the possibility of tariffs on Mexico, hence removing an uncertainty. Analysts seems to question the sustainability of the price increase and link it to the economic performance of a number of industrial economies. Oil prices may continue to rise should the threat of production cuts continue to loom over the market, or if economic forecast boost expectations for increased global demand. WTI prices rose yesterday testing the 54.45 (R1) resistance line. Should the commodity continue rise in value, we could see it breaking the 54.45 (R1) resistance line and aim for the 56.00 (R2) resistance level. On the flip side, should WTI come under the selling interest of the market, we could see WTI prices aiming if not breaking the 52.70 (S1) support line.
Other economic highlights, today and early tomorrow
Today during the European session, we get UK’s GDP growth rates for April and in the American session we get Canada’s number of House starts for May.
As for the rest of the week:
On Tuesday, we get from the UK the employment data for April and the US PPI rate for May. On Wednesday, we get the US inflation rates for May. On Thursday, we get from Australia May’s employment data and Eurozone’s industrial production for April. On Friday, we get China’s industrial production for May, the US retail sales for May, the US industrial production for May and the US preliminary Michigan consumer Sentiment for June.
USD/MXN H1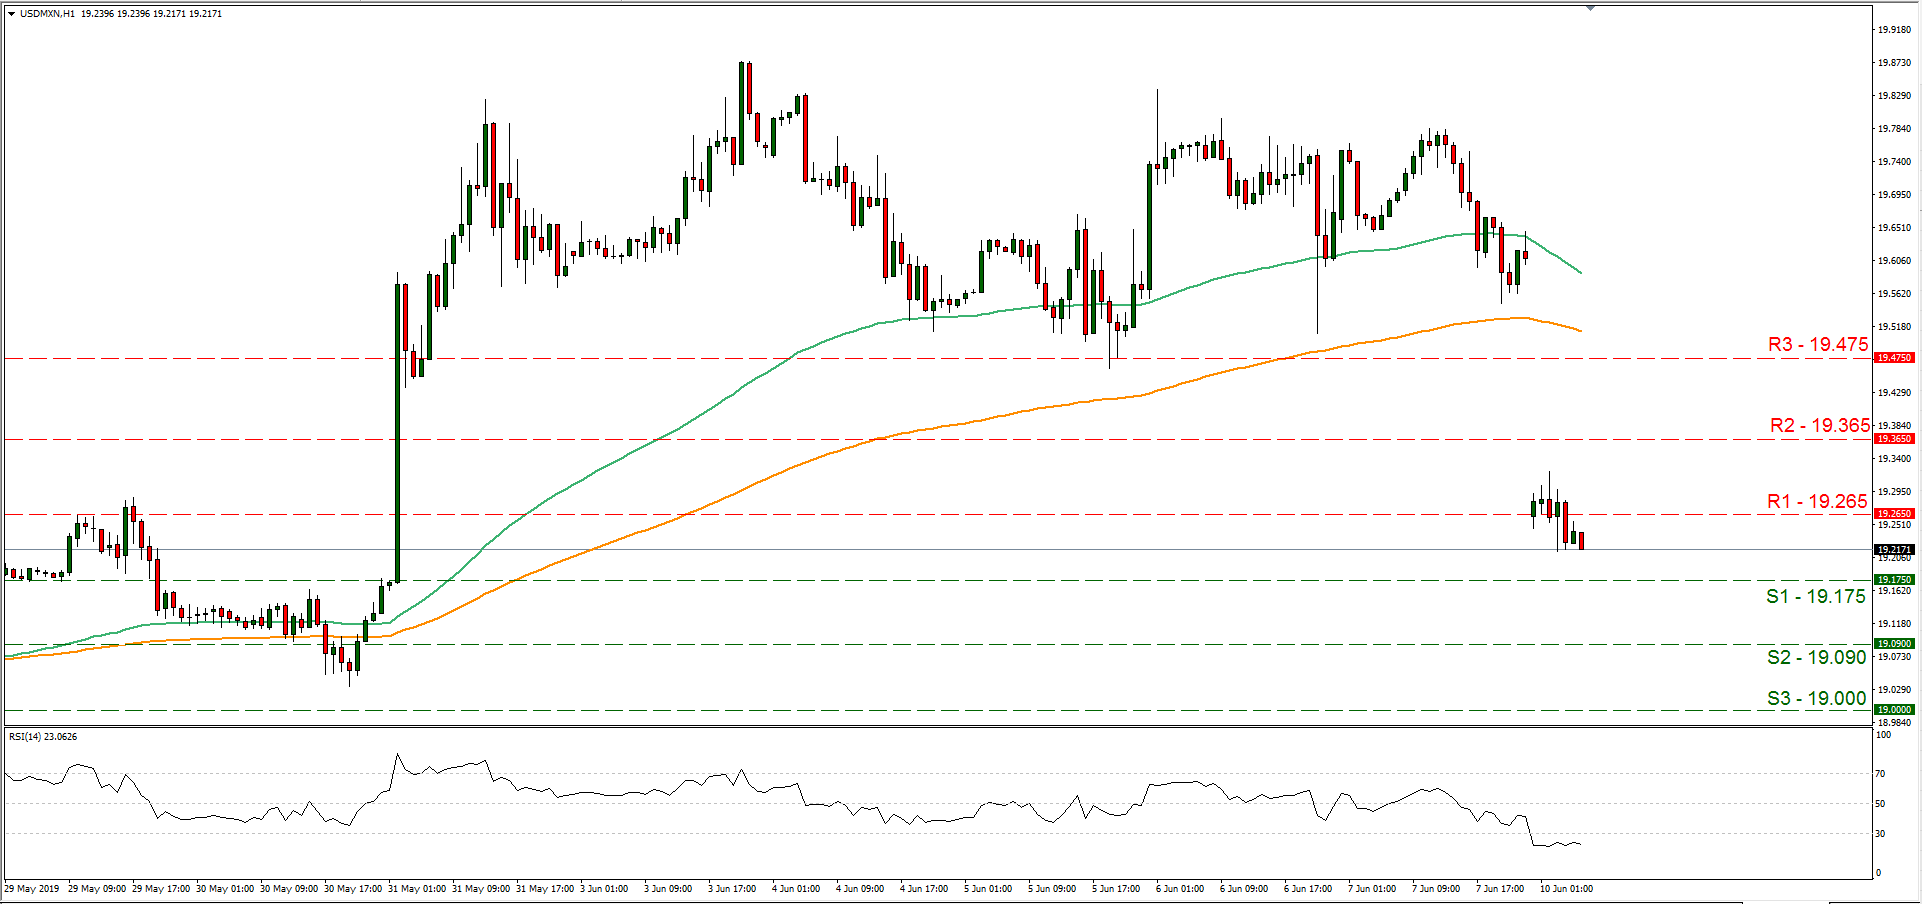
Support: 19.175 (S1), 19.090 (S2), 19.000 (S3)
Resistance: 19.265 (R1), 19.365 (R2), 19.475 (R3)
WTI H4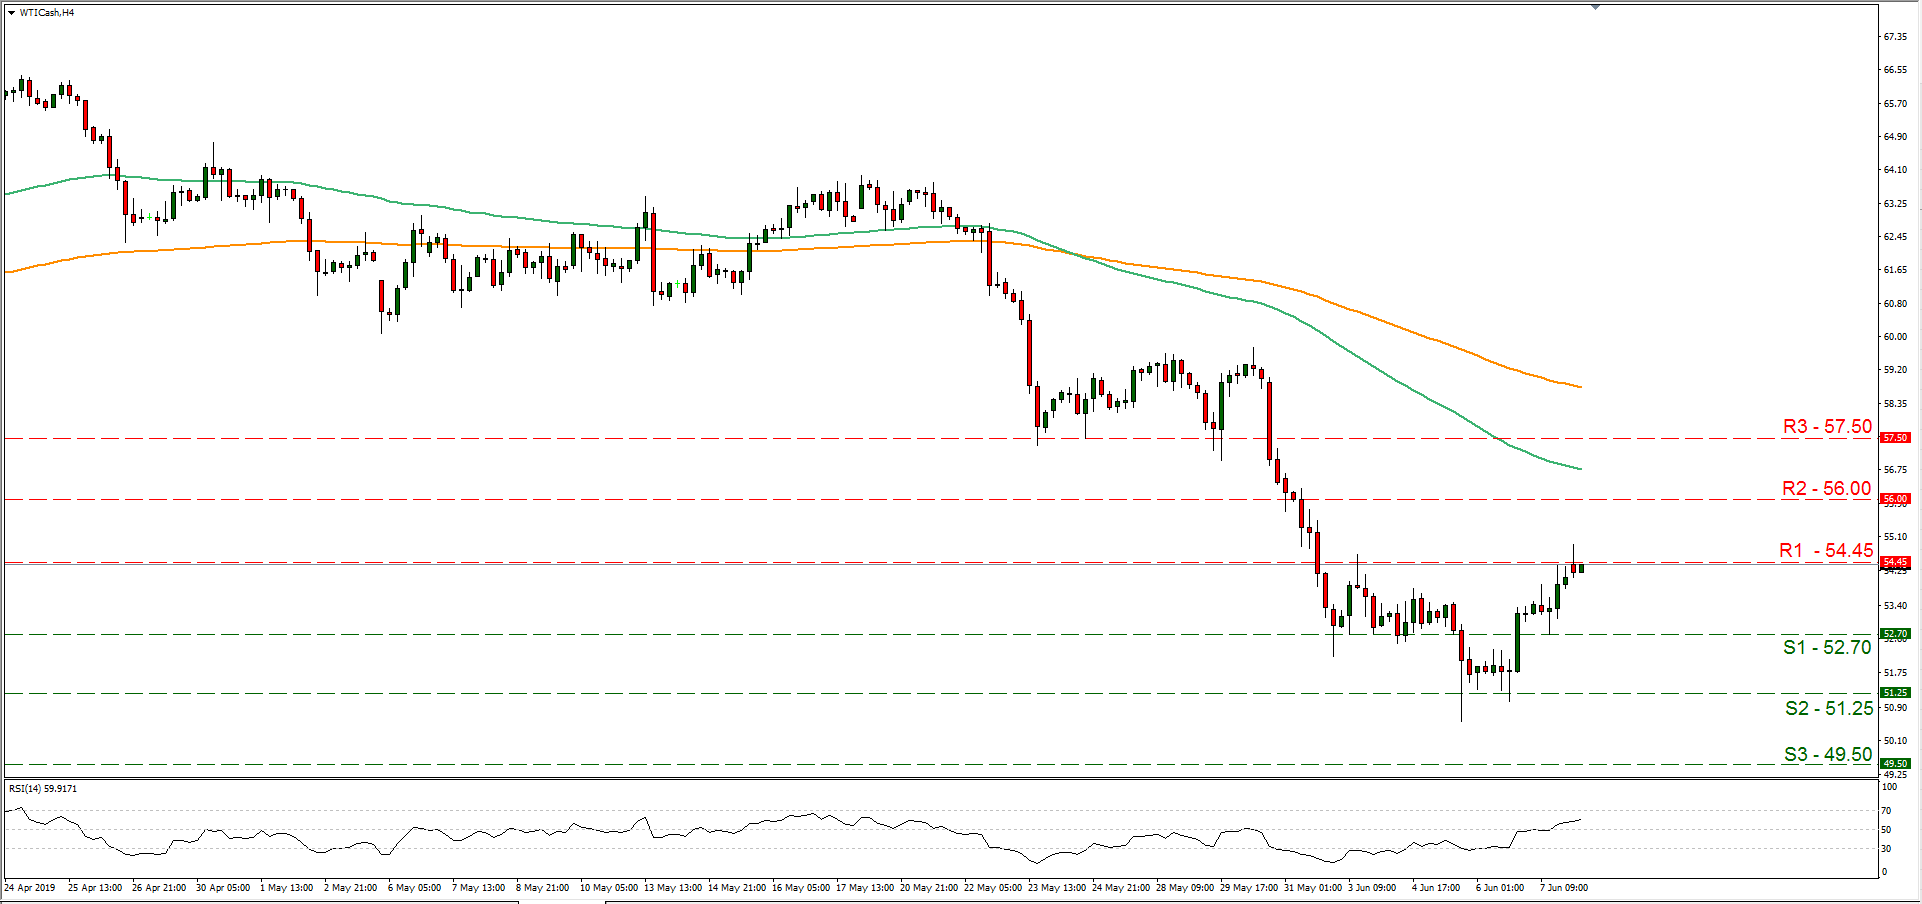
Support: 52.70 (S1), 51.25 (S2), 49.50 (S3)
Resistance: 54.45 (R1), 56.00 (R2), 57.50 (R3)
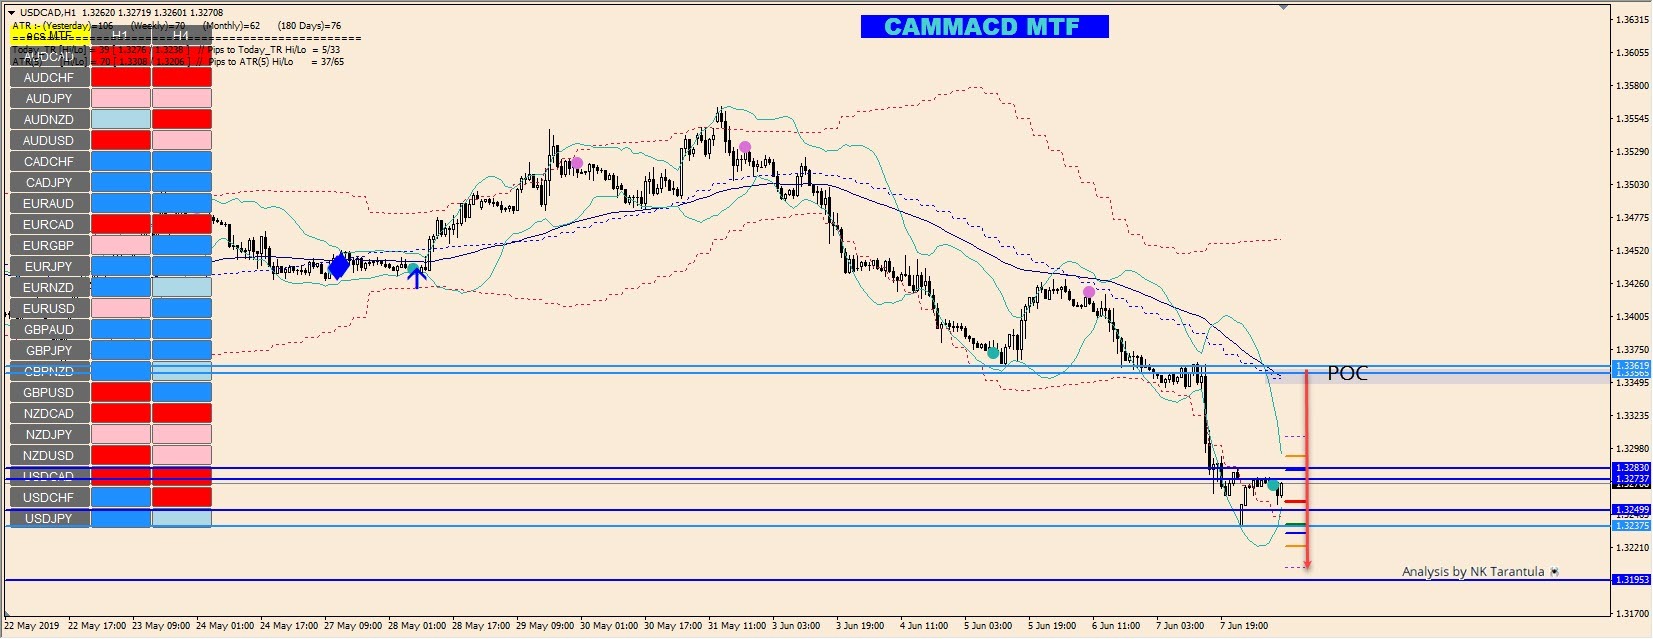
USD/CAD Downtrend As Long As The Price Is Below 1.3365
The USD/CAD could possibly make a retracement move towards the POC Zone. The pair is in the oversold territory.
1.3350-60 is the POC zone, where we could see fresh sellers. A shorter retracement could target the ATR top – 1.3308. Look for bearish reversal pattern that could see a drop from any of those levels towards 1.3273, 1.3237 and 1.3200. The signal for a potential retracement (counter trend) is a green dot on the chart at 1.3273 level. Watch for an interim bullish price action above the 1.3273 towards either the ATR high or the POC zone.
The Analytical Overview Of The Main Currency Pairs
The EUR/USD currency pair
Technical indicators of the currency pair:
Prev Open: 1.12760
Open: 1.13219
% chg. over the last day: +0.51
Day's range: 1.13025 – 1.13303
52 wk range: 1.1111 – 1.2009
On Friday, June 7, USD kept losing positions against the majors. USD published a weak labour market report for May. The non-agrarian industry created 75K new jobs, which is below the market expectations of 185K. The average hourly wage grew by 0.2% in comparison to the forecasted 0.3%. The unemployment level is without changes at 3.6%. The quotes are consolidating around 1.13000-1.13450. The trading instrument can grow further. Open positions from the key levels.
At 17:00 (GMT+3:00) the US will publish a JOLTS report.
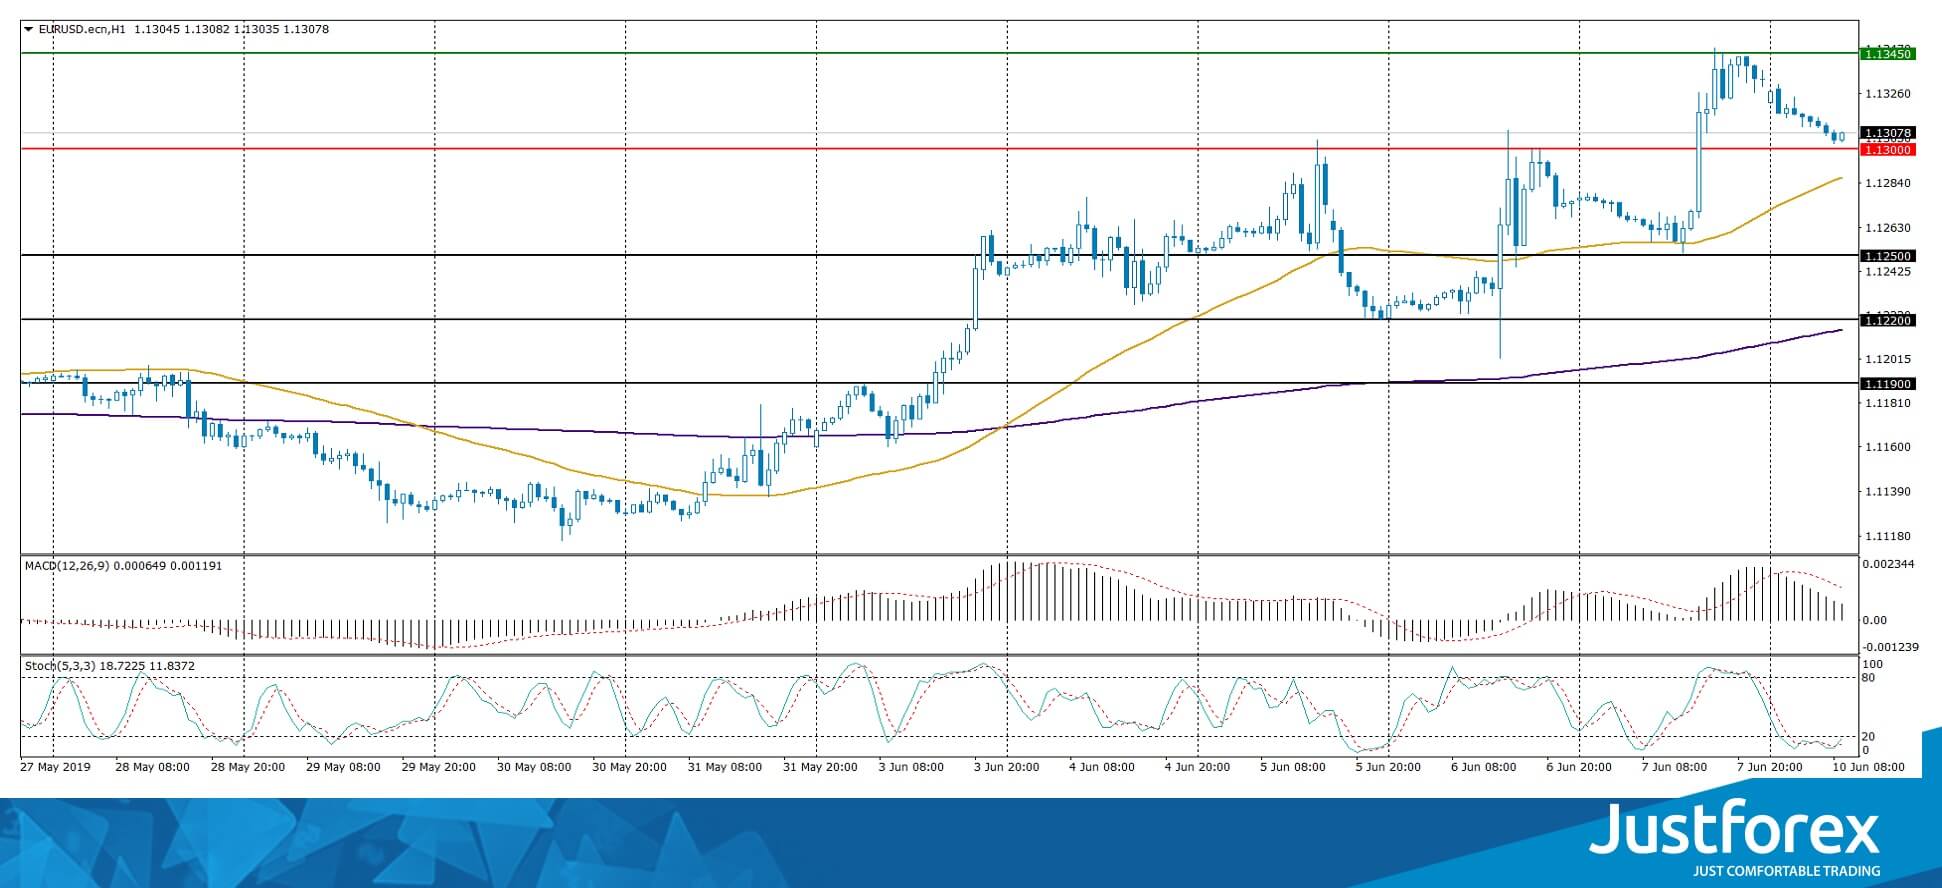
The price fixed above 50 MA and 200 MA which points to the power of the buyers.
The MACD histogram is in the positive zone but below the signal line which gives a weak signal to buy EUR/USD.
The Stochastic Oscillator is in the oversold zone, the %K line is crossing the %D line. There are no signals at the moment.
Trading recommendations
Support levels: 1.13000, 1.12500, 1.12200
Resistance levels: 1.13450, 1.14000
If the price fixes above 1.13450, expect further growth towards 1.13700-1.14000.
Alternatively, the quotes can descend towards 1.12600-1.12400.
The GBP/USD currency pair
Technical indicators of the currency pair:
Prev Open: 1.26876
Open: 1.27264
% chg. over the last day: +0.28
Day's range: 1.27012 – 1.27359
52 wk range: 1.2438 – 1.3631
GBP/USD shows an ambiguous technical picture. There is no defined trend. Right now GBP is consolidating, the investors are waiting for important economic reports from the UK. The local support and resistance levels are 1.26850 and 1.27250. You should open positions from the key levels.
The Economic News Feed for 10.06.2019:
GDP Report (UK) – 11:30 (GMT+3:00);
Industrial Production Volume (UK) – 11:30 (GMT+3:00);
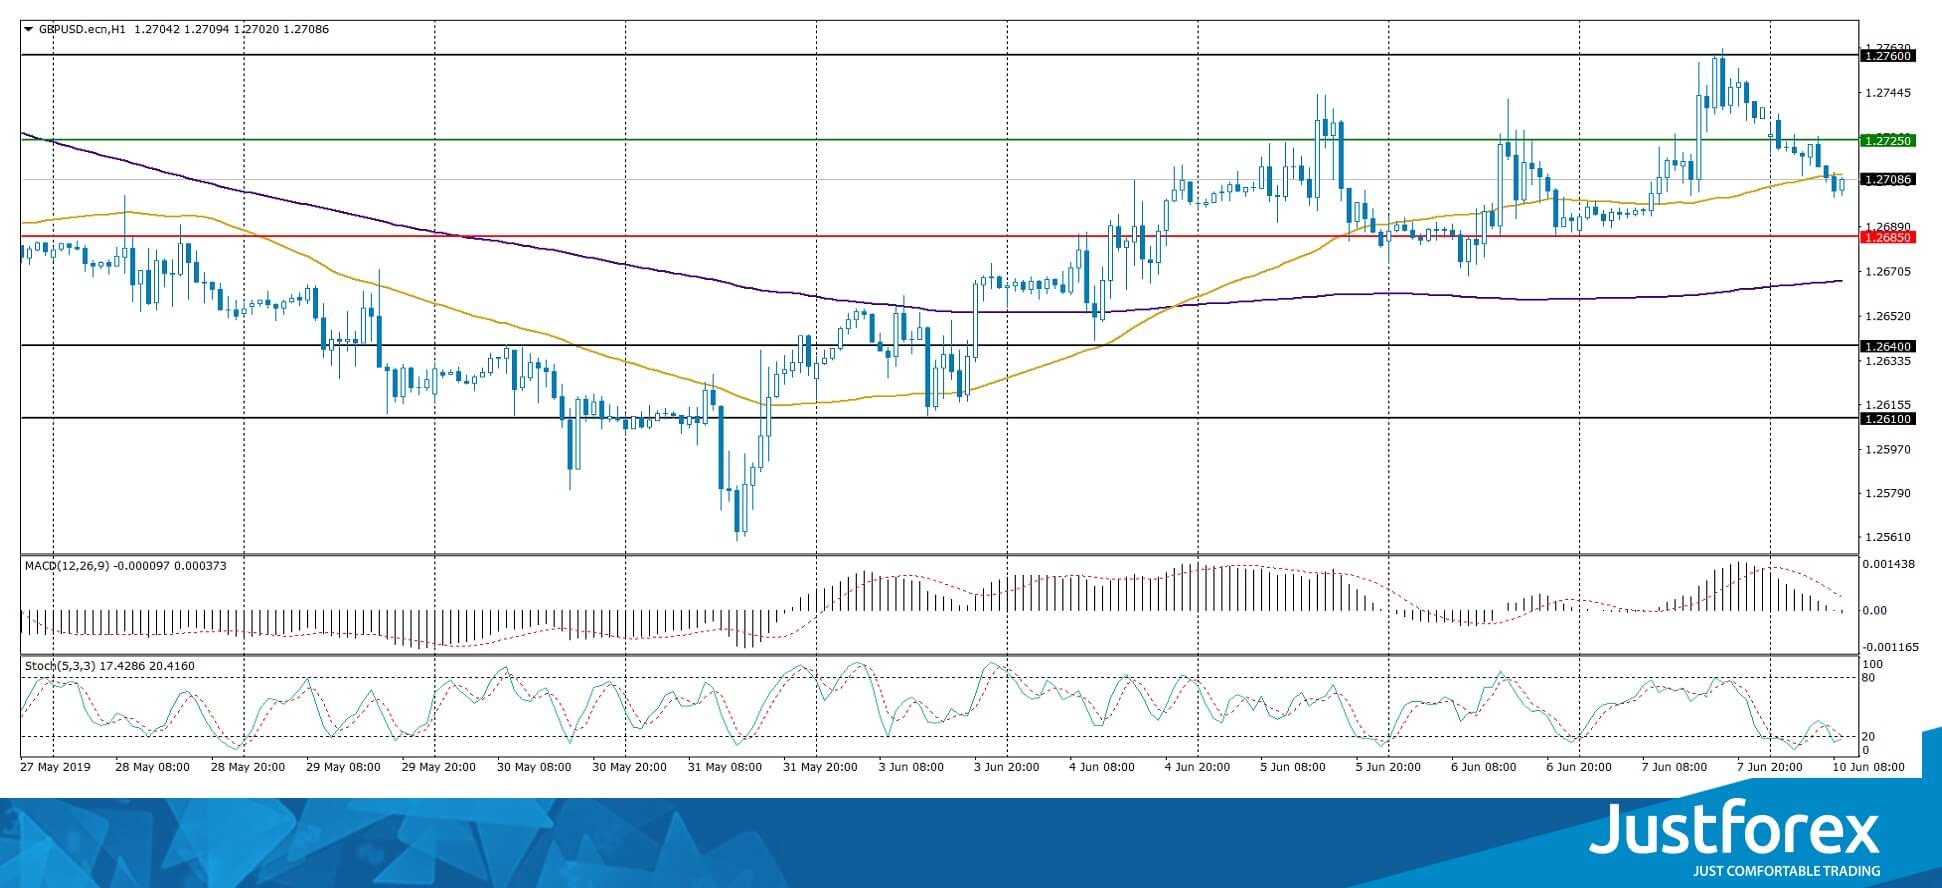
The indicators do not provide precise signals, the price has crossed 50 MA.
The MACD histogram is close to 0.
The Stochastic Oscillator is near the oversold zone, the %K line is crossing the %D line. There are no signals at the moment.
Trading recommendations
Support levels: 1.26850, 1.26400, 1.26100
Resistance levels: 1.27250, 1.27600
If the price fixes above 1.27250, expect further growth towards 1.27600-1.27800.
Alternatively, the quotes can descend towards 1.26500-1.26300.
The USD/CAD currency pair
Technical indicators of the currency pair:
Prev Open: 1.33617
Open: 1.32395
% chg. over the last day: -0.71
Day's range: 1.32395 – 1.32768
52 wk range: 1.2727 – 1.3664
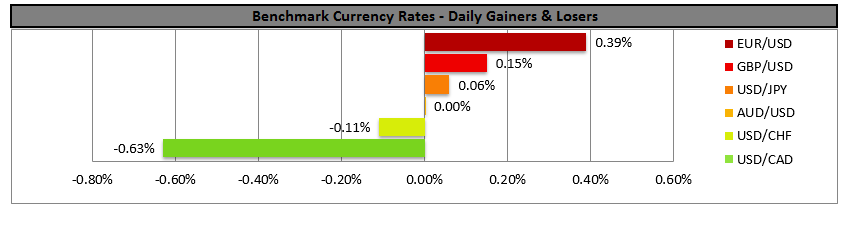
USD/CAD remains in the bearish mood. Friday was marked by agressive sales. The quotes updated the key minimums. The demand for CAD grew after a positive labour market report from Canada. An additional support is granted by the recovering oil quotes. The USD/CAD is consolidating around 1.32400-1.32900 and can descend further. You should open positions from the key levels.
At 15:30 (GMT+3:00) Canada will publish the construction permission report.
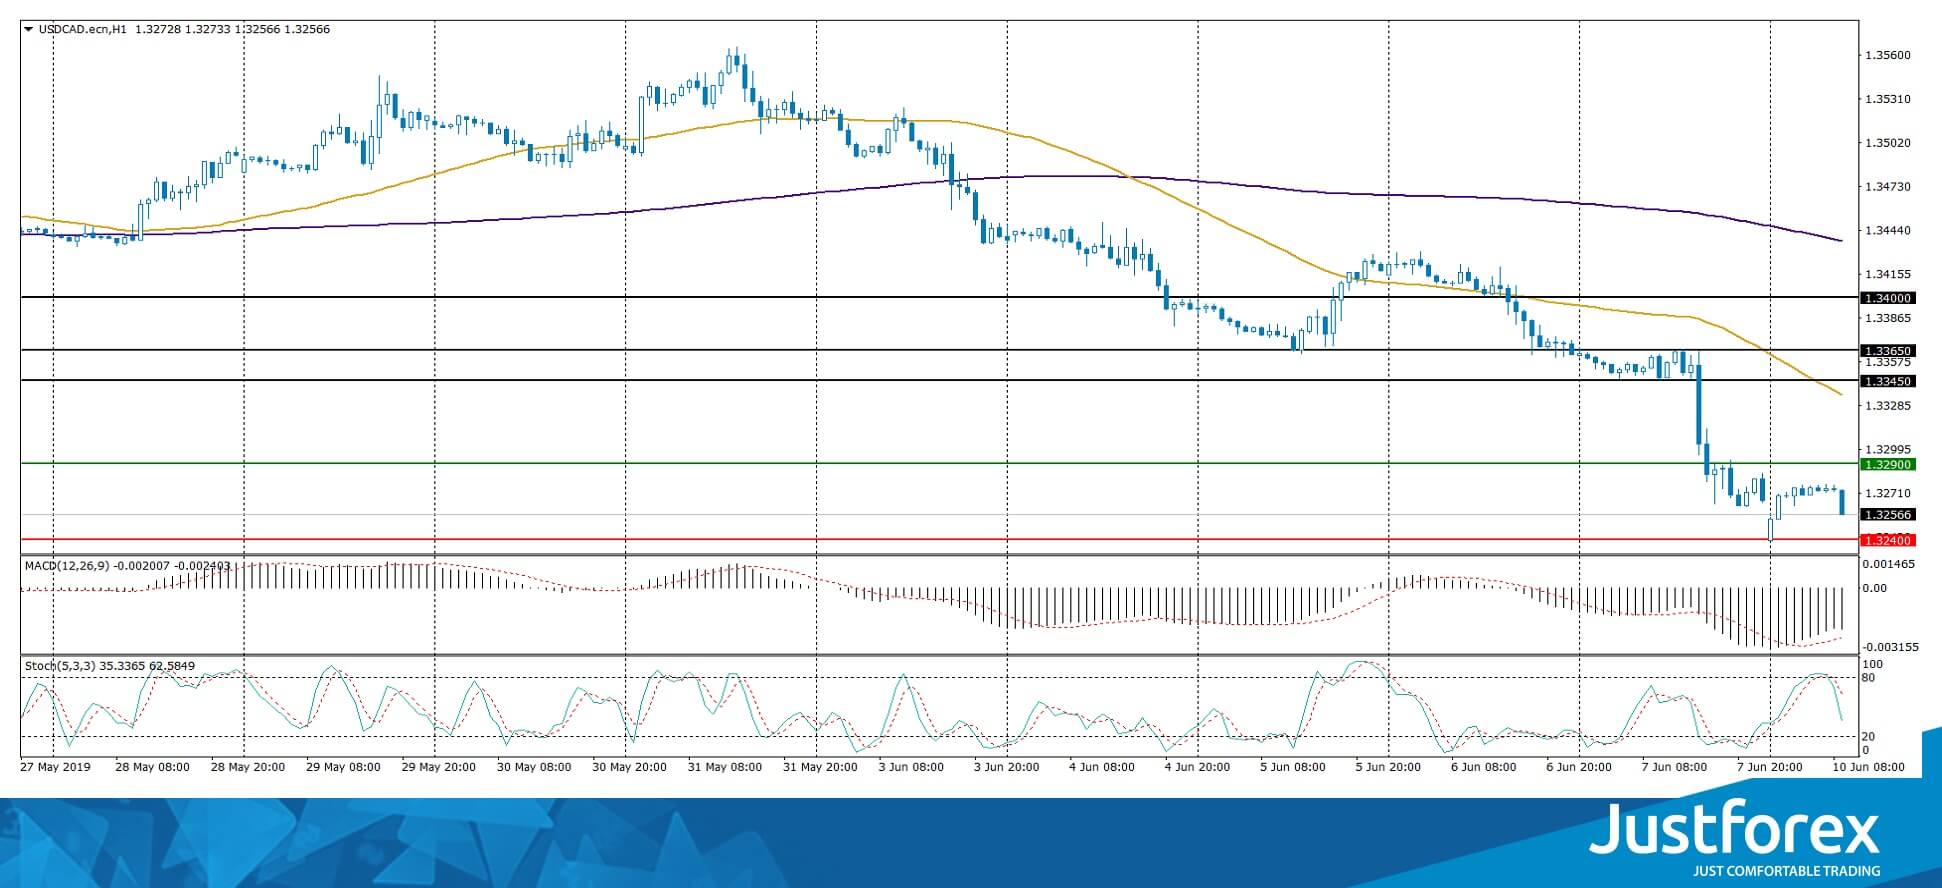
The price fixed below 50 MA and 200 MA which points to the power of the sellers.
The MACD histogram is in the negative zone but above the signal line which points towards selling USD/CAD.
The Stochastic Oscillator is in the neutral zone, the %K line is below %D which points to the bearish mood.
Trading recommendations
Support levels: 1.32400, 1.32000
Resistance levels: 1.32900, 1.33450, 1.33650
If the price fixes below 1.32400, expect further descend towards 1.32000.
Alternatively, the quotes can correct towards 1.33300-1.33500.
The USD/JPY currency pair
Technical indicators of the currency pair:
Prev Open: 108.399
Open: 108.465
% chg. over the last day: -0.21
Day's range: 108.366 – 108.675
52 wk range: 104.97 – 114.56
The USD/JPY keeps trading in the long flat. There is no defined trend. The key instrument tests the local resistance at 108.650 with 108.300 acting as the nearest support. The quotes can recover further. Keep an eye on the US Treasury bonds' yield and open positions from the key levels.
During the Asian trading session, Japan published a positive GDP report.
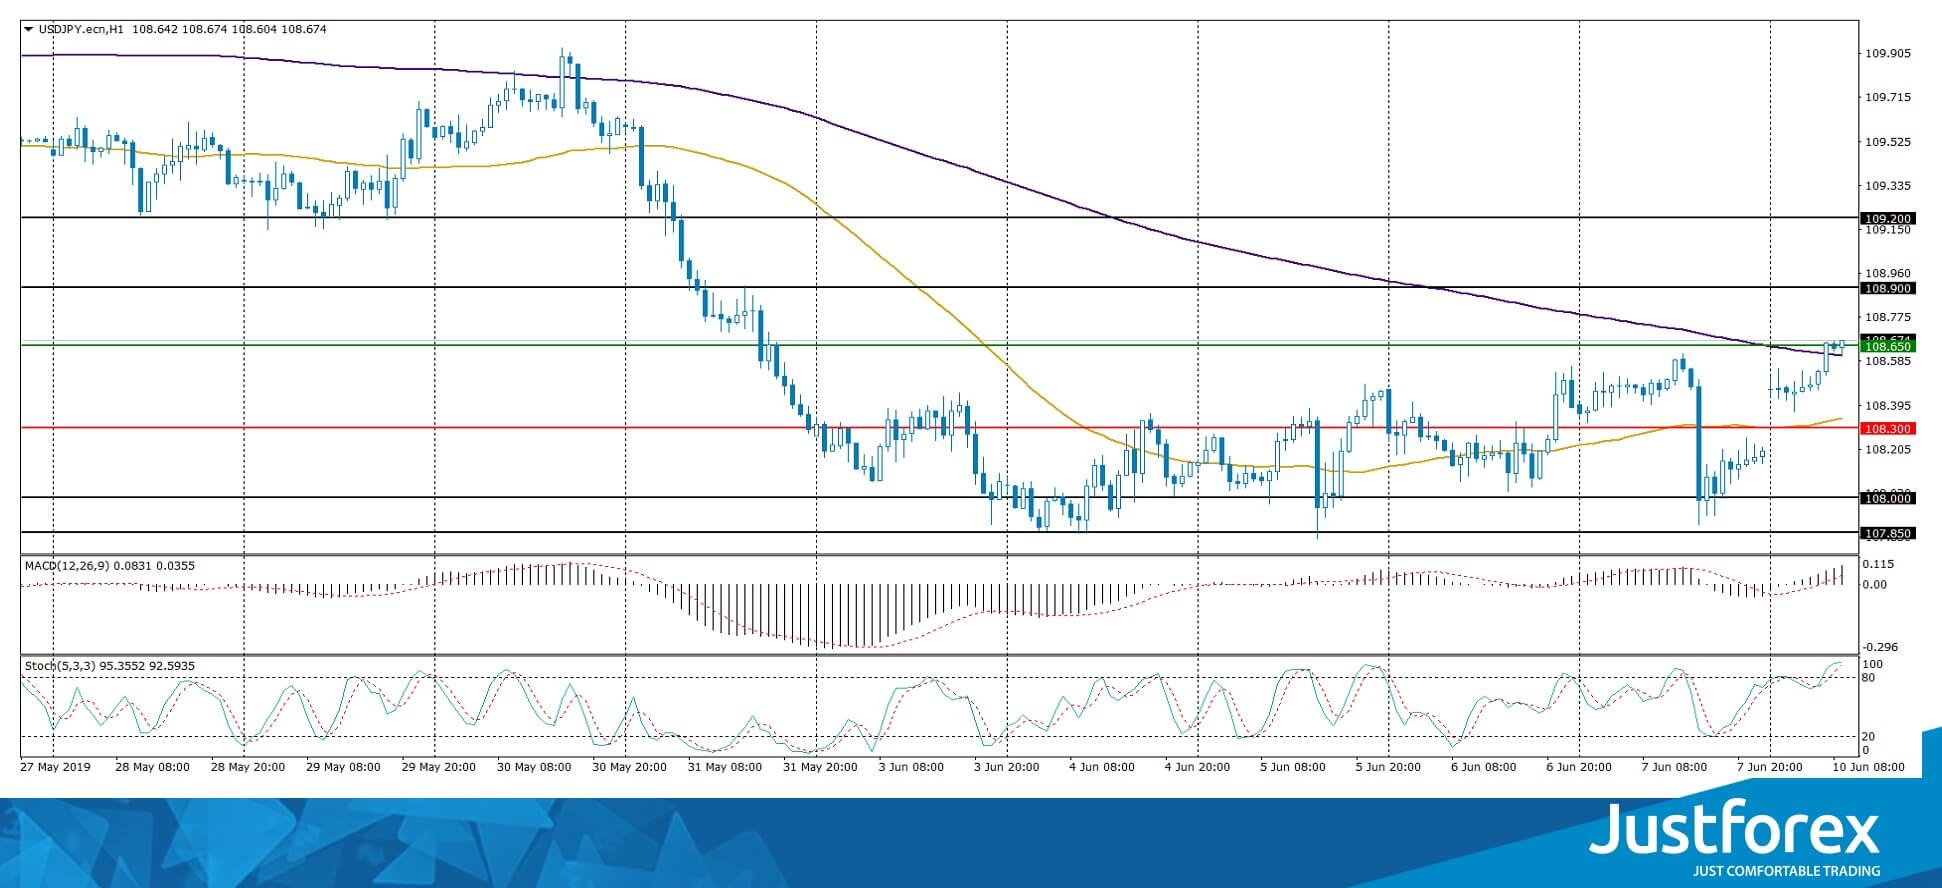
The indicators do not provide precise signals, the price crossed 200 MA.
The MACD histogram is in the positive zone which points to the bullish mood.
The Stochastic Oscillator is in the oversold zone, the %K line is above the %D line which gives a weak signal to buy USD/JPY.
Trading recommendations
Support levels: 108.300, 108.000, 107.850
Resistance levels: 108.650, 108.900, 109.200
If the price fixes above 108.650, expect further growth towards 108.900-109.200.
Alternatively, the qutoes can descend towards 108.000.
Forex Technical Analysis: EUR/USD, USD/JPY, GBP/USD
EUR/USD
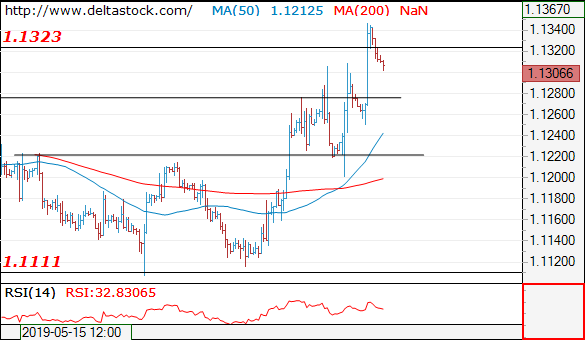
Current level - 1.1306
The uptrend is still intact, and crucial on the downside is 1.1250 low, as only a slide below will signal a reversal of the general upmove.
| Resistance | Support | ||
| intraday | intraweek | intraday | intraweek |
| 1.1390 | 1.1450 | 1.1300 | 1.1015 |
| 1.1450 | 1.1450 | 1.1250 | 1.0860 |
USD/JPY
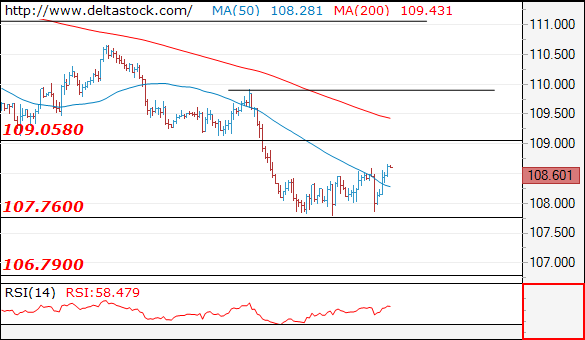
Current level - 108.60
The last test of 107.70 failed as well and the bias is positive, for a test of 109.05.
| Resistance | Support | ||
| intraday | intraweek | intraday | intraweek |
| 109.05 | 109.90 | 107.70 | 107.70 |
| 109.05 | 112.40 | 106.70 | 106.70 |
GBP/USD
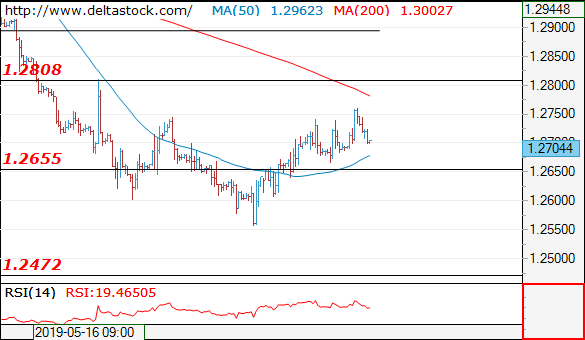
Current level - 1.2704
The overall bias remains positive, with a risk of a continuation towards 1.2810. Crucial on the downside is 1.2650 area.
| Resistance | Support | ||
| intraday | intraweek | intraday | intraweek |
| 1.2750 | 1.2960 | 1.2650 | 1.2570 |
| 1.2810 | 1.3170 | 1.2550 | 1.2470 |
EURUSD Reverses Near 1.1300 After Posting 2½-Month High
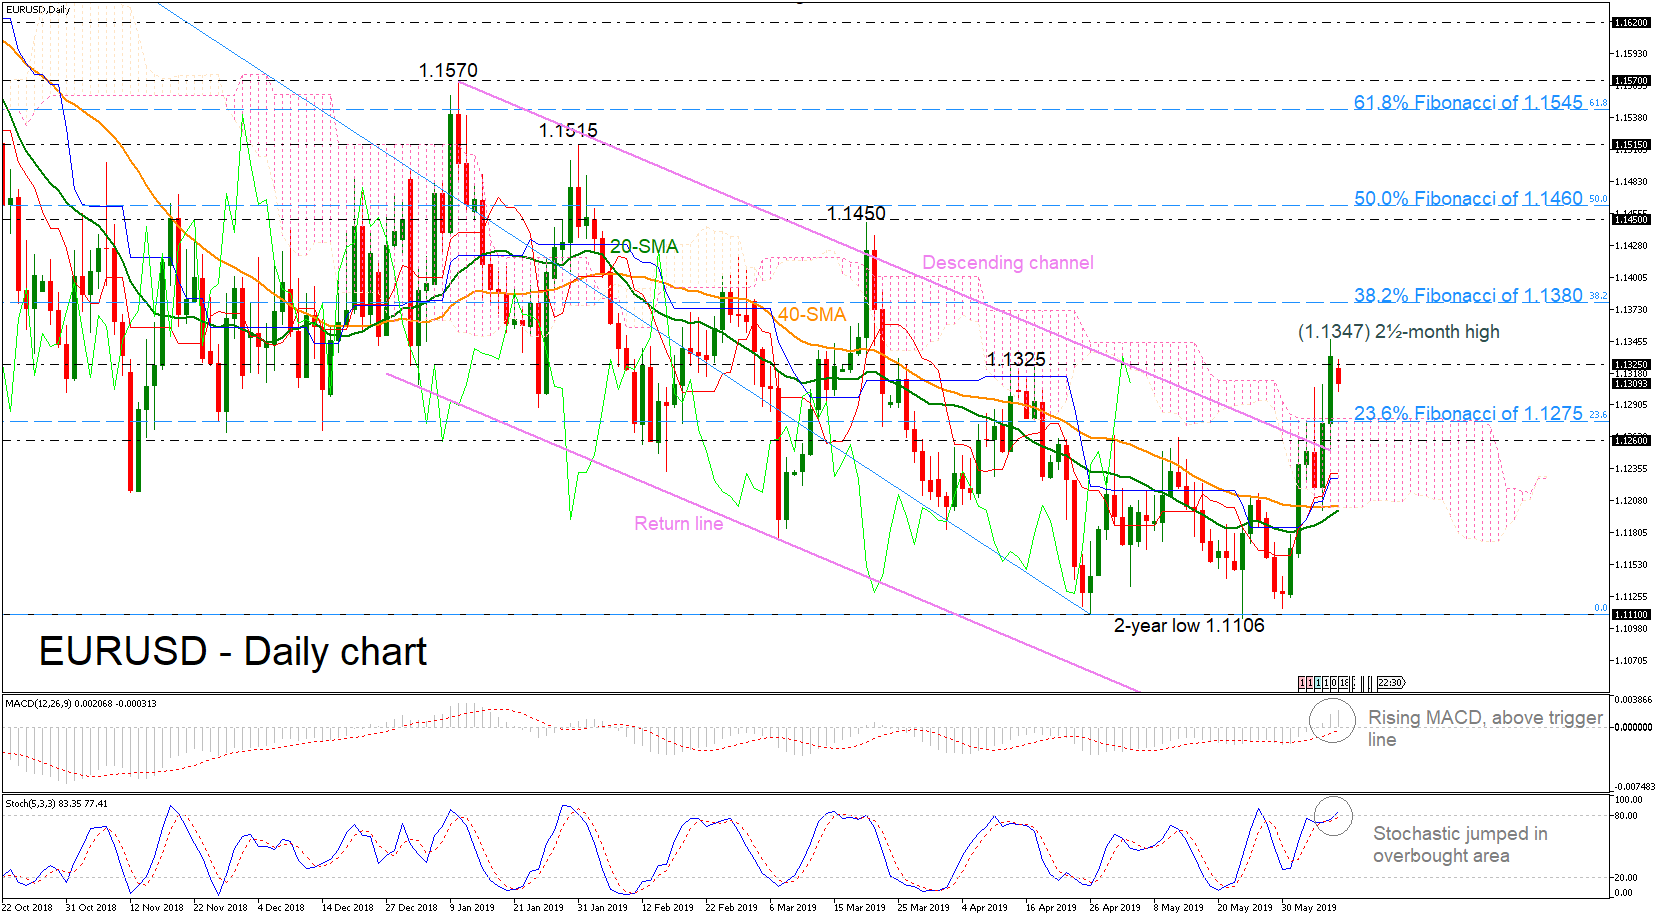
EURUSD reached a two-and-a-half-month high of 1.1347 on Friday as the pair exited from the medium-term descending channel in the preceding days, signaling furhter upside movement. Prices are currently developing near the 1.1300 handle and are remaining above the Ichimoku cloud and the 20-and 40-day moving averages.
Despite today's pullback the bullish picture is further supported by short-term technical indicators. The MACD is strengthening its momentum above the trigger line, while the stochastic oscillator is entering overbought territory.
To the upside, immediate resistance could come at the 1.1325 area, taken from peaks on April 12, while above that, the next major resistance to watch is the 38.2% Fibonacci retracement level of the downleg from 1.1815 to 1.1106 near 1.1380.
Should prices reverse lower, support could be faced at the 1.1275 barrier, which is the 23.6% Fibonacci mark. Slightly lower, the 1.1260 area could be penetrated before the pair heads towards the moving averages, currently around 1.1200.
To sum up, the short-and medium-term picture shifted from bearish to bullish after the violation of the downward sloping channel and the 1.1300 psychological level. Traders should turn their attention to the upside if there is a jump above Friday's peak.
Gold Gains As Market Shift To Dovish Policy
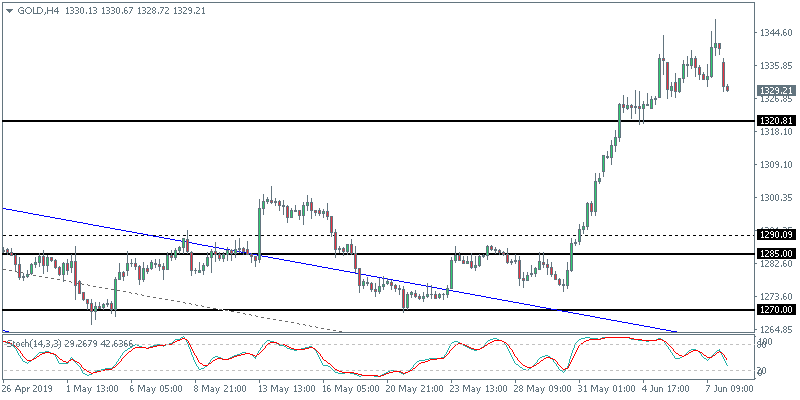
Friday’s payrolls report gave a jolt to gold prices which enjoyed a stellar rally last week. The gains came about as investors now expect the Fed to cut rates this year. While there has been speculation about the rate cuts, this view gains traction in light of the recent weakness in the labor market. Gold prices tested highs of 1348 on Friday before retreating modestly lower by Friday’s close.
Will Gold Advance Higher?
The recent gains in gold prices have been sharp and rapid. There is scope that price could correct in the near term. The initial support is seen at the 1320 handle which could offer support in case of a correction. However, for this to happen, the current momentum needs to slow. Watch for potential divergences near the current highs which could signal a possible dip to the 1320 level in the near term.
Crude Oil Tests A Four-Day High
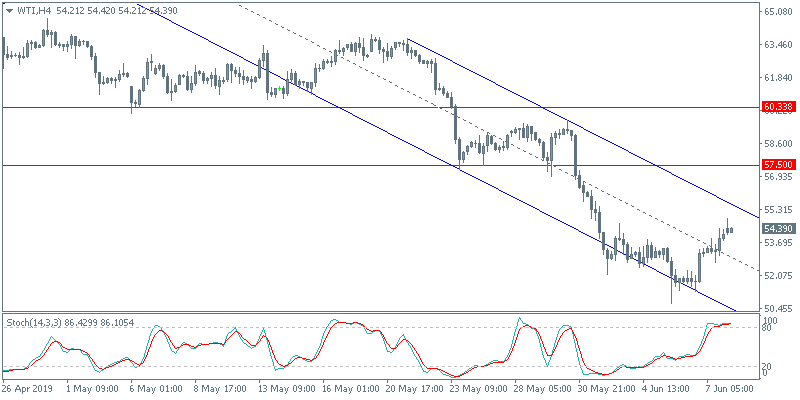
Oil prices were seen attempting to maintain the bullish gains from Thursday. Price tested a four-day high of 54.38 before retreating by Friday’s close. There are some early indications that price is bottoming out. But at the same time, there are also risks that oil prices could break down from the current pivot lows that are formed.
Can WTI Rebound from the Current Lows?
The main resistance level is seen at the 57.50 handle. Therefore, this makes a likely price level that oil prices could correct to in the near term. With the OPEC meeting due in the last week of June, oil prices could be subject to some volatility. The downside target of 50.00 remains within sight for the moment, making it the likely downside target.
Euro Jumps To A Three-Month High
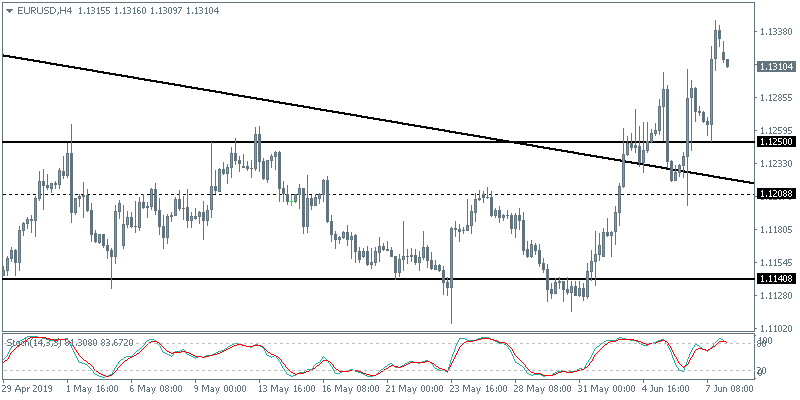
The euro currency was seen posting strong gains as the common currency rose to a three-month high. The gains in the euro came about mostly on a weaker USD. Economic data from the Eurozone was limited. French industrial production figures saw a 0.4% increase beating estimates of a 0.3% increase. But Italian retail sales stayed flat against estimates of a 0.2% increase.
Will the EURUSD Trend Higher?
The breakout in the currency pair above the 1.1250 level marks a modest milestone. The next main target for the EURUSD will be the 1.1400 region. This level was previously tested for resistance. Further gains in the currency pair will likely see a retest of this level in the near term. To the downside, the support at 1.1250 could be tested. This correction could potentially attract new buyers into the market.
Dollar Rebounds After Disappointing US Jobs Data, Could The DXY Attempt A Recovery?
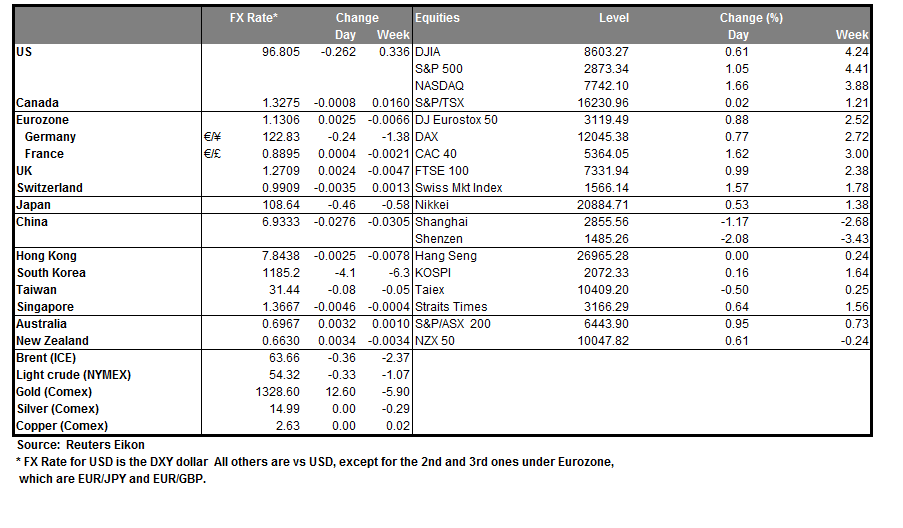
The US Dollar Index (DXY) has rebounded slightly early on Monday to trade around the 96.7 level at the time of writing, despite the USD sell-off that transpired following the latest United States employment report coming in far below market expectations.
Despite shedding over one percent so far this month, the current levels in the DXY will be attractive to potential Dollar buyers. The Dollar has managed to show its resilience to periods of weakness several times over the past 12 months, and investors will be closely monitoring whether it will be able to take this latest setback from the employment report in its stride.
What is more concerning for the DXY moving forward is that several US economic indicators in the second quarter have suggested that US economic growth momentum is cooling, raising speculation that the Federal Reserve will need to cut interest rates over the coming months. The US central bank may well intervene on its monetary policy settings to sustain growth in the world’s largest economy, which is on the cusp of reaching its longest-ever expansion come July.
Even though ramped-up market bets for a Fed rate cut this year have created a somewhat Dollar-negative environment, those hoping for the DXY to capitulate may be left disappointed, given the relatively weak pushback from other G10 currencies. Economic woes continue to cloud the Euro’s outlook, while the Pound remains mired in the Brexit fog, implying that these fluctuations in the Dollar Index could only provide little upside to other global currencies.
Trade tensions are still seen as the most significant threat to both global growth and investor sentiment, meaning that the Dollar, Yen and Gold will remain attractive assets for investors if the prolonged trade tensions carry a threat to the global growth outlook.
Oil recovers as Saudi Arabia and Russia appear to agree on extending production cuts
Brent futures are making further strides above the $60/bbl support level and on course for three consecutive days of gains, after the Saudi Arabian Energy Minister expressed confidence that OPEC+ producers will prolong their output cuts programme through the second half of 2019.
With Oil prices recently flirting within a bear market, slowing global demand appears to be featuring prominently on the minds of investors, as the fallout from heightened trade tensions continues to be felt on the global economy.The sustainability of Oil’s recent climb could be determined by the outlooks ofseveral key industry bodies scheduled this week, whereby more downcast projections for global demandwill be used as a threat to prompt traders to continue chipping away atOil’s 15 percent year-to-date gains.
Risk appetite clawing back on Monday
Risk-on mode appears to be seeping back into the markets on Monday, with most Asian stocks starting off the new week on a stronger note. Gold fell 0.9 percent and is now trading below the $1,330 handle while the Japanese Yen erased Friday’s gains to trade above the 108.4 mark against the Dollar at the time of writing.
Asian currencies however are mostly weaker given the Dollar’s rebound. Today’s price action in Asian FX once again highlights the narrative surrounding Asian currencies which remains a Dollar-driven story, even as regional economies contend with the headwinds felt from the heightened uncertainties surrounding the global growth outlook.
Further bouts of risk aversion sparked by another escalation in trade tensions, particularly betweeen the US and China, could undo recent gains for Asian currencies, while severely curtailing appetite for risky assets.