

Sample Category Title
USD/CHF Daily Outlook
Daily Pivots: (S1) 0.9841; (P) 0.9896; (R1) 0.9933; More...
Intraday bias in USD/CHF remains neutral for consolidation above 0.9854 temporary low. Upside of recovery should be limited by 1.0008 support turned resistance and bring fall resumption. On the downside, break of 0.9854 will extend the decline from 1.0237 to 0.9716 cluster support (50% retracement of 0.9186 to 1.0237 at 0.9712).
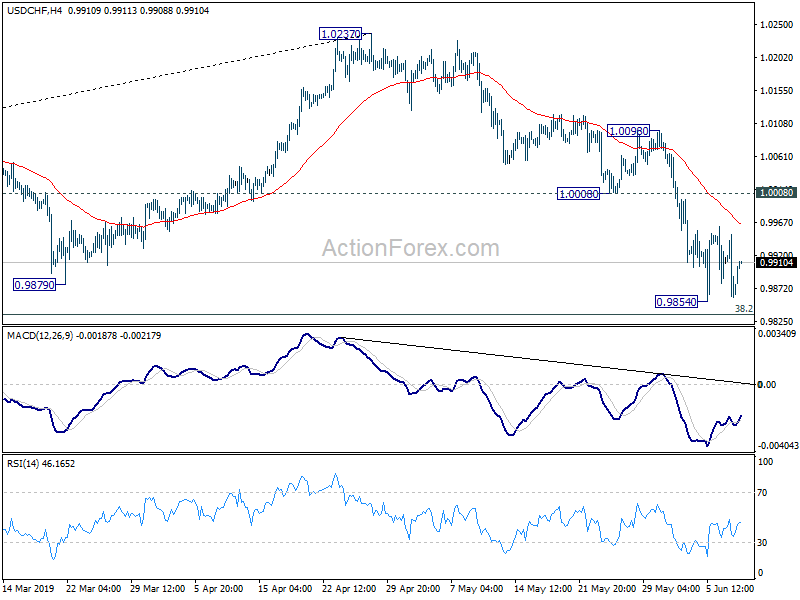
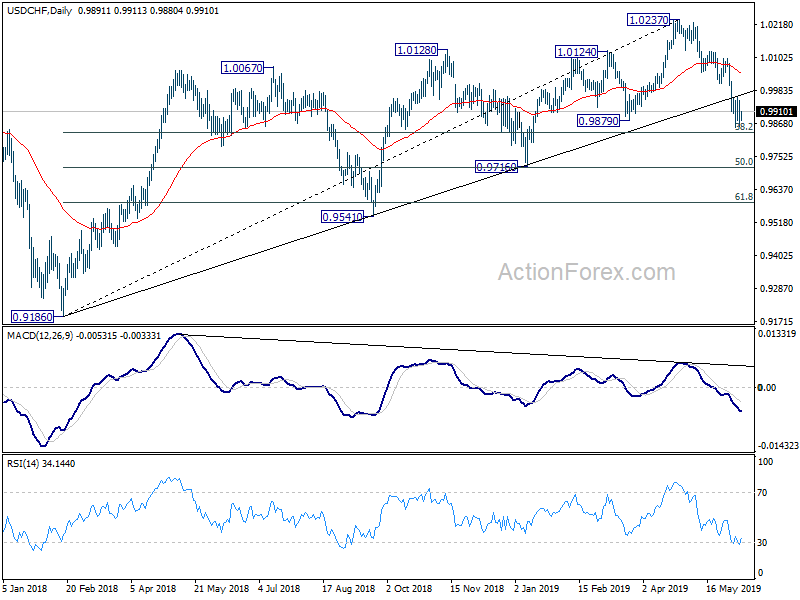
In the bigger picture, USD/CHF's break of long term trend line support is the first indication of medium term reversal. Focus is now back on 0.9879 support. Sustained break should confirm that medium term up trend from 0.9186 has completed at 1.0237 already. Further fall should be seen to 0.9716 cluster support (50% retracement of 0.9186 to 1.0237 at 0.9712) next. Break will target 61.8% retracement at 0.9587.
USD/JPY Daily Outlook
Daily Pivots: (S1) 107.83; (P) 108.22; (R1) 108.59; More...
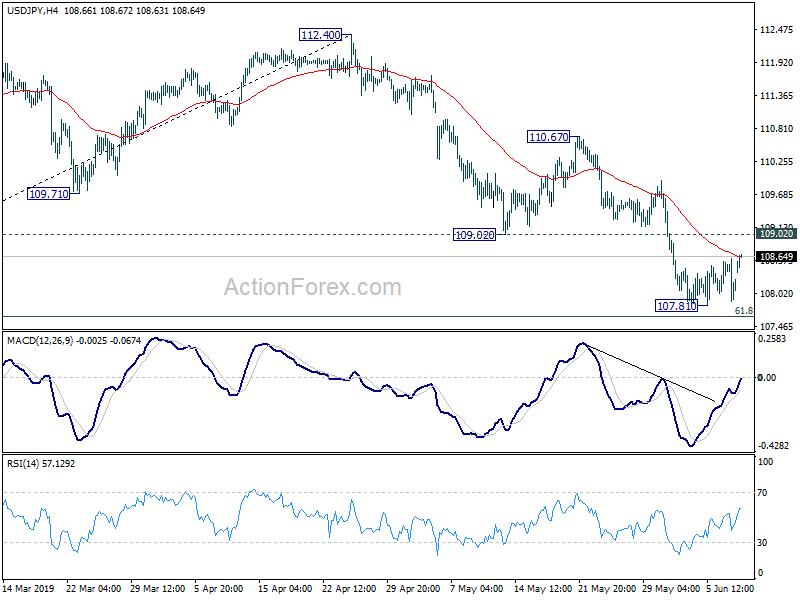
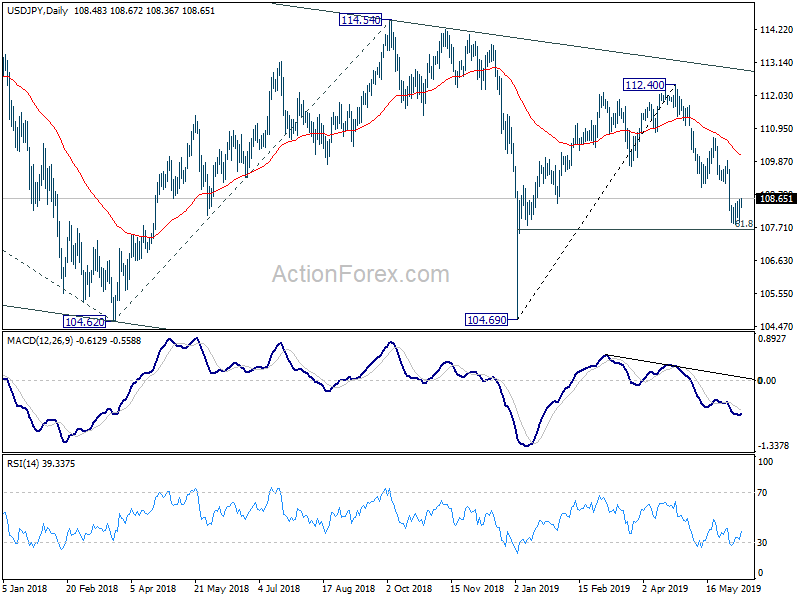
Intraday bias in USD/JPY remains neutral for consolidation above 107.81 temporary low. Upside of recovery should be limited by 109.02 support turned resistance to bring fall resumption. On the downside, sustained break of 61.8% retracement of 104.69 to 112.40 at 107.63 will pave the way back to 104.62/9 key support zone. Though, break of 109.02 support turned resistance will indicate short term bottoming and bring lengthier consolidations first.
In the bigger picture, decline from 118.65 (Dec 2016) is still in progress, with the pair staying indicate long term falling channel. Break of 104.62 will target 100% projection of 118.65 to 104.62 from 114.54 at 100.51. For now, we'd expect strong support above 98.97 (2016 low) to contain downside to bring rebound.
USD/CAD Daily Outlook
Daily Pivots: (S1) 1.3232; (P) 1.3301; (R1) 1.3341; More...
Intraday bias in USD/CAD remains on the downside at this point. As noted before, choppy rise from 1.3068 has completed at 1.3564 already. Fall from there should now target 1.3052/68 cluster support. On the upside, break of 1.3363 support turned resistance is needed to indicate short term bottoming. Otherwise, outlook will remain bearish in case of recovery.
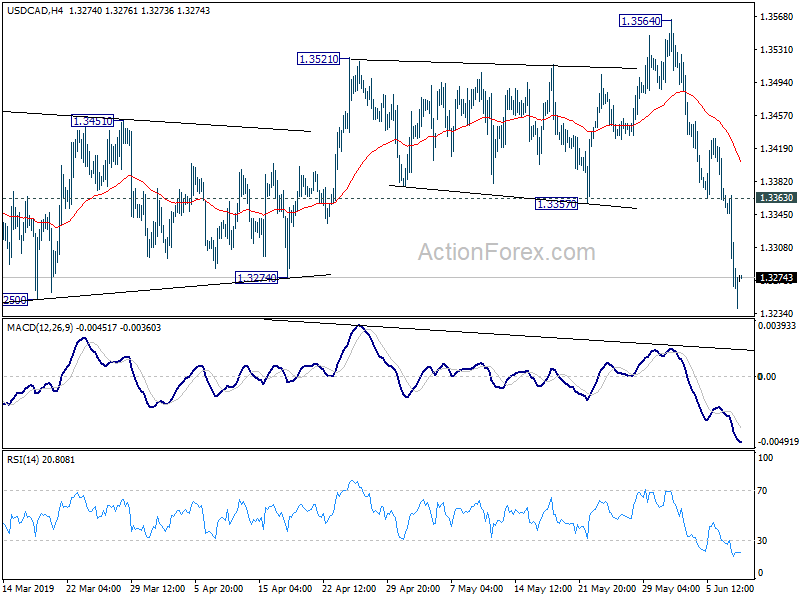
In the bigger picture, the strong break of medium term channel support now argues that up trend from 1.2061 (2017 low) has completed at 1.3664 (2018 high), just ahead of 61.8% retracement of 1.4689 (2016 high) to 1.2061 at 1.3685, and 1.3793 resistance. Decisive break of 1.3068 cluster support (38.2% retracement of 1.2061 to 1.3664 at 1.3052) will confirm and pave the way to 61.8% retracement at 1.2673 next. For now, risk will remain on the downside as long as 1.3564 resistance holds, even in case of strong rebound.
AUD/USD Daily Outlook
Daily Pivots: (S1) 0.6970; (P) 0.6996; (R1) 0.7029; More...
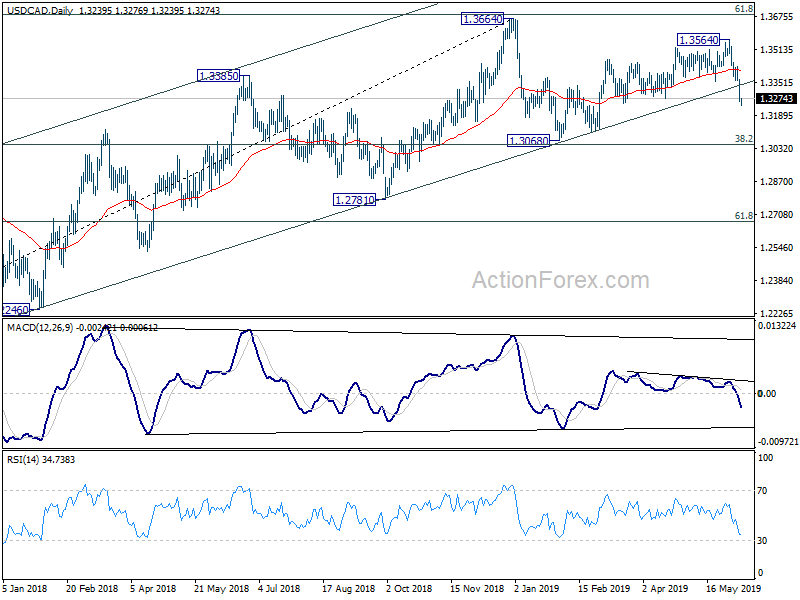
Intraday bias in AUD/USD is turned neutral first with today's retreat. Further rise is in favor as long as 0.6962 minor support holds. Break of 0.7022 will extend the rebound from 0.6864 short term bottom. Break of 0.7069 resistance will target 0.7205 structural resistance next. On the downside, though, break of 0.6962 will indicate completion of the rebound and turn bias back to the downside for retesting 0.6864 low.
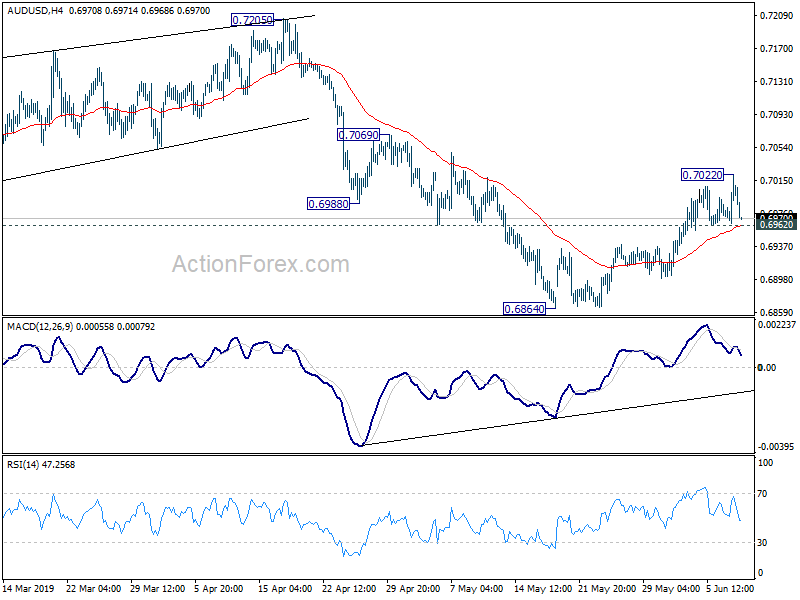
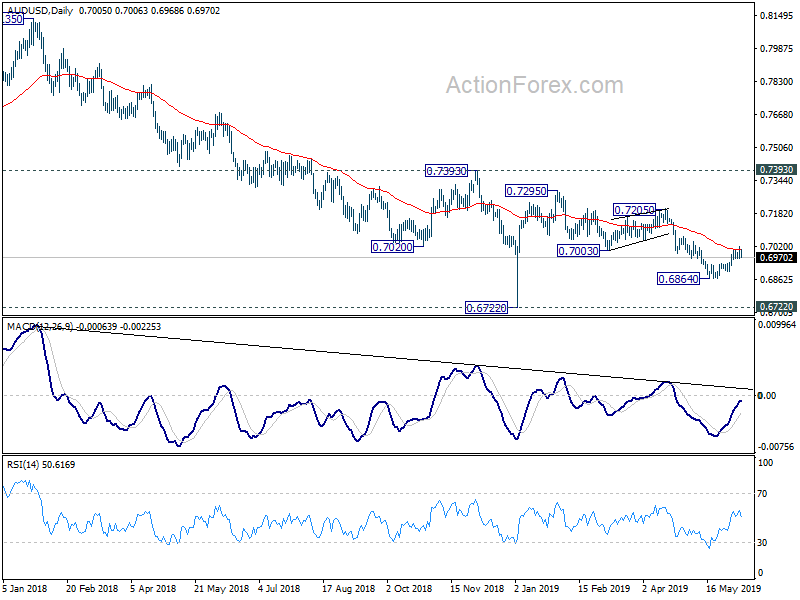
In the bigger picture, with 0.7393 key resistance intact, medium term outlook remains bearish. The decline from 0.8135 (2018 high) is seen as resuming long term down trend from 1.1079 (2011 high). Decisive break of 0.6826 (2016 low) will confirm this bearish view and resume the down trend to 0.6008 (2008 low). However, firm break of 0.7393 will argue that fall from 0.8135 has completed. And corrective pattern from 0.6826 has started the third leg, targeting 0.8135 again.
Dollar Recovers on US-Mexico Deal, Aussie Weighed Down by China Imports
Dollar recovers broadly today while stocks markets rebound. Threat of US-Mexico trade war vanished after Trump announced to suspend indefinitely the plan to impose tariffs on all Mexican imports. An agreement was made between the US and Mexico on migration issue. At this point, there is no confirmation of bottoming in the greenback yet. But with a key uncertainty removed, it's more likely for Fed to hold on to its patient stance longer to see how things play out. Thus there is prospect of a stronger rebound in the greenback.
Staying in the currency markets, Canadian Dollar is the second strongest as the week starts., followed by Sterling. New Zealand and Australian Dollars are the weakest ones. Surprised sharp contraction in Chinese imports in May is a key factor weighing down on both currencies. Yen is the third weakest following improvement in risk sentiments.
Technically, 0.6962 minor support in AUD/USD is a level to watch. Break will suggest earlier than expected completion of the rebound form 0.6864. Similarly, 1.1251 in EUR/USD and 1.2668 in GBP/USD will carry similar implications. 0.8902 temporary top in EUR/GBP is also in focus and break will indicate resumption of recent rally towards 0.9101 key resistance.
In Asia, Nikkei is currently up 1.24%. Hong Kong HSI is up 2.03%. China Shanghai SSE is up 0.98%. Singapore Strait Times is up 0.80%. Japan 10-year JGB yield down -0.0082 at -0.123.
G20 finance ministers warned trade and geopolitical tensions have intensified
G20 Finance Ministers the Central bank Governors said in the post-meeting communique that global growth "appears to be stabilizing" and is "generally projected to pick up moderately later this year and into 2020. However, risks to global growth remain "tilted to the downside".
And they warned, "most importantly, trade and geopolitical tensions have intensified." The group pledged to "continue to address these risks, and stand ready to take further action." However, the originally proposed language of "recognize the pressing need to resolve trade tensions" was dropped.
Nevertheless, the group still "reemphasize that international trade and investment are important engines of growth, productivity, innovation, job creation and development". And they will "continue to take joint action to strengthen international cooperation and frameworks."
US Mnuchin: Trump perfectly happy to move forward with tariffs on China if they don't want a deal
On the sidelines of the G20 finance minister meeting in Fukuoka, Japan, US Treasury Secretary Steven Mnuchin US-China trade negotiation is at a crossroad like that ahead of the December G20 meeting in Buenos Aires. He said Trump needs to "see action" to make sure Chinese President Xi is heading "in the right direction" regarding the trade deal. Mnuchin added that Trump will make a decision after the Trump-Xi meeting in Osaka on June 28-29 G20 leader summit.
He also emphasized that "if China wants to move forward with the deal, we're prepared to move forward on the terms we've done. If China doesn't want to move forward, then President Trump is perfectly happy to move forward with tariffs to rebalance the relationship". And, if no agreement is made "the end result will be that my expectation is that many companies will move their production out of China to other locations".
On Huawei's banning, he said "what the president is saying is, if we move forward on trade, that perhaps he'll be willing to do certain things on Huawei if he gets comfort from China on that and certain guarantees". However, he emphasized "these are national security issues".
Also, Mnuchin said he "had constructive meeting with PBOC Governor Yi Gang, during which we had a candid discussion on trade issues."
China's trade surplus widened on sharp contraction in imports
China's import unexpectedly contracted by -8.5% yoy in May. That's the large contraction since July 2016, indicating underlying weakness in the economy. Exports did unexpectedly rose 1.1% yoy. But that was likely because of front-loading ahead of new US tariffs. Trade surplus, thus, widened to USD 41.7B. Meanwhile, trade with US continued to deteriorate. From January to May, imports dropped US dropped -29.6% yoy while, exports dropped -8.4% yoy, leaving a surplus at USD 110.5B.
In May, in USD term: Exports rose 1.1% yoy to USD 213.9B. Imports dropped -8.5% yoy to USD 172.2B. Total trade dropped -3.4% yoy to USD 386.0B. Trade surplus came in at USD 41.7B, above expectation of USD 23.2B.
From January to May: Exports rose 0.4% yoy to USD 985.3B. Imports dropped -3.7% yoy to USD 827.9B. Total trade dropped -1.6% yoy to USD 1786.2B. Trade surplus was at USD 130.5B.
With EU, YTD: Exports rose 8.0% yoy to USD 167.2B. Imports rose 2.4% yoy to USD 112.9B Total trade rose 5.7% yoy to USD 280.1B. Trade surplus was at USD 54.3B.
With US, YTD: Exports dropped -8.4% yoy to USD 160.1B. Imports dropped -29.6% yoy to USD 49.6B. Total trade dropped -14.5% yoy to USD 209.7B. Trade surplus was at USD 110.5B.
With AU, YTD: Exports rose 3.1% yoy to USD 18.3B. Imports rose 7.7% yoy to USD 46.7B. Total trade rose 6.4% yoy to USD 64.9B. Trade deficit was at USD -28.4B.
Data from US, China and Australia to watch, with SNB
SNB is the only featured central bank event this week. Given current economic uncertainty and market volatility, there is no chance for SNB to chance it's sentiment. Negative interest rates remain essential, as well as the readiness to intervene in the currency markets to prevent sudden sharp appreciation in the Franc.
Economic data from US, China and Australia will be the most important ones to watch. While risks of tariffs on Mexico are averted for now, US economy will needed to display some resilience in retail sales and inflation to ease Fed official's worries. Chinese data will give more evidence on the impact of latest escalation in trade war. Australian employment data will be the key on whether RBA would need to pull ahead another rate cut to July.
Here are some highlights for the week:
- Monday, Japan Q1 GDP final, current account; China trade balance; UK GDP, industrial and manufacturing production, trade balance; Canada housing starts, building permits.
- Tuesday: New Zealand manufacturing sales; Australia NAB business confidence; Japan machine tools orders, M2; UK employment; US PPI.
- Wednesday: Japan machine orders, domestic CGPI; China CPI, PPI; Australia Westpac consumer sentiment; US CPI.
- Thursday: Australia employment; Japan BSI manufacturing index, tertiary industry index; German CPI final; SNB rate decision; Eurozone industrial production; Canada new housing price index; US import prices, jobless claims.
- Friday: New Zealand Business NZ manufacturing index; China fixed asset investment, industrial production, retail sales, unemployment rate; US retail sales, industrial production, business inventories, U of Michigan consumer sentiment.
AUD/USD Daily Outlook
Daily Pivots: (S1) 0.6970; (P) 0.6996; (R1) 0.7029; More...
Intraday bias in AUD/USD is turned neutral first with today's retreat. Further rise is in favor as long as 0.6962 minor support holds. Break of 0.7022 will extend the rebound from 0.6864 short term bottom. Break of 0.7069 resistance will target 0.7205 structural resistance next. On the downside, though, break of 0.6962 will indicate completion of the rebound and turn bias back to the downside for retesting 0.6864 low.
In the bigger picture, with 0.7393 key resistance intact, medium term outlook remains bearish. The decline from 0.8135 (2018 high) is seen as resuming long term down trend from 1.1079 (2011 high). Decisive break of 0.6826 (2016 low) will confirm this bearish view and resume the down trend to 0.6008 (2008 low). However, firm break of 0.7393 will argue that fall from 0.8135 has completed. And corrective pattern from 0.6826 has started the third leg, targeting 0.8135 again.
Economic Indicators Update
| GMT | Ccy | Events | Actual | Forecast | Previous | Revised |
|---|---|---|---|---|---|---|
| 23:50 | JPY | Current Account Total (JPY) Apr P | 1.60T | 1.44T | 1.27T | |
| 23:50 | JPY | GDP Q/Q Q1 F | 0.60% | 0.60% | 0.50% | |
| 23:50 | JPY | GDP Deflator Y/Y Q1 F | 0.10% | 0.20% | 0.20% | |
| 23:50 | JPY | Bank Lending incl Trusts Y/Y May | 2.60% | 2.40% | 2.40% | |
| 23:50 | JPY | Bank Lending Ex-Trusts Y/Y May | 2.80% | 2.50% | ||
| 2:00 | CNY | Trade Balance (USD) May | 41.7B | 23.2B | 13.8B | |
| 2:00 | CNY | Imports (USD) Y/Y May | -8.50% | -3.30% | 4.00% | |
| 2:00 | CNY | Exports (USD) Y/Y May | 1.10% | -3.80% | -2.70% | |
| 2:00 | CNY | Trade Balance (CNY) May | 279B | 136B | 94B | |
| 2:00 | CNY | Imports Y/Y (CNY) May | -2.50% | 5.80% | 10.30% | |
| 2:00 | CNY | Exports Y/Y (CNY) May | 7.70% | 4.70% | 3.10% | |
| 5:00 | JPY | Eco Watchers Survey Current May | 44.1 | 45.5 | 45.3 | |
| 8:30 | GBP | GDP M/M Apr | -0.10% | -0.10% | ||
| 8:30 | GBP | Index of Services 3M/3M Apr | 0.20% | 0.30% | ||
| 8:30 | GBP | Industrial Production M/M Apr | -1.00% | 0.70% | ||
| 8:30 | GBP | Industrial Production Y/Y Apr | 0.90% | 1.30% | ||
| 8:30 | GBP | Manufacturing Production M/M Apr | -1.40% | 0.90% | ||
| 8:30 | GBP | Manufacturing Production Y/Y Apr | 2.00% | 2.60% | ||
| 8:30 | GBP | Construction Output M/M Apr | 0.50% | -1.90% | ||
| 8:30 | GBP | Visible Trade Balance (GBP) Apr | -13.1B | -13.7B | ||
| 12:15 | CAD | Housing Starts May | 220K | 235K | ||
| 12:30 | CAD | Building Permits M/M Apr | 1.80% | 2.10% | ||
| 22:45 | NZD | Manufacturing Activity Q1 | -0.50% | |||
| 23:50 | JPY | Japan Money Stock M2+CD Y/Y May | 2.60% | 2.60% |
GBP/USD And USD/CAD: US Dollar Showing Signs Of Weakness
GBP/USD gained pace this past week and recovered above the 1.2700 resistance. USD/CAD declined steadily below 1.3300, signaling short term US Dollar weakness.
Important Takeaways for GBP/USD and USD/CAD
- The British Pound started a decent recovery and recovered above 1.2700 and 1.2720.
- There is a major bullish trend line forming with support near 1.2710 on the hourly chart of GBP/USD.
- USD/CAD started a crucial decline and broke the key 1.3300 support area.
- The pair is currently trading well below 1.3300 and a bearish trend line with resistance near 1.3330 on the hourly chart.
GBP/USD Technical Analysis
The British Pound found support near 1.2550 and 1.2560 against the US Dollar, and started a fresh recovery this past week. The GBP/USD pair traded above the 1.2600 and 1.2650 resistance levels to move into a positive zone.
The pair even broke the 1.2700 resistance and the 50 hourly simple moving average. The bulls gained momentum above 1.2720 and a new swing high was formed near 1.2762 on FXOpen.
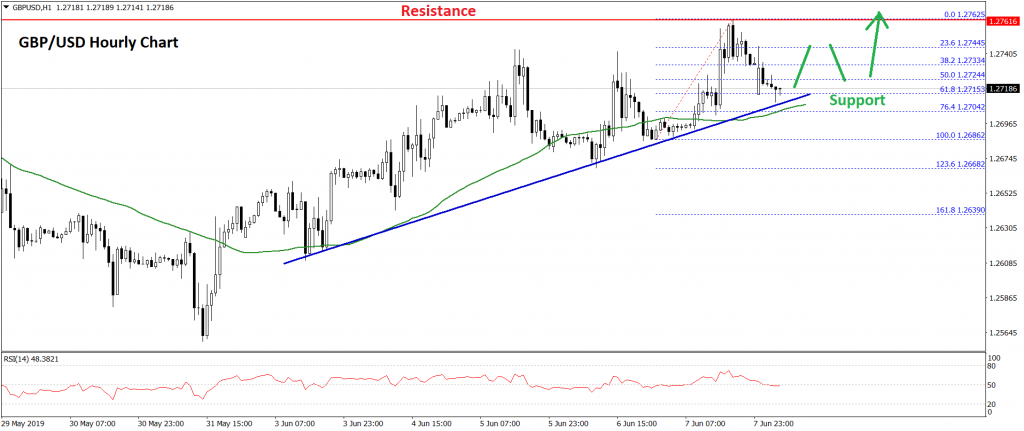
At the moment, the pair is correcting lower and it recently broke the 1.2750 level and the 50% Fib retracement level of the last wave from the 1.2686 low to 1.2762 high.
On the downside, there are many supports near the 1.2720 and 1.2700 levels. There is also a major bullish trend line forming with support near 1.2710 on the hourly chart of GBP/USD.
Moreover, the 61.8% Fib retracement level of the last wave from the 1.2686 low to 1.2762 high is likely to act as a strong support near 1.2720.
Therefore, if there is a downside correction, the pair could find support near the 1.2720 and 1.2700 levels. Only a close below 1.2700 and the 50 hourly SMA could push the pair back in a negative zone in the near term.
On the upside, an initial resistance is at 1.2750, above which the bulls could target 1.2780 or even 1.2800.
USD/CAD Technical Analysis
The US Dollar started a crucial downside move from well above the 1.3500 level against the Canadian Dollar. The USD/CAD pair gained bearish momentum below 1.3450 and 1.3400 support levels.
The recent decline was such that there was a close below the 1.3360 support area and the 50 hourly simple moving average. It even broke the 1.3300 level and traded as low as 1.3236.
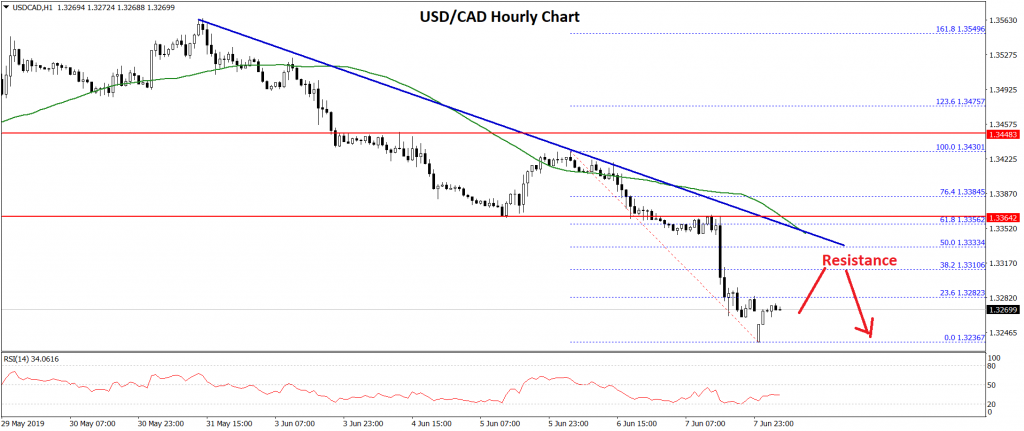
The current price action is super bearish, with an initial resistance at 1.3300 and 23.6% Fib retracement level of the last decline from the 1.3430 high to 1.3262 low.
On the upside, there is a bearish trend line in place with resistance near 1.3330 on the hourly chart. The trend line coincides with the 50% Fib retracement level of the last decline from the 1.3430 high to 1.3262 low.
The main resistance is near 1.3360 and the 50 hourly simple moving average. Therefore, as long as the pair is below the trend line, the 1.3360 level, and the 50 hourly SMA, there could be more downsides in the near term.
On the downside, an initial support is near the 1.3250 level, below which the USD/CAD pair is likely to accelerate towards the 1.3200 support level in the coming sessions.
China’s trade surplus widened on sharp contraction in imports
China's import unexpectedly contracted by -8.5% yoy in May. That's the large contraction since July 2016, indicating underlying weakness in the economy. Exports did unexpectedly rose 1.1% yoy. But that was likely because of front-loading ahead of new US tariffs. Trade surplus, thus, widened to USD 41.7B. Meanwhile, trade with US continued to deteriorate. From January to May, imports dropped US dropped -29.6% yoy while, exports dropped -8.4% yoy, leaving a surplus at USD 110.5B.
In May, in USD term:
- Exports rose 1.1% yoy to USD 213.9B.
- Imports dropped -8.5% yoy to USD 172.2B.
- Total trade dropped -3.4% yoy to USD 386.0B.
- Trade surplus came in at USD 41.7B, above expectation of USD 23.2B.
From January to May:
- Exports rose 0.4% yoy to USD 985.3B.
- Imports dropped -3.7% yoy to USD 827.9B.
- Total trade dropped -1.6% yoy to USD 1786.2B.
- Trade surplus was at USD 130.5B.
With EU, YTD:
- Exports rose 8.0% yoy to USD 167.2B.
- Imports rose 2.4% yoy to USD 112.9B
- Total trade rose 5.7% yoy to USD 280.1B.
- Trade surplus was at USD 54.3B.
With US, YTD:
- Exports dropped -8.4% yoy to USD 160.1B.
- Imports dropped -29.6% yoy to USD 49.6B.
- Total trade dropped -14.5% yoy to USD 209.7B.
- Trade surplus was at USD 110.5B.
With AU, YTD:
- Exports rose 3.1% yoy to USD 18.3B.
- Imports rose 7.7% yoy to USD 46.7B.
- Total trade rose 6.4% yoy to USD 64.9B.
- Trade deficit was at USD -28.4B.
Aussie Dips As China Imports Contract
Biggest contraction since 2016
China's imports in May declined 8.5% from a year earlier, the biggest shrinkage since July 2016, in further evidence that the US-China tariff conflict is taking a heavier toll on the economy. Exports for the month came in better than expected, rising 1.1% y/y versus expectations of a 3.8% fall. As a result of the lower imports, the trade surplus for the month rose to $41.65 billion from $13.83 billion in April.
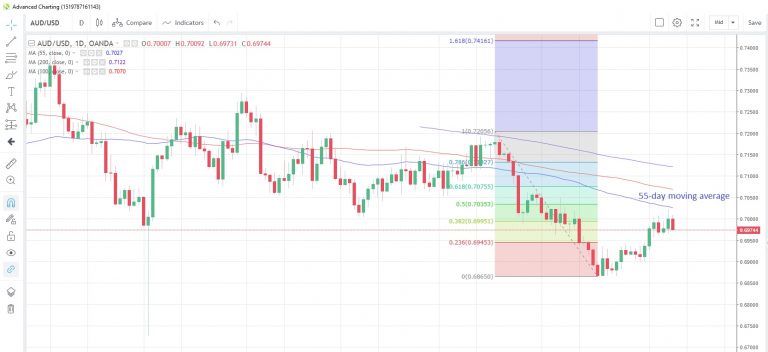
The weak imports numbers had an adverse impact on the Australian dollar, which fell 0.44% from intra-day highs above 0.7000 to 0.6979 versus the US dollar. The FX pair has once more failed to break above the 55-day moving average at 0.7027, which has capped prices since April 23. The Aussie also gave back early gains to 76.04 versus the Japanese yen to steady at 75.74, almost unchanged on the day.
AUD/USD Daily Chart
Trump suspends Mexico tariffs
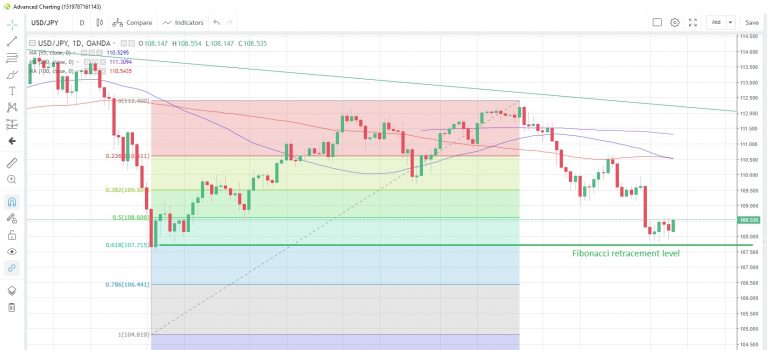
The trading day had started quite positively after US President Trump announced late Friday that he would suspend the progressive tariffs on Mexican imports scheduled to be imposed today, as Mexico had promised to take a tougher stance on immigration. Stock indices were all trading in positive territory (including China and Hong Kong stocks, which were playing catch-up after a holiday on Friday) while the yen was weakening as safe haven positions were unwound. USD/JPY rose for the first time in three days, maintaining its hold above the 61.8% Fibonacci retracement level of the January-April rally at 107.715.
USD/JPY Daily Chart
UK numbers fill the data slate
A slew of UK manufacturing and trade data populate the data calendar today, kicking off with the manufacturing and industrial production numbers for April. Industrial production is seen rising 0.1% m/m following a 0.7% gain in March, while manufacturing production is expected to slow to +0.2% from +0.9% the previous month. The goods trade balance for that month is seen widening slightly to GBP13.8 billion from GBP13.65 billion. Note that the first round of the UK Conservative Party process to choose a new leader begin today. The Euro-zone Sentix investor confidence index is forecast to tumble to 1.4 in June from 5.3 in May.
The North American calendar features Canada's building permits for April and housing starts for May,along with the JOLTS job openings for April. A speech from Bank of England's Saunders completes the day.
Market Morning Briefing: Euro-Yen Has Immediate Resistance Near 123.0-123.50
STOCKS
Weak US jobs data release on Friday is strengthening the case for the Fed to cut rates - a positive for the equities. Also, the US deciding to suspend the planned tariffs on Mexico could give additional breather to the equities. As such, an extension of last week's rally is more likely to be seen this week in Dow. Nikkei has key resistance at current levels which has to be breached to extend the upmove. Sensex and Nifty could remain in a broad sideways range. DAX and Shanghai are closed today on account of a public holiday.
Dow (25983.94, +263.28, +1.02%) has turned bullish and has negated our bearish view for a fall to 24500-24000. It can breach the near-term resistance level of 26250 and rally to 26500-26600 in the coming days. Support is at 25750.
Nikkei (21119.72, +235.01, +1.13%) is trading in the 21100-21200 resistance region which may cap the upside and pull it lower 20750-20500 again thereby keeping the downtrend intact. A break above 21200 will prove our bearish view wrong and can test 21500-21750.
Nifty (11870.65, +26.90, +0.23%) can remain range bound between 11800 and 12100. A break above 11900 can take it to the upper end of this range (12100) in the near term. The bias is bullish to see a break and rise above 12100 to 12350 after which a sharp correction is possible.
Sensex (39615.90, +86.18, +0.22%) might be range bound between 39300 and 40300 before targeting 40500 and 40700 in the short term. However, We would remain cautious to see a sharp correction from the 40700-41000 region.
COMMODITIES
Gold and silver has come-off after Trump's decision to withdraw the plans of levying tariff on Mexico. Gold and Silver may come-down further this week. Copper may consolidate before resuming its downtrend. Oil is coming closer to a key resistance which halt the current bounce-back and trigger a fall again.
Gold (1330) is struggling to breach 1345 and has come-off sharply. While below 1340, a fall to 1320 and 1310 is possible. As being reiterated here 1345 and 1360 are crucial resistance that can cap the upside. A strong rise past 1360 (less preferred) is needed for gold to gain bullish momentum.
Silver (14.80) has failed to breach the psychological level of 15 which keeps the broader downtrend intact. It looks vulnerable to test 14.6 in the near term.
Copper (2.63) remains bearish. However, as mentioned earlier, it may consolidate between 2.61 and 2.68 for some time before resuming its downtrend towards 2.58 and 2.55.
Brent (63.48) has risen as expected to test the resistance at 64. A turn-around is likely from the 64-65 resistance region which can target 62 and 61 again. We keep our broader bearish view intact for a test of 55.
WTI (54.24) can reverse lower from the 55-56 resistance region and test 52-51 again and then eventually fall to 45 in line with our broader bearish view.
FOREX
Euro and Aussie are closed today. It would be important to see if Dollar Index manages to bounce from important support below current level. Euro-Yen is bullish in the longer run. Yuan has weakened to 6.9330 posing concerns of Rupee weakness in the near term.
The US backed off from a trade conflict with Mexico on Friday after signing a deal. This is positive news for the markets. Dollar Index (96.76) fell sharply after the lower than expected NFP data on Friday that triggered a sell off. Immediate support is seen near 96.50 on the 3-day candles, which if holds could manage to push the Dollar Index higher towards 97.10 and higher in the near term.
Euro (1.1314) is trading higher just now with bullish momentum looking strong just now. Although the currency looks bullish towards 1.14, considering the support on Dollar Index at 96.50, we could either see a fall in Euro from current levels or a rise in Euro towards 1.14 could pull down Dollar Index towards 95.70 in the near term. We would like to wait and watch for today's movement.
Euro-Yen (122.74) has immediate resistance near 123.0-123.50 which if holds could keep the pair sideways in the 123.50-120.00 region for some more sessions. Overall on the weekly chart, Euro Yen looks bullish towards 124-126 in the longer run.
Dollar-Yen (108.49) could be expected to trade within 107-109 unless a sharp break above 109 is seen in the near term. A bounce in dollar Index from 96.50 could possibly pull up Dollar Yen too in the near to medium term.
Aussie (0.6979) is closed today.
Pound (1.2725) could face some rejection near 1.28-1.2850 which could see a short corrective dip. But overall, medium term view is bullish.
USDCNY (6.9330) has risen contrary to our expectation of a fall from 6.92. While the pair trades higher, it could test 6.95/96 on the upside soon. View is bullish for the near term.
USDINR (69.4750) has immediate resistance near 69.55/60 which is likely to hold just now. But the rise in Chinese Yuan above 6.92 would be a concern and if it rises further towards 6.95/96, Dollar Rupee could be pulled up towards 69.70/80 in the near term. We would be cautious for a break above 69.60.
INTEREST RATES
The US Libor curve has inverted with the 1mnth trading at 2.412%, 3mnth at 2.45%, 6mnth at 2.37% and 1Yr at 2.346%.
The US 10r (2.114%) is trading lower and could possibly bounce from 2.10% or lower at 2% in the medium term. The 30yr (2.595%) is attempting to rise and could test 2.60% in the next 1-2 sessions. A short corrective rise is possible in the US yields within the longer term down trend.
The Japan yields have risen from immediate trend supports and look bullish for the near term, indicating a rise in Dollar Yen in the near term.
EUR/USD Turned Short Term Bullish, Could Surpass 1.1350
Key Highlights
- The Euro started a steady rise above the 1.1250 resistance against the US Dollar.
- EUR/USD is currently placed above 1.1300 and it could surpass 1.1350.
- The US nonfarm payrolls in May 2019 came in at 75K, less than the 185K forecast.
- The Euro Zone Sentix Investor Confidence in June 2019 could decline from 5.3 to 1.4.
EURUSD Technical Analysis
This past week, the Euro started a strong rise from the 1.1200 swing low against the US Dollar. The EUR/USD pair broke the 1.1250 resistance area to move into a positive zone.
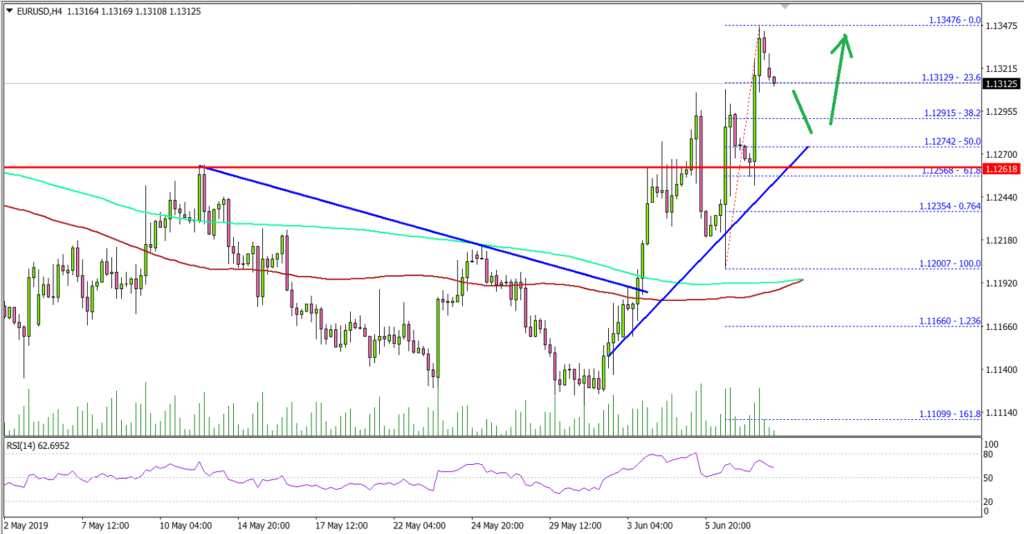
Looking at the 4-hours chart, the pair surpassed a major bearish trend line and even climbed above the 1.1280 plus 1.1300 barrier. It opened the doors for more gains and the pair is now trading well above the 100 simple moving average (red, 4-hours).
The upward move was such that the pair traded close to 1.1350. A swing high was formed at 1.1347 and it is currently correcting gains.
An initial support is at 1.1315 and the 23.6% Fib retracement level of the recent wave from the 1.1200 low to 1.1347 high.
If there is an extended downside correction, the pair could find support near the 1.1280 level. The 50% Fib retracement level of the recent wave from the 1.1200 low to 1.1347 high is also near the 1.1274 level to provide support.
On the upside, a break above the 1.1350 resistance could open the doors for more gains in the coming sessions.
Fundamentally, the US nonfarm payrolls report for May 2019 was released by the US Department of Labor. The market was looking for a decline from 263K to 185K.
However, the actual result was disappointing since the total nonfarm payroll employment edged up only 75K in May, and the unemployment rate remained at 3.6 percent. The last reading was revised down from 263K to 224K.
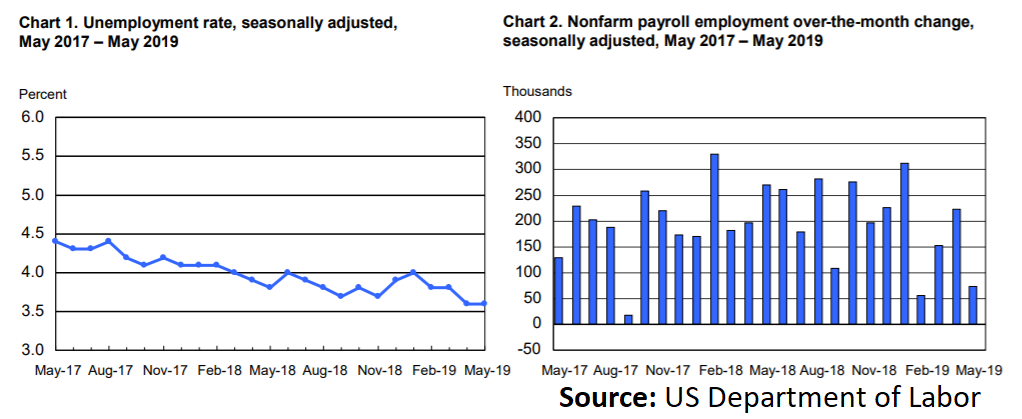
The report stated that:
The unemployment rate remained at 3.6 percent in May, and the number of unemployed persons was little changed at 5.9 million.
Overall, EUR/USD is likely to continue higher as long as it is trading above the 1.1280 and 1.1250 support levels.
Economic Releases to Watch Today
UK Industrial Production for April 2019 (MoM) – Forecast +0.1%, versus +0.7% previous.
UK Manufacturing Production for April 2019 (MoM) – Forecast +0.2%, versus +0.9% previous.
Euro Zone Sentix Investor Confidence for June 2019 – Forecast 1.4, versus 5.3 previous.