Sample Category Title
GBP/USD Daily Outlook
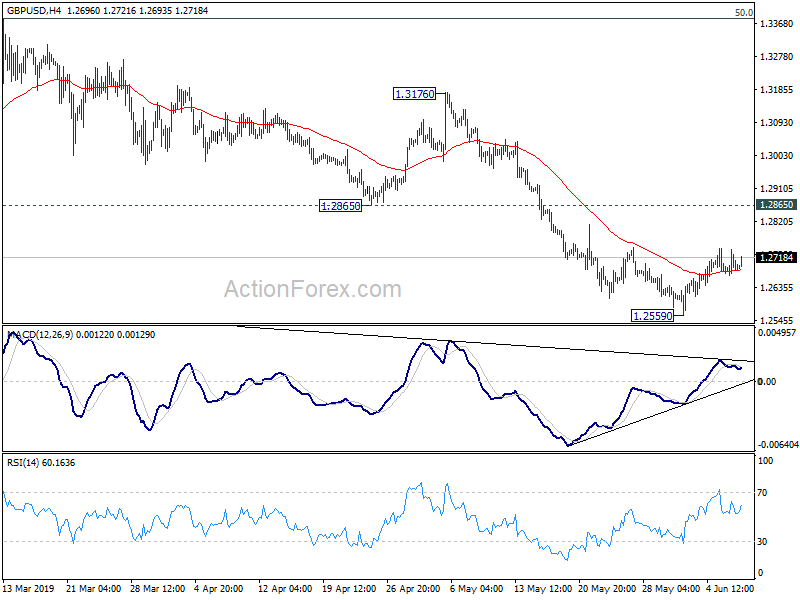
Daily Pivots: (S1) 1.2659; (P) 1.2701; (R1) 1.2734; More....
GBP/USD is staying in consolidation from 1.2559 short term bottom and intraday bias remains neutral. In case of stronger recovery, upside should be limited by 1.2865 support turned resistance to bring fall resumption. On the downside, break of 1.2559 will extend the decline from 1.3381 for 1.2391 low first. However, sustained break of 1.2865 will indicate completion of fall from 1.3381. In that case, corrective pattern from 1.2391 would be in another rising leg through 1.3381 resistance.
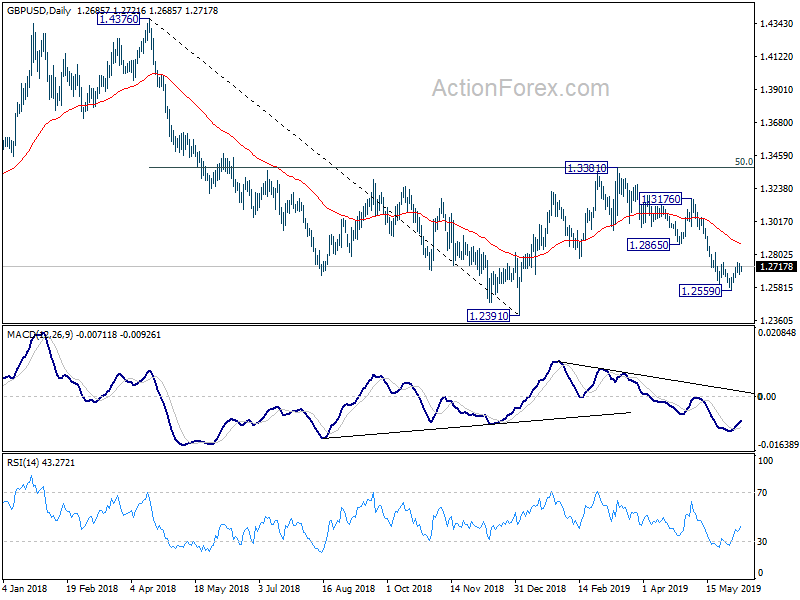
In the bigger picture, medium term decline from 1.4376 (2018 high) is possibly ready to resume. Decisive break of 1.2391 would target a test on 1.1946 long term bottom (2016 low). For now, we don't expect a firm break there yet. Hence focus will be on bottoming signal as it approaches 1.1946. In any case, medium term outlook will stay bearish as long as 1.3381 resistance holds, in case of strong rebound.
USD/CHF Daily Outlook
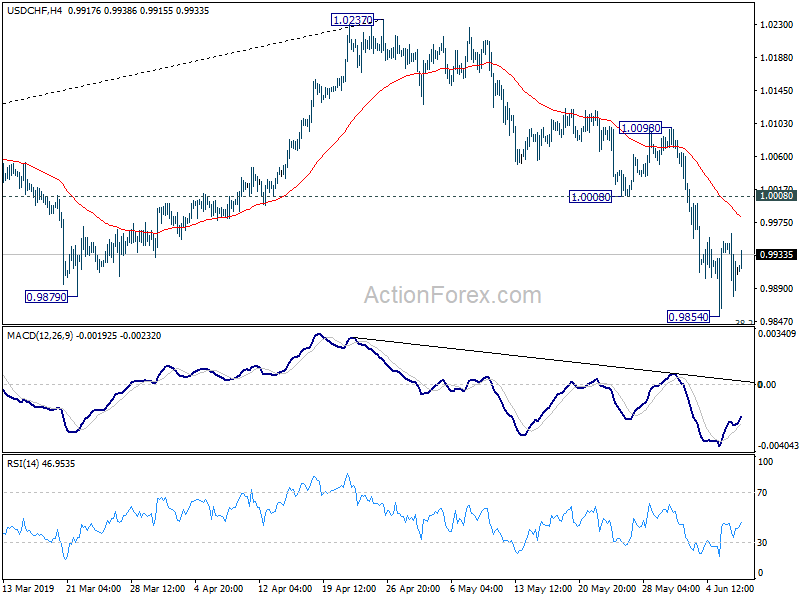
Daily Pivots: (S1) 0.9875; (P) 0.9918; (R1) 0.9957; More...
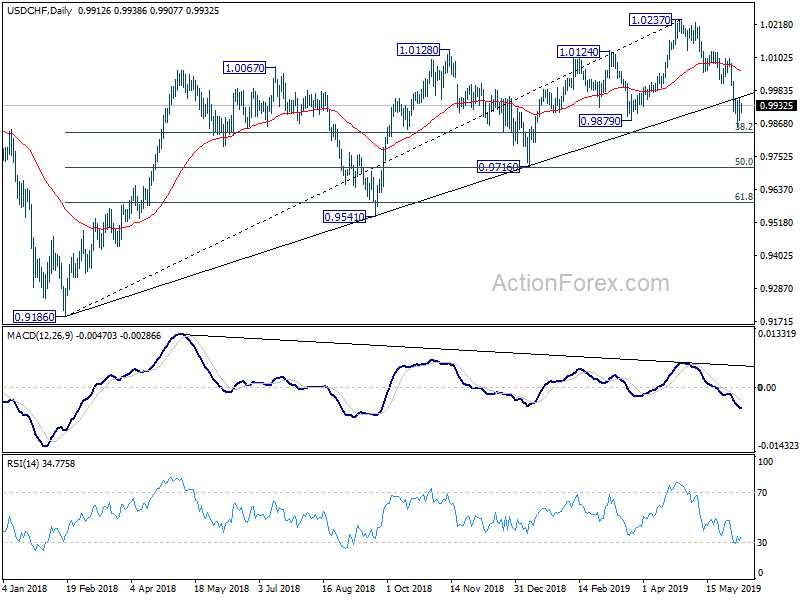
USD/CHF is staying in consolidation above 0.9854 temporary low. Intraday bias remains neutral first. In case of stronger recovery, upside should be limited by 1.0008 support turned resistance to bring fall resumption. On the downside, break of 0.9854 will extend the decline from 1.0237 to 0.9716 cluster support (50% retracement of 0.9186 to 1.0237 at 0.9712).
In the bigger picture, USD/CHF's break of long term trend line support is the first indication of medium term reversal. Focus is now back on 0.9879 support. Sustained break should confirm that medium term up trend from 0.9186 has completed at 1.0237 already. Further fall should be seen to 0.9716 cluster support (50% retracement of 0.9186 to 1.0237 at 0.9712) next. Break will target 61.8% retracement at 0.9587.
USD/JPY Daily Outlook
Daily Pivots: (S1) 108.09; (P) 108.33; (R1) 108.62; More...
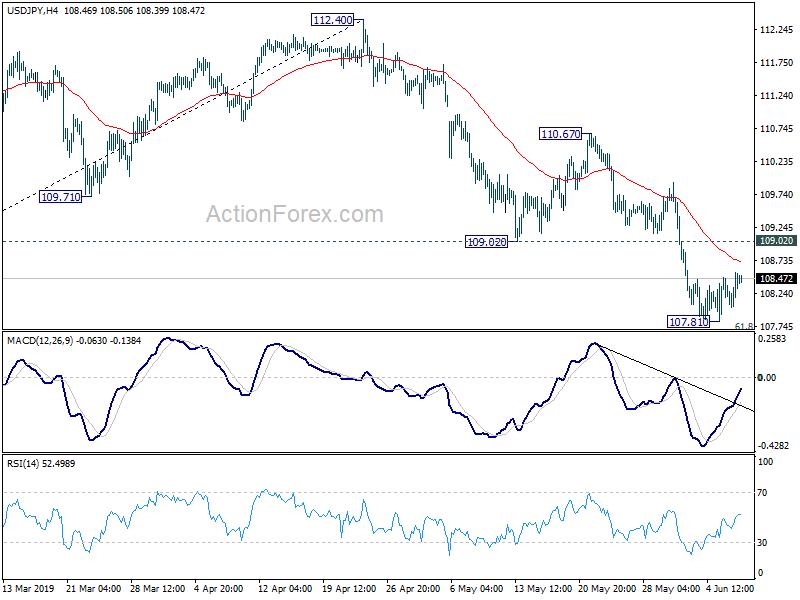
Intraday bias in USD/JPY is neutral for consolidation above 107.81 temporary low. But with 109.02 support turned resistance intact, current fall from 112.40 is expected to extend further. Sustained break of 61.8% retracement of 104.69 to 112.40 at 107.63 will pave the way back to 104.62/9 key support zone. Though, break of 109.02 support turned resistance will indicate short term bottoming and bring lengthier consolidations first.
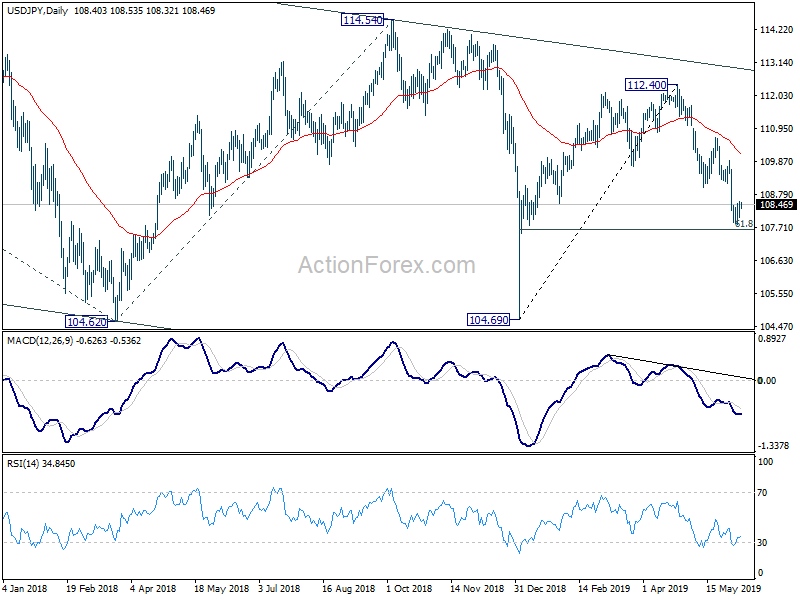
In the bigger picture, decline from 118.65 (Dec 2016) is still in progress, with the pair staying indicate long term falling channel. Break of 104.62 will target 100% projection of 118.65 to 104.62 from 114.54 at 100.51. For now, we'd expect strong support above 98.97 (2016 low) to contain downside to bring rebound.
AUD/USD Daily Outlook
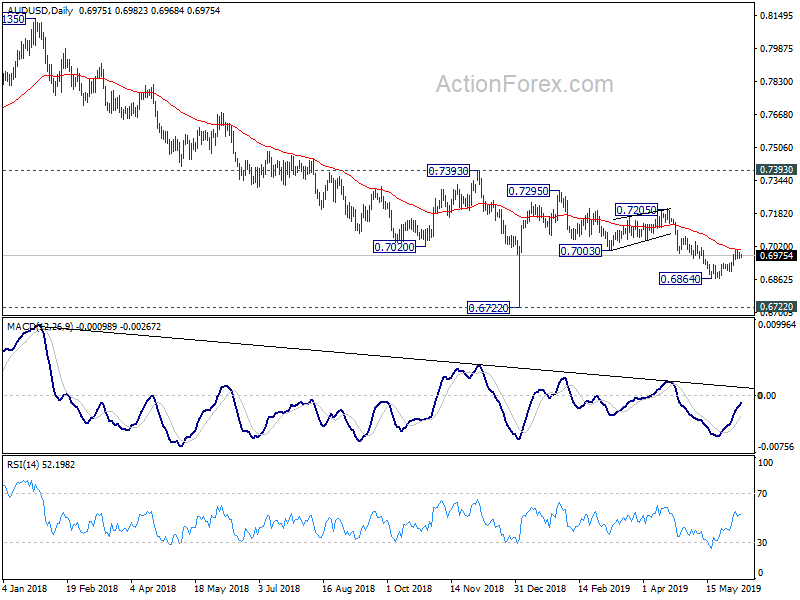
Daily Pivots: (S1) 0.6951; (P) 0.6980; (R1) 0.6997; More...
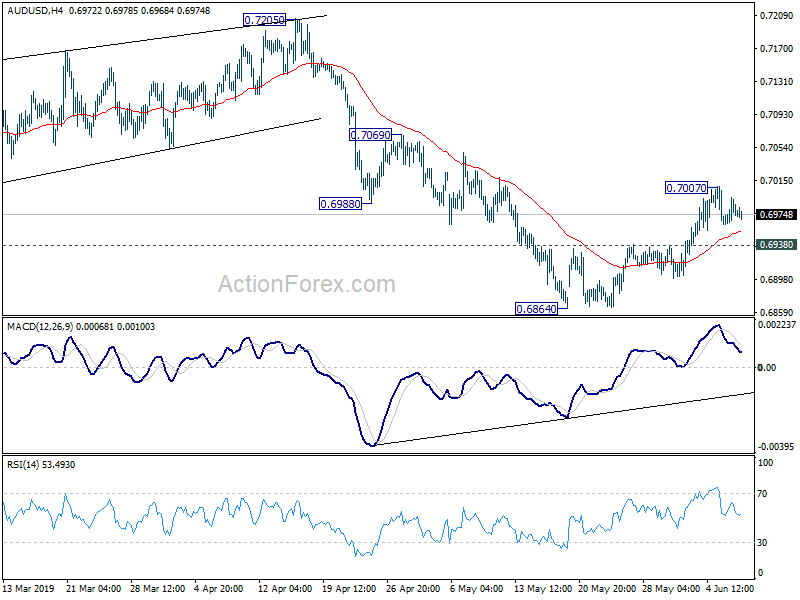
Intraday bias in AUD/USD remains neutral for the moment. With 0.6938 minor support intact, further rise is still expected. Above 0.7007 will resume the rise from 0.6864 and target 0.7205 key resistance next. However, break of 0.6938 minor support will turn bias back to the downside for 0.6864 low instead.
In the bigger picture, with 0.7393 key resistance intact, medium term outlook remains bearish. The decline from 0.8135 (2018 high) is seen as resuming long term down trend from 1.1079 (2011 high). Decisive break of 0.6826 (2016 low) will confirm this bearish view and resume the down trend to 0.6008 (2008 low). However, firm break of 0.7393 will argue that fall from 0.8135 has completed. And corrective pattern from 0.6826 has started the third leg, targeting 0.8135 again.
GBPJPY Rebounds On 5-Month Low, Indicators Signal Bullish Bias
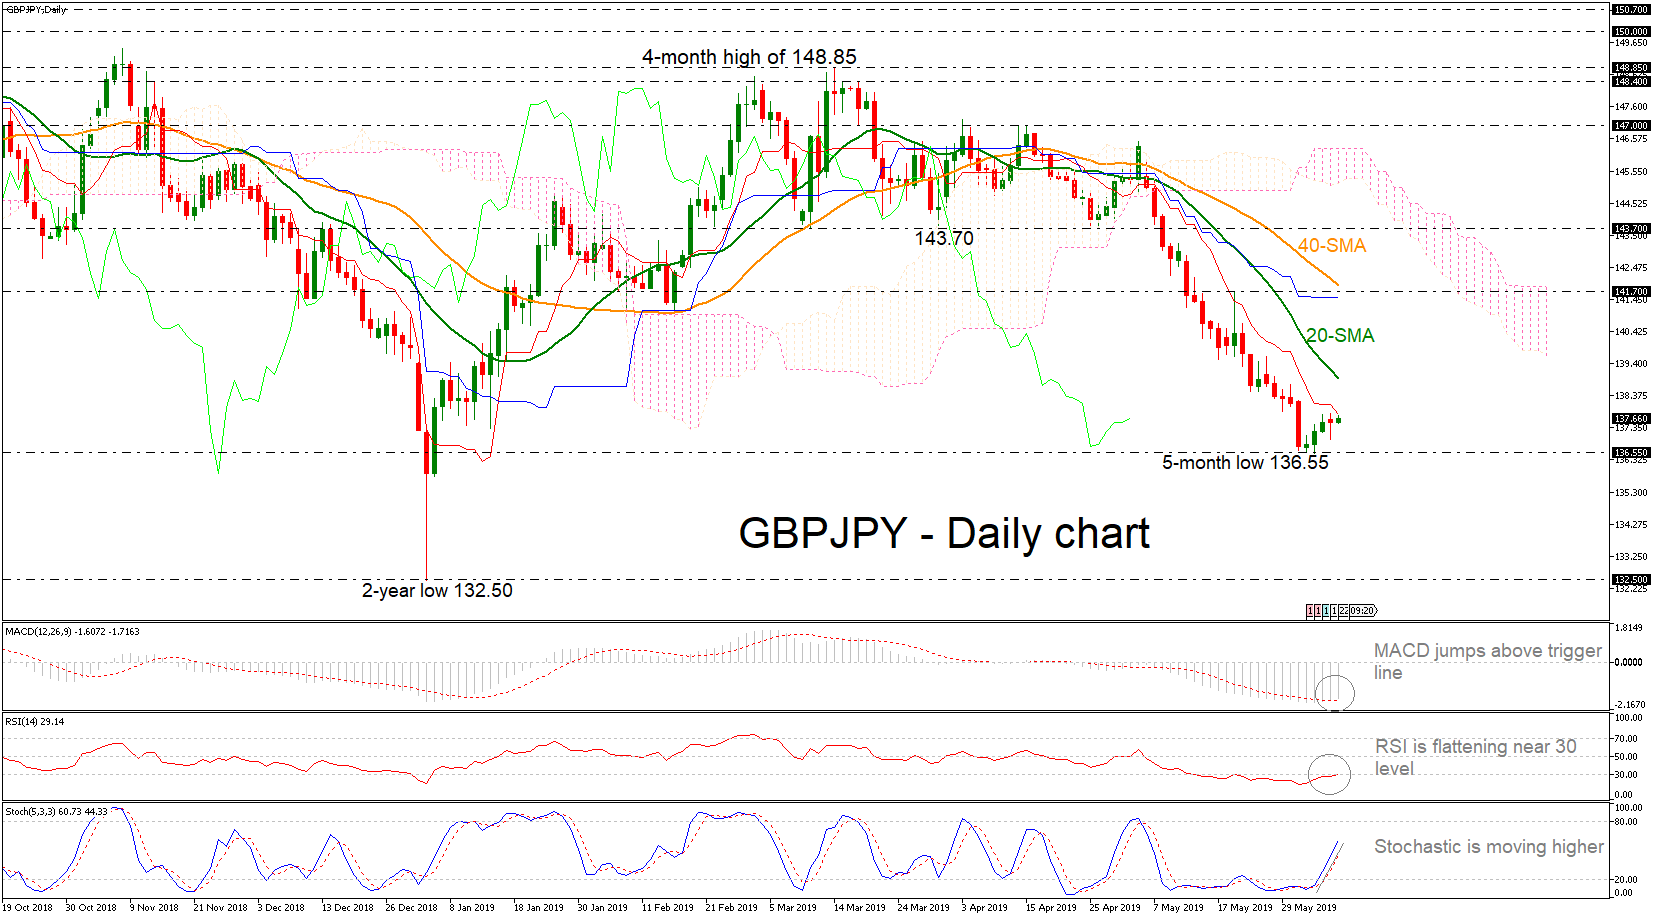
GBPJPY is trading not too far from the five-month low of 136.55, having pulled back slightly. The momentum indicators suggest there is still some upside for the pair to advance again, despite the downward movement on the red Tenkan-sen line.
The near-term bias is looking neutral-to-bullish as the RSI is flattening near the 30-oversold level, while the MACD oscillator is heading marginally up, above the trigger line. The stochastics are pointing north and the %K and %D lines remain positively aligned.
Should GBPJPY make another run higher, it’s likely to meet resistance at 138.90, where the 20-day simple moving average is currently located. A successful break above this line would open the way for the 141.70 resistance and the 40-day SMA, around 141.85. After that, the price might challenge the 143.70 inside swing bottom, reached on March 29.
If the soft positive momentum fails to hold and prices turn lower, below the 136.55 support, the two-year low of 132.50 is the nearest support that could halt steeper declines.
The neutral-to-bearish picture holds for the medium-term outlook as the pair has been remaining below the short-term moving averages following the sharp bearish movement from the 147.00 handle. Price action at the moment is below the Ichimoku cloud so the risks are to the downside.
Concluding, the price seems to be neutral-to-bullish in the short-term but neutral-to-bearish in the bigger profile.
Crude Oil Towards 53.75
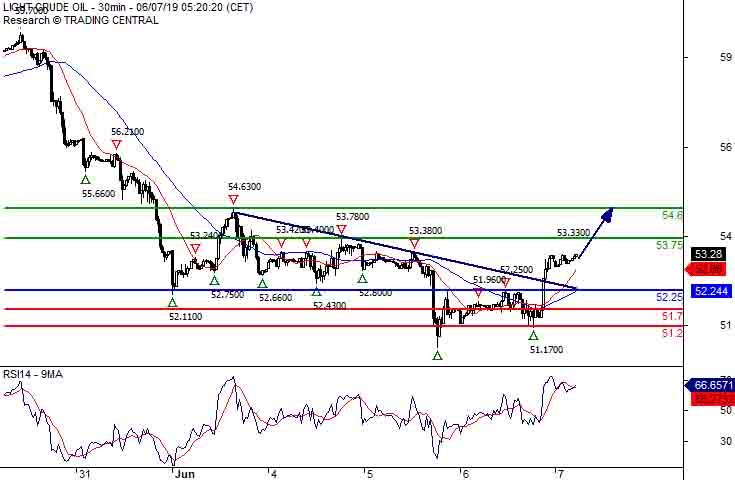
Pivot (invalidation): 52.25
Our preference Long positions above 52.25 with targets at 53.75 & 54.60 in extension.
Alternative scenario Below 52.25 look for further downside with 51.70 & 51.20 as targets.
Comment The RSI advocates for further advance.
Silver Spot Bullish Bias Above 14.8000
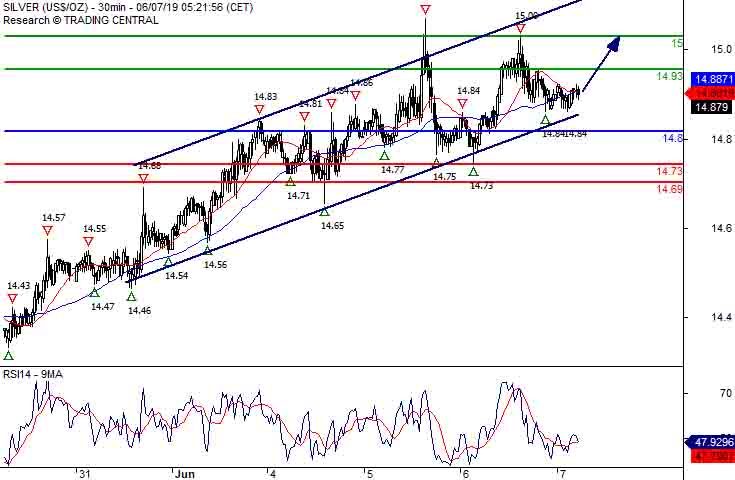
Pivot (invalidation): 14.8000
Our preference Long positions above 14.8000 with targets at 14.9300 & 15.0000 in extension.
Alternative scenario Below 14.8000 look for further downside with 14.7300 & 14.6900 as targets.
Comment The RSI lacks downward momentum.
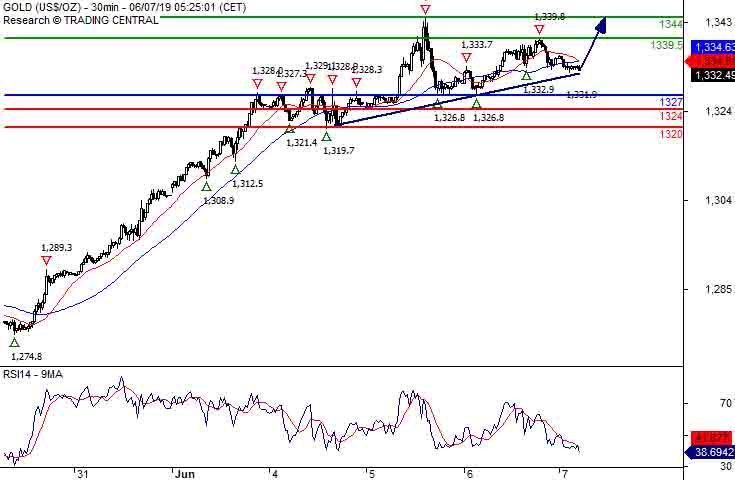
Gold Spot Supported By A Rising Trend Line
Pivot (invalidation): 1327.00
Our preference Long positions above 1327.00 with targets at 1339.50 & 1344.00 in extension.
Alternative scenario Below 1327.00 look for further downside with 1324.00 & 1320.00 as targets.
Comment A support base at 1327.00 has formed and has allowed for a temporary stabilisation.
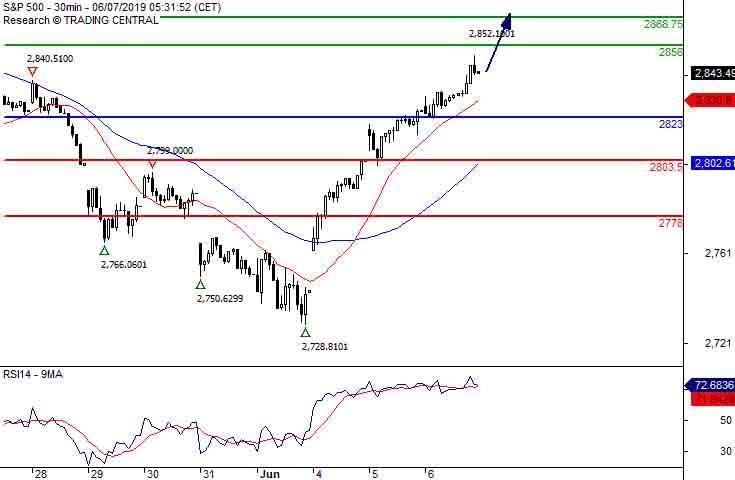
S&P 500 Aim @ 2868.75
Pivot (invalidation): 2823.00
Our preference Long positions above 2823.00 with targets at 2856.00 & 2868.75 in extension.
Alternative scenario Below 2823.00 look for further downside with 2803.50 & 2778.00 as targets.
Comment The RSI is bullish and calls for further advance.
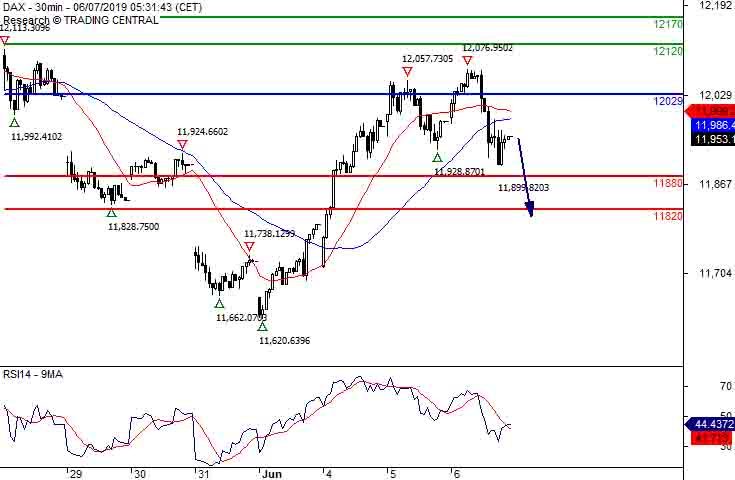
DAX Consolidation In Place
Pivot (invalidation): 12029.00
Our preference Short positions below 12029.00 with targets at 11880.00 & 11820.00 in extension.
Alternative scenario Above 12029.00 look for further upside with 12120.00 & 12170.00 as targets.
Comment The RSI is mixed and calls for caution.