Sample Category Title
USDCAD Indicators Turn Bearish, Ascending Line Eyed
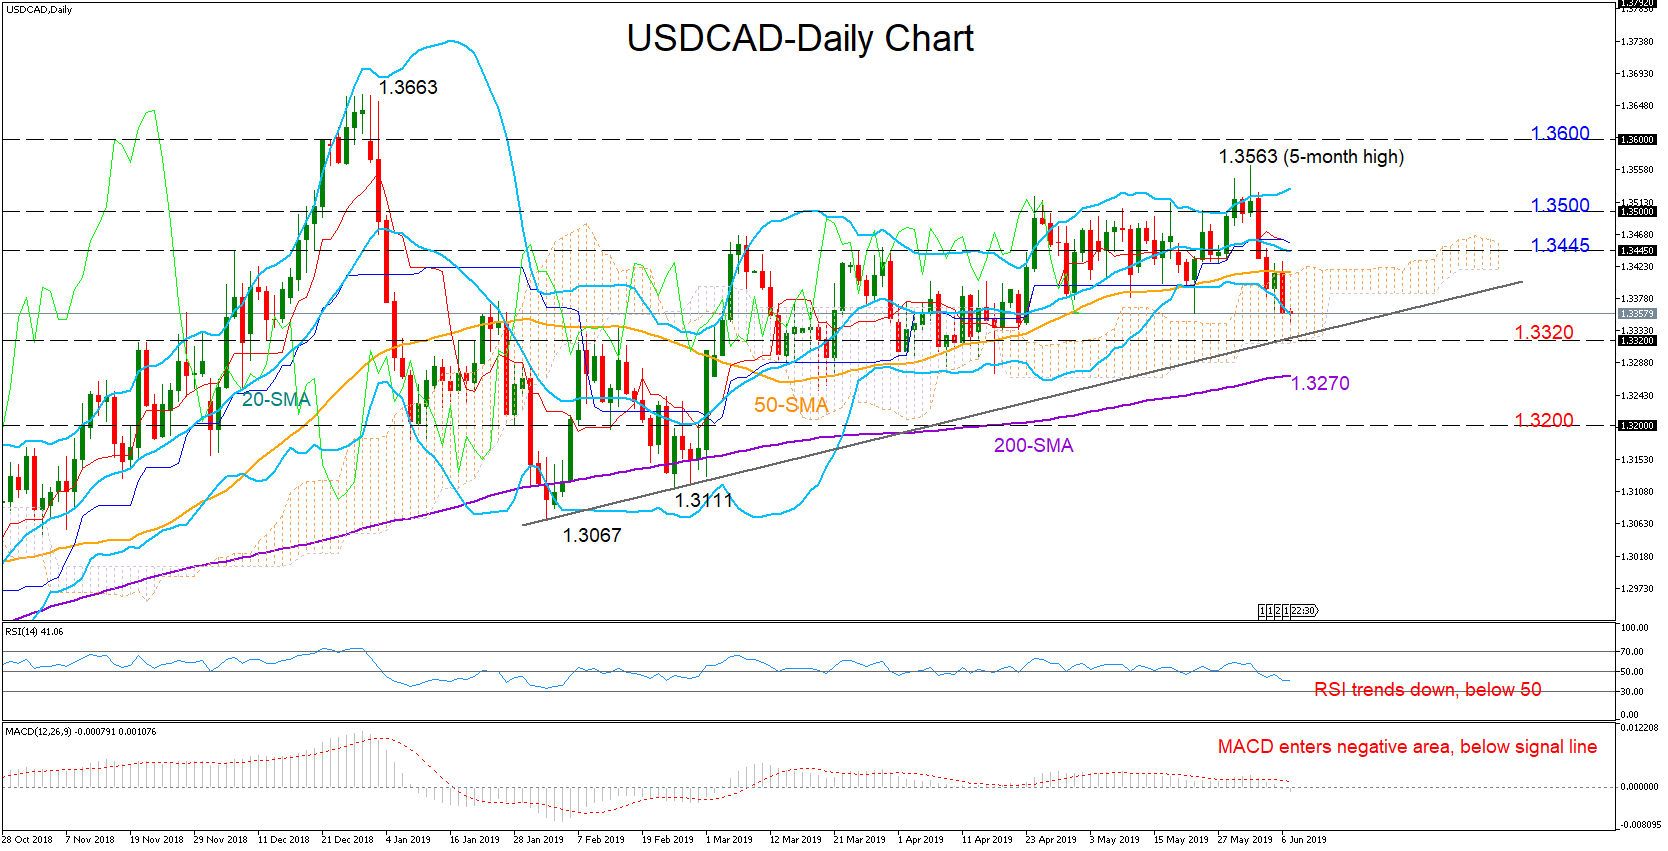
USDCAD lost around 1.20% this week to fall back below its 20- and 50-day simple moving averages (SMA) and into the Ichimoku cloud, while the momentum indicators turned bearish, flagging further weakness ahead. The MACD entered the negative zone, deviating further below its red signal line, and the RSI slipped under its 50 neutral mark.
The price, however, is currently testing the lower Bollinger band and is not far above the ascending line drawn from the 1.3067 bottom, a signal that further declines may be limited. Piercing the line at 1.3320 and dropping under the cloud, the 200-day SMA – currently at 1.3270 – could be the next target. Even lower, bearish action could extend until the 1.3200 psychological level.
In case of a rebound, the market may find a cap around 1.3445 before heading up to the 1.35 level. Above the latter, the bulls would push hard to finish the session on top of the 1.3563 peak and reach the 1.36 mark.
Meanwhile in the medium-term picture, which looks at the three-month performance, the outlook switched back to neutral following the slide below 1.3500.
In brief, the short-term bias looks bearish, while the medium-term profile turned neutral.
GBP/JPY Daily Outlook
Daily Pivots: (S1) 137.10; (P) 137.46; (R1) 137.92; More...
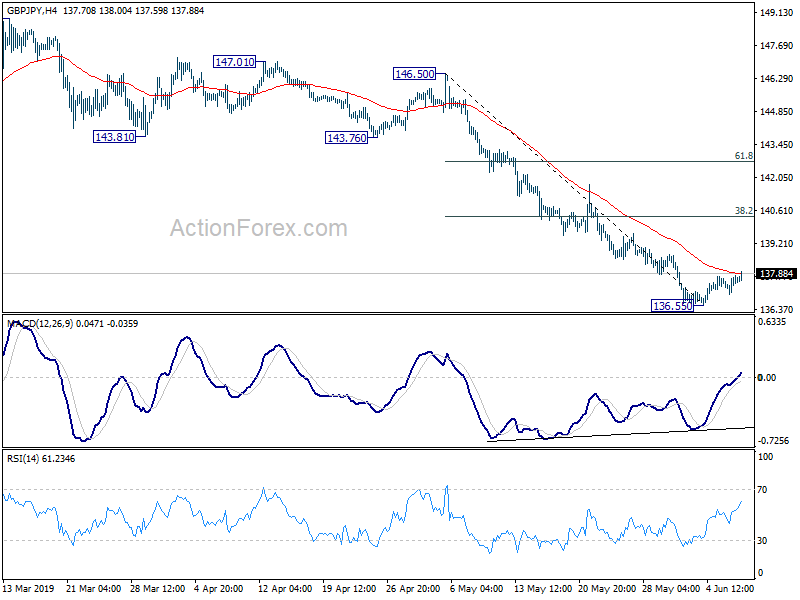
GBP/JPY is staying in consolidation from 136.55 and intraday bias remains neutral first. Upside of recovery should be limited by 38.2% retracement of 146.50 to 136.55 at 140.35 to bring fall resumption. On the downside, break of 136.55 will turn bias to the downside and extend the fall from 148.87 to 131.51 low.
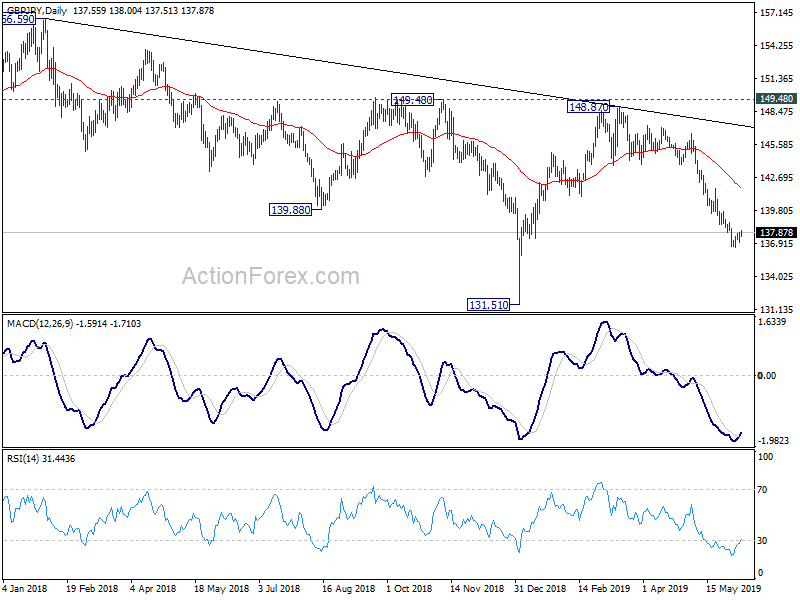
In the bigger picture, current development suggests that GBP/JPY medium term fall from 156.59 (2018 high) is still in progress. Break of 131.51 will target 122.36 (2016 low). Structure of such decline is corrective looking so far, arguing that it's just the second leg of consolidation from 122.36. Thus, we'd expect strong support from 122.36 to contain downside to bring reversal.
EUR/JPY Daily Outlook
Daily Pivots: (S1) 121.52; (P) 121.96; (R1) 122.67; More....
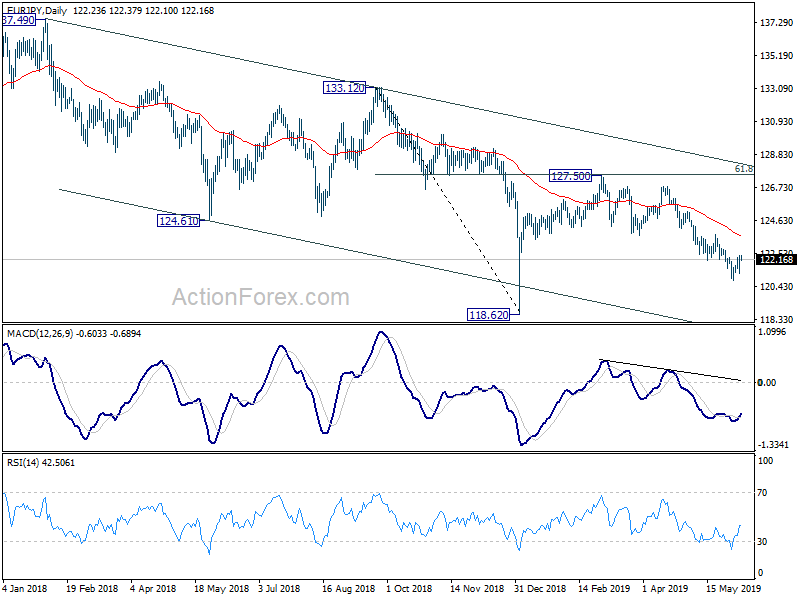
Intraday bias in EUR/JPY remains neutral as corrective rise from 120.78 is extending. Upside is still expected to be limited below 123.73 resistance to bring fail resumption. On the downside, break of 120.78 will resume the fall from 127.50 and target 118.62 low next.
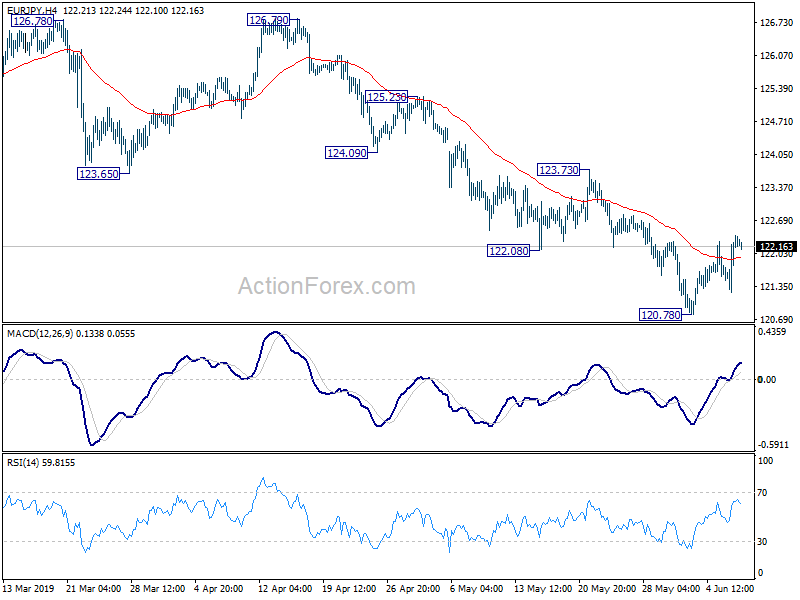
In the bigger picture, down trend from 137.49 is still in progress with the cross staying inside long term falling channel. Break of 118.62 will extend the fall to 109.48 (2016 low). On the upside, break of 123.73 resistance is needed to be the first sign of medium term reversal. Otherwise, outlook will remain bearish in case of strong rebound.
EUR/GBP Daily Outlook
Daily Pivots: (S1) 0.8846; (P) 0.8869; (R1) 0.8908; More...
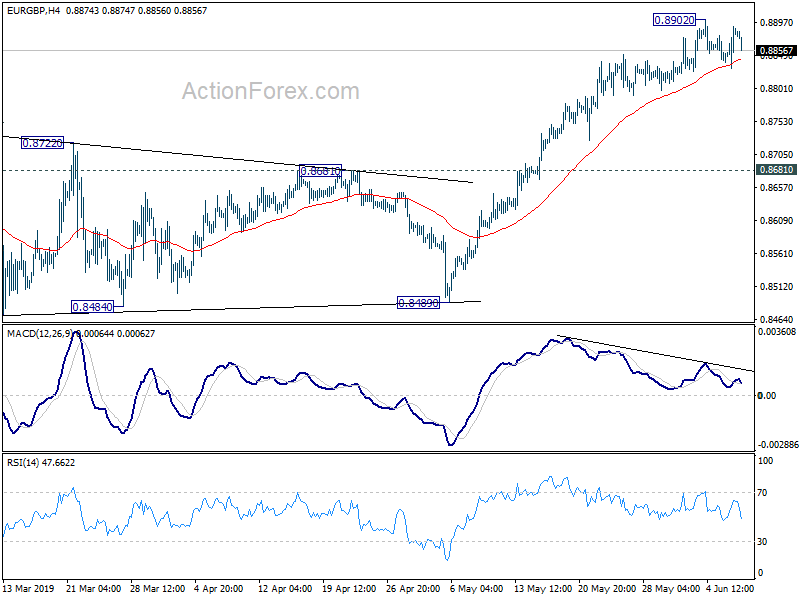
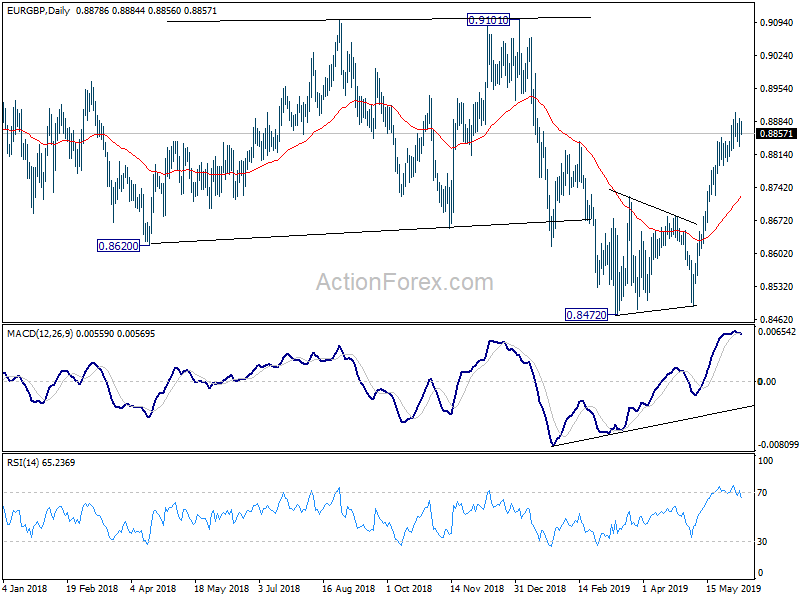
EUR/GBP is staying in consolidation from 0.8902 and intraday bias remains neutral. In case of deeper retreat, downside should be contained well above 0.8681 resistance turned support to bring rise resumption. On the upside, break of 0.8902 will turn bias back to the upside and target 0.9101 key resistance next.
In the bigger picture, medium term decline from 0.9305 (2017 high) is seen as a corrective move. No change in this view. Current development argues that it might have completed with three waves down to 0.8472, just ahead of 38.2% retracement of 0.6935 (2015 low) to 0.9306 at 0.8400, after hitting 55 month EMA (now at 0.8526). Decisive break of 0.9101 resistance will confirm this bullish case. Nevertheless, as EUR/GBP is still staying inside long term falling channel, correction from 0.9305 could still extend to 0.8400 fibonacci level before completion.
EUR/AUD Daily Outlook
Daily Pivots: (S1) 1.6099; (P) 1.6140; (R1) 1.6204; More...
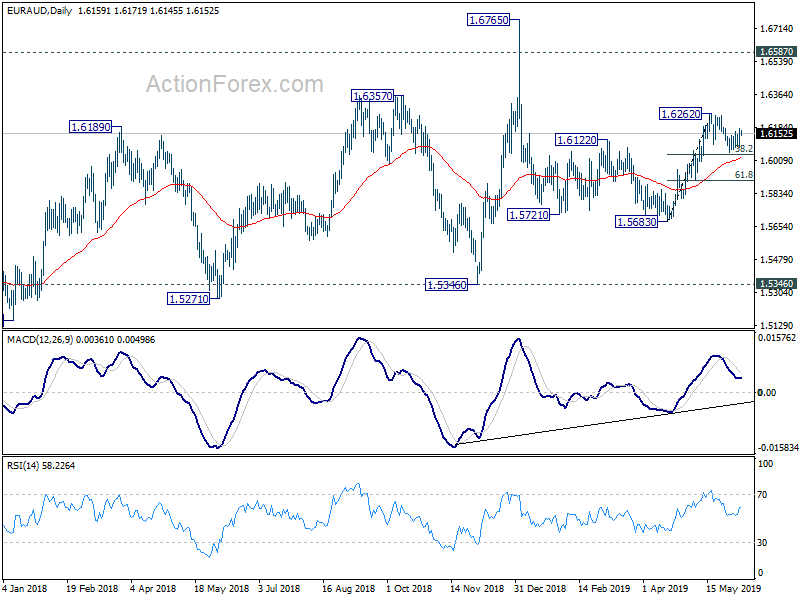
Intraday bias in EUR/AUD remains neutral as consolidation from 1.6262 is extending. Downside should be be contained by 38.2% retracement of 1.5683 to 1.6262 at 1.6041 to bring rise resumption. Correction from 1.6765 has completed with three waves down to 1.5683. On the upside, break of 1.6262 will pave the way to retest 1.6765 high. However, firm break of 1.6041 will dampen this view and bring deeper fall to 61.8% retracement at 1.5904.
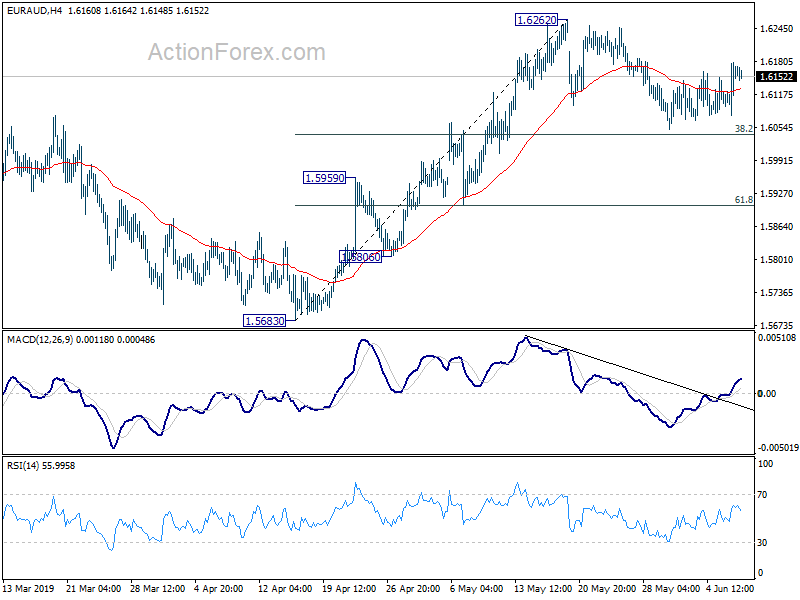
In the bigger picture, as long as 1.5346 support holds, outlook will still remain bullish. Up trend from 1.1602 (2012 low) is expected to resume sooner or later. Break of 1.6765 will target 61.8% retracement of 2.1127 (2008 high) to 1.1602 at 1.7488 next. However, firm break of 1.5346 key support will indicate trend reversal, with bearish divergence condition in weekly MACD, and turn outlook bearish.
EUR/CHF Daily Outlook
Daily Pivots: (S1) 1.1157; (P) 1.1177; (R1) 1.1200; More....
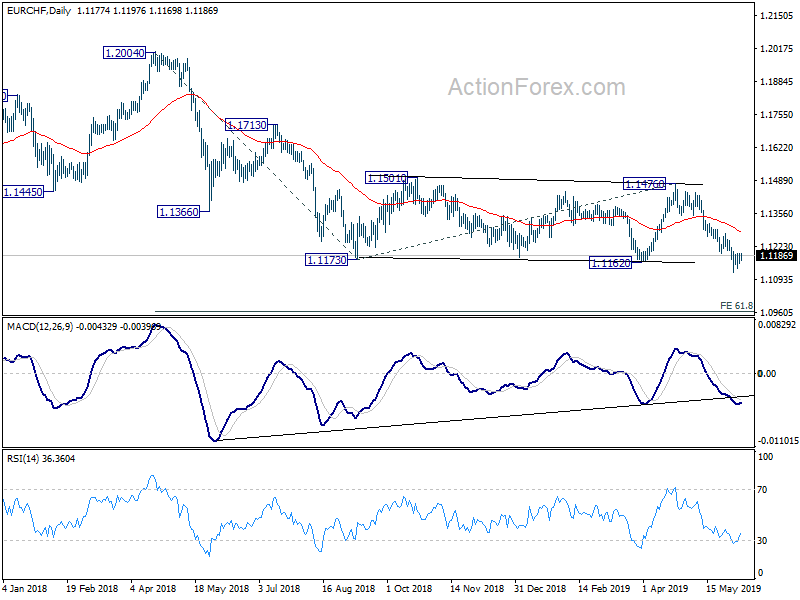
Intraday bias in EUR/CHF remains neutral as consolidation from 1.1119 is extending. In case of stronger recovery, upside should be limited by 1.1278 resistance to bring another fall. On the downside, break of 1.1119 will extend whole decline from 1.2004 and target 61.8% projection of 1.2004 to 1.1173 from 1.1476 at 1.0962 next.
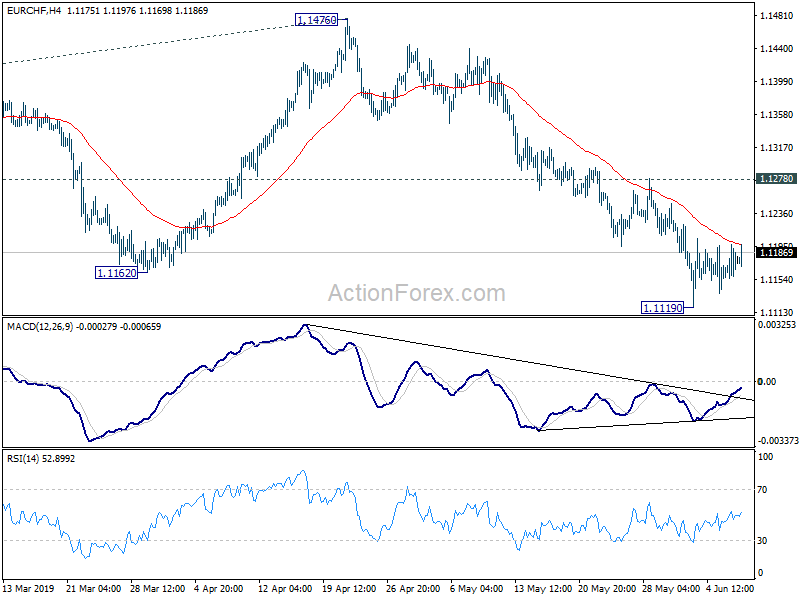
In the bigger picture, focus will stay on 61.8% retracement of 1.0629 to 1.2004 at 1.1154. Sustained break of 1.1154 will argue that fall from 1.2004 is itself a long term down trend. Next target will be 1.0629 support next. This will now remain the favored case as long as 1.1476 resistance holds even in case of rebound.
EUR/USD Outlook: Near-Term Action Remains Within Thick Daily Cloud And Eyes US Jobs Data For Fresh Signals
The Euro is holding in a quiet mode in early Friday's trading and awaiting US jobs data due later today, for fresh signals.
Trading in US session on Thursday was highly volatile after ECB, as the pair moved within 100-pips range after Mario Draghi's press conference.
Market understood the message from the ECB as less dovish than expected that helped the Euro to remain at the front foot and maintain bullish bias.
Focus turns towards US jobs data (May NFP 185K vs 263K in Apr, May AHE 0.3% f/c vs 0.2% Apr and unemployment expected to remain unchanged in May at 3.6%).
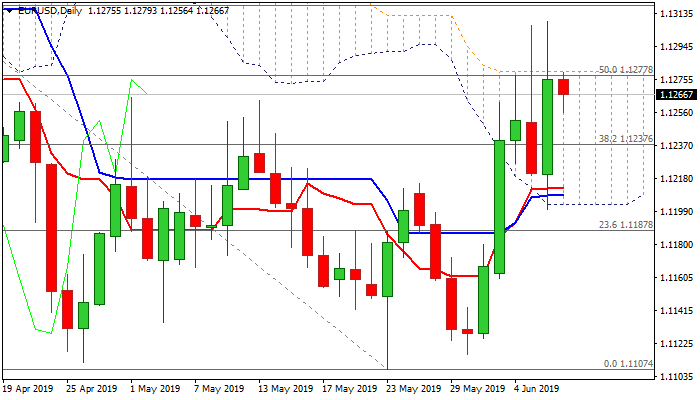
Release in line or above forecast would boost greenback and send Euro lower, while release below expectations would push the single currency for another attempt through key barriers at 1.1277/84 (daily cloud top / double-Fibo barrier) as weak data would likely add to signals for Fed rate cut, which could be expected as early as next week's FOMC policy meeting.
On the other side, strong fears in the market about an escalation of trade conflict would keep the greenback under pressure, even on upbeat jobs data, which would prompt Washington to maintain hard line in trade issues with China and Mexico.
Technical studies continue to send mixed signals as strong bullish momentum on daily chart is conflicting with south-heading stochastic, flat RSI and mixed setup of daily MA's.
Repeated failure to clearly break above 1.1277/84 pivots, despite upticks to 1.1306/08, weighs and keeps in play risk of reversal.
At the opposite side, 55SMA (1.1216) and daily cloud base (1.1202) mark strong supports and fresh bears may struggle to break lower.
Volatile trading is expected after release of US jobs data, however, firm break of either boundary of daily cloud is required for clearer direction signal.
Res: 1.1277, 1.1284, 1.1308, 1.1323
Sup: 1.1250, 1.1216, 1.1202, 1.1192
Gold Consolidates Ahead Of The Payrolls Report
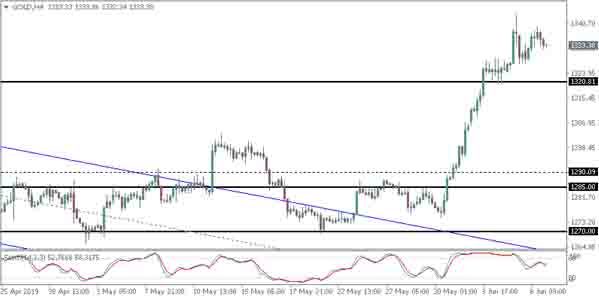
Gold continued to post gains on Thursday but the pace of gains look to be slower than the previous sessions. Perched near a four-month high, the precious metal awaits further clues from today’s payrolls report. Given the recent weak patch of jobs report from ADP, the prospects of a lower than forecast payrolls could give gold a boost.
Gold Forms a Minor Double Top
Gold prices were seen consolidating near the top end of the rally. Price action formed a minor double top pattern near 1337.75. If this double top pattern holds, then we could expect some downside. The lower support at 1320.80 remains the main target to the downside with further declines likely. The unfilled gap from earlier this week at 1305.37 will be the initial target.
EUR/USD Daily Outlook
Daily Pivots: (S1) 1.1217; (P) 1.1263; (R1) 1.1322; More.....
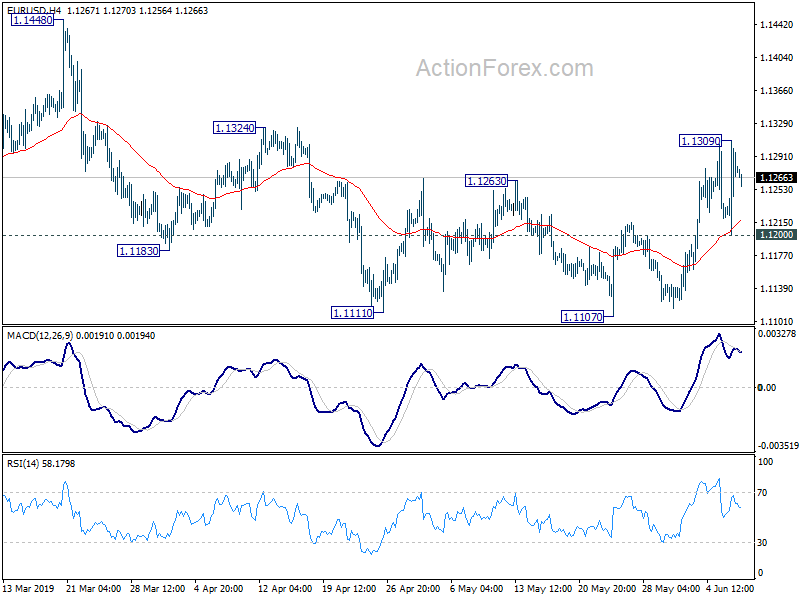
Intraday bias in EUR/USD remains neutral for consolidation below 1.1309. Further rise is expected as long as 1.1200 holds. Break of 1.1309 will extend the rebound from 1.1107 short term bottom to 1.1448 key resistance. Decisive break there will carry larger bullish implications. However, break of 1.1200 should now confirm completion of the rebound from 1.1107. Intraday bias will then be turned back to the downside for 1.1107 low instead.
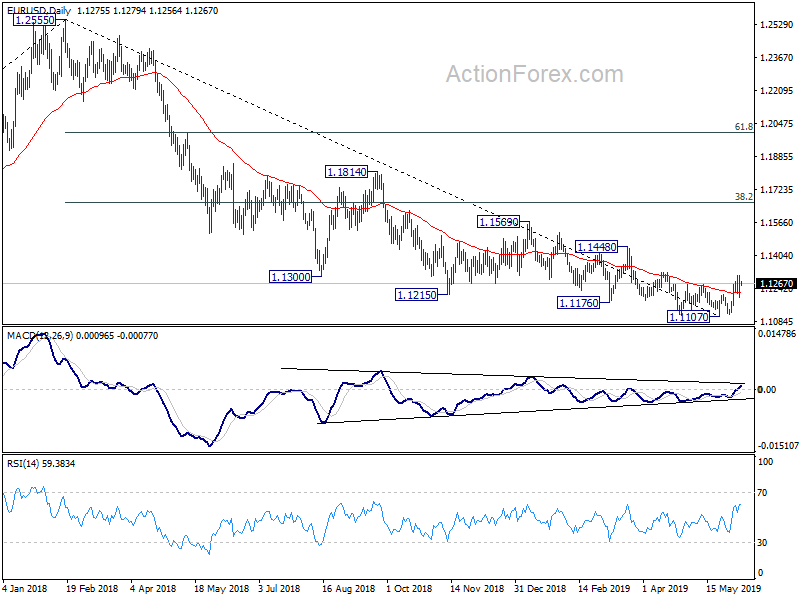
In the bigger picture, down trend from 1.2555 (2018 high) might still be in progress. Such decline would target 78.6% retracement of 1.0339 (2016 low) to 1.2555 (2018 high) at 1.0813 on resumption. However, break of 1.1448 resistance would confirm medium term bottoming, on bullish convergence condition in daily MACD. In such case, stronger rebound should be seen to 38.2% retracement of 1.2555 to 1.1107 at 1.1660. We'd look at the structure of the rebound to decide whether it's a corrective rise later.
Crude Oil Rebounds Modestly
WTI Crude oil prices posted a modest rebound from the recent lows as price is seen potentially forming a temporary bottom. The rebound in oil prices comes amid rising supply and weak global demand. Japan’s prime minister Abe is in Tehran to help resolve the stand-off between Iran and the U.S.
Is Crude Oil Posting a Dead Cat Bounce?
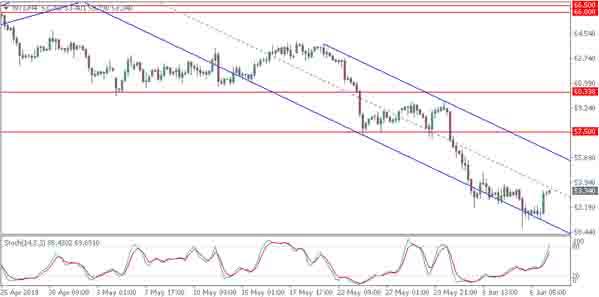
The rebound off the recent lows in crude oil has helped to push price only slightly higher. Price is seen trading near the 53.44 level which previously saw some consolidation. As long as this level holds, oil prices could remain range bound with the bias to the downside. The Stochastics oscillator is also showing a hidden bearish divergence which could indicate a potential downside. The lower support at $50.00 remains the downside target.