Sample Category Title
Gold: Yellow Metal Trading Slightly Lower In The Morning Session
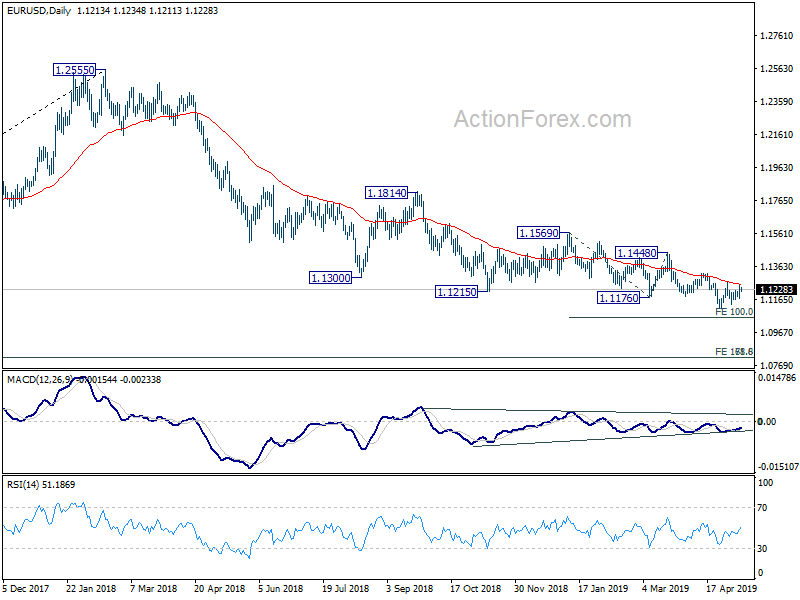
For the 24 hours to 23:00 GMT, Gold rose 0.24% against the USD and closed at USD1285.10 per ounce.
In the Asian session, at GMT0300, the pair is trading at 1284.80, with gold trading slightly lower against the USD from yesterday’s close.
The pair is expected to find support at 1280.40, and a fall through could take it to the next support level of 1276.00. The pair is expected to find its first resistance at 1289.20, and a rise through could take it to the next resistance level of 1293.60.
The yellow metal is showing convergence with its 20 Hr and 50 Hr moving averages.
Silver: White Metal Reverses Its Losses This Morning
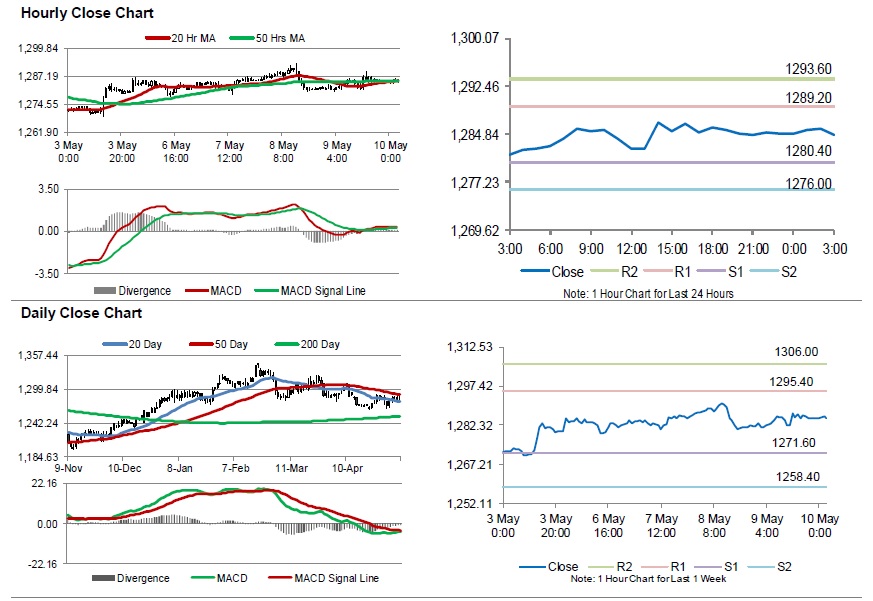
For the 24 hours to 23:00 GMT, Silver declined 0.64% against the USD and closed at USD14.76 per ounce.
In the Asian session, at GMT0300, the pair is trading at 14.80, with silver trading 0.24% higher against the USD from yesterday’s close.
The pair is expected to find support at 14.71, and a fall through could take it to the next support level of 14.63. The pair is expected to find its first resistance at 14.88, and a rise through could take it to the next resistance level of 14.96.
The white metal is showing convergence with its 20 Hr moving average and trading below its 50 Hr moving average.
Crude Oil: Oil Trading Higher, Ahead Of Baker Hughes Weekly Rig Count Data
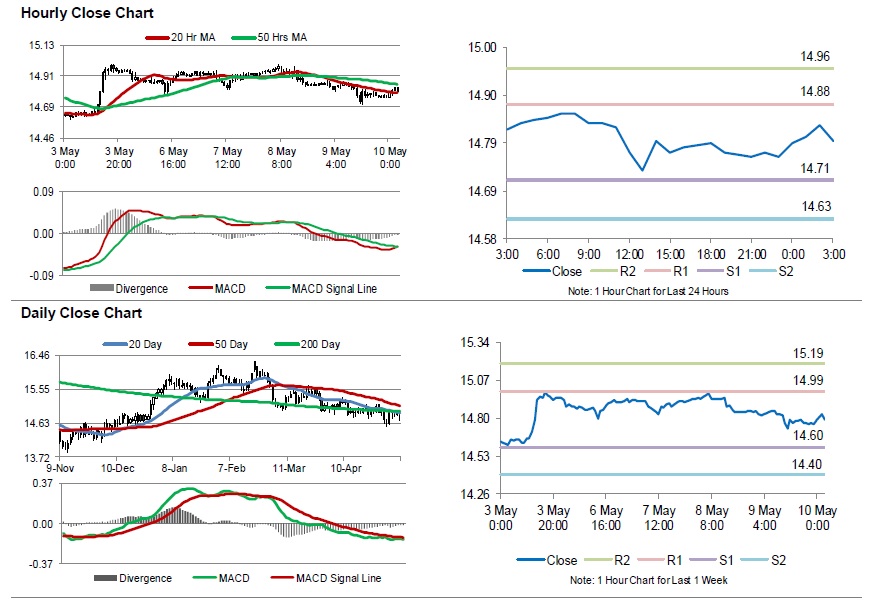
For the 24 hours to 23:00 GMT, Crude Oil declined 0.44% against the USD and closed at USD61.72 per barrel, amid mounting concerns over Sino-American trade war.
In the Asian session, at GMT0300, the pair is trading at 62.26, with oil trading 0.87% higher against the USD from yesterday’s close.
The pair is expected to find support at 61.29, and a fall through could take it to the next support level of 60.32. The pair is expected to find its first resistance at 62.86, and a rise through could take it to the next resistance level of 63.46.
Crude oil is trading above its 20 Hr and 50 Hr moving averages.
China Notes – US Hikes Tariffs Leaving High Uncertainty in Place
So this morning we have confirmed that the US raised tariff rates. Here is what we know currently:
- US raised tariff rates on USD200bn of Chinese goods from 10% to 25%.
- China says it deeply regrets the move and will retaliate.
- Trade talks will continue Friday.
- The two sides only talked for 90 minutes on Thursday.
- People close to the talks said to Bloomberg there is "little to no progress" in the talks.
Comment: The only good news here is that China stays for talks on Friday. The fact that talks were only 90 minutes suggests there was little movement on both sides. The talks Friday will probably focus on how to get talks back on track.
Best guess now is that both sides talk Friday and then pause for a rethink of how to proceed. If so, we are in for a period of high uncertainty. But we need to await the outcome of Friday's talks to make closer assessment.
We do not know details of how and when China will retaliate. But I think they will try to be measured on the surface, but start to halt purchases of US agricultural goods again. Tariffs may go up but China will aim to use measures that hurt the US but not themselves. That is why quantitative measures are better since they can buy agricultural goods elsewhere.
After Friday we should look out for whether Trump initiates the process of putting tariffs on the USD325 bn of Chinese goods he said he would do in his Sunday tweet. It would be a sign that the parties are far from each other and escalate matters further.
There are many scenarios from here but our baseline is still that we will have a deal by the end of Q2 - so within two months. The road there can take many paths, though. There is also a real risk that the problems are bigger and Trump adds more pressure with tariffs on all Chinese goods. This would be a mistake in our view as it would backfire quickly. But it is also a scenario that cannot be ruled out. For now, we need to see what comes out of the talks Friday. It can flip to both sides: further escalation, or resumption of talks with the aim to get a deal soon while tariffs and countermeasures are in place.
Note that apparently the tariff rate will not hit goods in transit but only goods shipped from China on 10 May. It leaves a window where tariffs will not be put on goods until they have reached the US with the potential they could be removed by then if a deal is struck.
RBA Cuts Growth and Inflation Forecasts in its May Statement on Monetary Policy
The RBA cuts its forecasts for growth and inflation to barely acceptable levels despite assuming two rate cuts as per market pricing. Westpac confirms its forecast for rate cuts in August and November.
The Reserve Bank’s May Statement on Monetary Policy (SMP) shows substantial reductions in the growth and inflation forecasts. GDP growth (to one decimal point) is now forecast at 2.6% for 2019 and 2.7% for 2020. That compares with 3.0% and 2.7% in the February Statement on Monetary Policy. The main explanations for the growth reductions for 2019 are consumption (2% down from 2.5%) and dwelling investment (–6.7% down from –4.5%).
As revealed in the Governor’s decision statement following the May Board meeting, the underlying inflation forecasts (trimmed mean) have been reduced from 2.0% for 2019 in the February SMP to 1.75% in May and the 2020 forecast reduced from 2.25% to 2.0%.
The forecast for the unemployment rate has been slightly increased, with the 5% unemployment rate still expected to hold through 2019 but the fall to 4.75% pushed back from December 2020 to June 2021.
It is very important to note that these forecasts are based on market pricing for the profile for the RBA cash rate and the current spot AUD. In February, markets had one cut priced-in for February 2020, whereas in May, one full cut is priced-in for August 2019 and a second priced-in for May 2020. The AUD trade weighted index is 2% lower than in February.
Consequently, despite a significantly lower cash rate profile, the growth and inflation forecasts have been lowered. These current forecasts are what we should call absolute ‘bare-essentials’ – growth slightly below trend (trend at 2.75%) and inflation only holding at the bottom of the 2–3% target band out to the end of the forecast horizon. It seems clear therefore that the RBA now believes that it needs to cut rates to barely achieve an acceptable outcome.
The timing of market pricing is slightly more cautious than Westpac’s forecasts (announced on February 21) of cash rate cuts in August and November 2019.
The reasonable issue therefore arises as to whether these cuts should not occur immediately. In that regard, we need to point to the lingering theme which the RBA has promoted for most of 2019. That theme relates to the “tension” between the labour market data and economic growth as depicted through the national accounts and partial indicators particularly around retail sales and the housing market.
In the introduction to this SMP, the RBA notes “in contrast to the signal coming from the national accounts, a number of labour market indicators remain positive. Employment growth was strong in the March quarter… the vacancy rate remains high and there are ongoing reports of skilled shortages”. However, the RBA’s own forecasts do not envisage the unemployment rate falling further until 2021, even with the rate cuts embedded in the forecasts.
Consequently, there remains a suspicion that their labour market forecasts might prove to be pessimistic and, if so, the favourable dynamics that would be associated with a much stronger labour market could be expected to develop. Those dynamics would be associated with faster wages growth, faster employment growth, faster growth in household incomes, faster consumption growth; a narrowing in the output gap, and therefore a more favourable profile for inflation. Given that the Bank must realise that it is nearing the floor of the cash rate a time to assess this prospect is reasonable.
The issue therefore becomes one of what data around the labour market will be required for the RBA to delay its rate cuts. That theme is fully emphasised in the final sentence in the introduction to the May SMP, “the Board will be paying close attention to developments in the labour market at its upcoming meetings”.
It has been Westpac’s view for some time that the unemployment rate has already bottomed out at 4.9% and we expect that it will gradually drift up through the second half of 2019 to around 5.4%. We expect that trend to become clearly apparent by the June employment report (released in late July), making the first cut an obvious decision for the August meeting. There is always a risk that such a trend could emerge more quickly, but, given the volatility of the monthly employment reports, and the “strong employment growth in the March quarter”, we would be surprised if the RBA was prepared to abandon that hope at an earlier Board meeting.
We are not surprised that the RBA has now adopted our own view of the consumer with its big reduction in forecast consumer spending growth to 2% in 2019 now broadly in line with our own. The RBA is also moving towards our forecast for the contraction for dwelling investment in 2019 of 9%, having now forecast -6.7% from -4.5%, and an overall reduction in the GNE forecast from 2.6% to 1.9% (Westpac’s forecast is 1.6%).
Conclusion
Today’s SMP emphasises that the RBA thinks it’s highly likely that it will need to follow market pricing with two rate cuts. Westpac concurs with the market’s August timing for the first cut but expects that the second cut will occur in November – well before the timing implied by market pricing of a full cut by May 2020.
The risk remains that the RBA may choose to move earlier than August, although given the strong first quarter for employment growth and the notorious volatility of the monthly employment reports, it seems likely that a prudent central bank would wait until August for its first move - when of course it will be able to fully explain the move and support it with its revised forecasts in the next Statement on Monetary Policy.
RBNZ: That’s All, Folks
- Today we are reaffirming our forecast that the RBNZ will keep the OCR on hold at 1.5% for the remainder of 2019.
- This is a finely balanced call. A follow-up cut is possible if the data weakens further.
- But as we said on April 3, we expect an economic pickup later this year to remove thoughts of another OCR cut.
- Previously, we thought that the introduction of capital gains tax (CGT) would prompt an OCR cut in 2020.
- But the Government has cancelled CGT. That, combined with low mortgage rates, has seen us shift to forecasting 7% house price inflation next year.
- Under such conditions, we no longer see a rationale for cutting the OCR in 2020.
- We are now forecasting no change in the OCR until mid-2022.

On April 3 this year we issued a forecast that the OCR would be cut to 1.5% this week, would remain at 1.5% throughout 2019, and would be cut again to 1.25% in mid-2020. The rationale was:
- The RBNZ had floated the idea of cutting the OCR, and it was starting to look as though inflation would struggle to reach 2% if the OCR was kept at 1.75%, so we thought an immediate cut was warranted.
- We expected the economy to pick up over the remainder of 2019 due to fiscal stimulus, a stabilisation in the global economy, and accelerating building activity. This would cancel any thought of a follow-up cut later in 2019.
- We thought a capital gains tax or similar policy would be legislated and campaigned on for the next election, causing weakness in the housing market and low business confidence during 2020. In turn, this would prompt the RBNZ to cut the OCR again at that time.
Now that the first leg of that thinking is in the past, scrutiny is turning to the second – will the RBNZ's cut be a case of “one-and-done”, as we suggested a month ago, or will they cut again in 2019?
The new Monetary Policy Committee has shown that it is willing to act decisively and proactively, meaning another cut is certainly possible, depending on how the data evolves.
But we put the odds of a follow up cut at slightly less than 50%. We still think it is more likely that the RBNZ will leave the OCR at 1.5% for the remainder of the year.
The RBNZ itself is 50/50 on whether another OCR cut will be required, meaning some form of downside surprise would be required to actually prompt a cut. At this stage, we don't think there is a high likelihood of that happening. The RBNZ is already braced for weak data in the near term – for example, it is forecasting 0.4% for March quarter GDP, lower than our forecast of 0.5%. Getting numbers that are south of the RBNZ's downbeat near-term forecasts is not the most likely scenario.
Beyond the coming few months, our view remains that evidence of a strengthening economy will scotch any thought of cutting the OCR.
The global economy will be crucial to the RBNZ's decisions. We think it is likely to stabilise this year, thanks to sharply lower interest rates and fiscal stimulus. Equity markets seem to agree, judging by the sharp rise in global share prices over the past few months.
Having confirmed our 2019 OCR forecast, we will take the opportunity to fine-tune our longer-term view. We are no longer forecasting an OCR cut in mid-2020.
The third leg of the reasoning laid out above was wrong. The Government has cancelled any possibility of a capital gains tax (CGT). There is no longer any reason to think the housing market is going to slow in 2020. Far from it. We now expect house price inflation to accelerate to 7% by mid-2020, due to the recent sharp drop in mortgage rates.
Our revised view that the housing market will accelerate over the coming year, rather than decelerate, has removed the rationale for forecasting an OCR cut in 2020.
We now expect the OCR to remain at 1.5% until mid-2022.
Cliff Notes: RBA holds in May; Westpac Continues to Expect cuts in August and November
Key insights from the week that was.
Following the March quarter CPI report, a May RBA rate cut became the majority opinion amongst Australian market economists. Westpac however remained of the view that the first cut would instead come in August after the labour market turned down and as the RBA recognised growth was set to remain well-below trend through 2019.
Westpac’s view proved correct for May, and the language of the decision statement was also consistent with our August/ November timing for rate cuts. Of greatest importance, the Board inferred in the statement that the labour market would have to strengthen further to stay a rate cut(s). In stark contrast, our analysis of the labour market suggests the cyclical sectors have already turned down sharply and that the headline measures will follow from April (a key release for next week).
On GDP growth, while the RBA only marked their 2019 GDP growth forecast to trend in May, the data-to-hand continues to point to a much weaker outcome. Note, in this week’s retail trade data for the March quarter, sale volumes were shown to be up just 0.2% over the nine months to March. Ahead, as the labour market deteriorates, house price declines continue and the savings rate lifts, consumption (and consumer-linked investment in the retail sector) will come under further pressure.
Across the Tasman, the RBNZ sought to get ahead of the curve by cutting the cash rate 25bps at their May meeting to 1.50%. The RBNZ had previously been betting on stronger growth in the domestic economy getting inflation back to the 2.0%yr target. However, this has not eventuated and hence, given global risks, the RBNZ decided to act.
Turning to Europe, the recent stabilisation in European data continued this week. The final April services PMI, March retail sales and May Sentix investor confidence all slightly beat consensus expectations, though March German factory orders underwhelmed. ECB President Draghi also remained constructive regarding policy’s effectiveness, reiterating a need to be patient and persistent to bring inflation back to target and that the ECB “don’t accept defeat”.
Over in the UK, the political situation continues to deteriorate. After a swing in local elections away from the conservatives, infighting is growing (again). Equally concerning, a Tory-Labour compromise is looking unlikely in the near-term, portending persistent Brexit uncertainty.
Finally to US and China trade. At the beginning of the week, President Trump surprised global markets by turning up the heat on China. Today the 10% tariff on $200bn of imports is set to be increased to 25% unless a deal can be reached in last-minute negotiations. A 25% tariffs on the remaining $325bn of imports from China to the US has also been mooted, though the timing is unknown.
If they become policy, these threats will not only put at risk China’s 2019 growth target of 6.0% –6.5%, but also the outlook for the US economy. The mutual cost to both nations is reason to believe a resolution will be reached, but not necessarily today. Clearly, there is significant distance between the two parties and the subject matter is highly contentious.
USD/CAD Daily Outlook
Daily Pivots: (S1) 1.3456; (P) 1.3480; (R1) 1.3502; More...
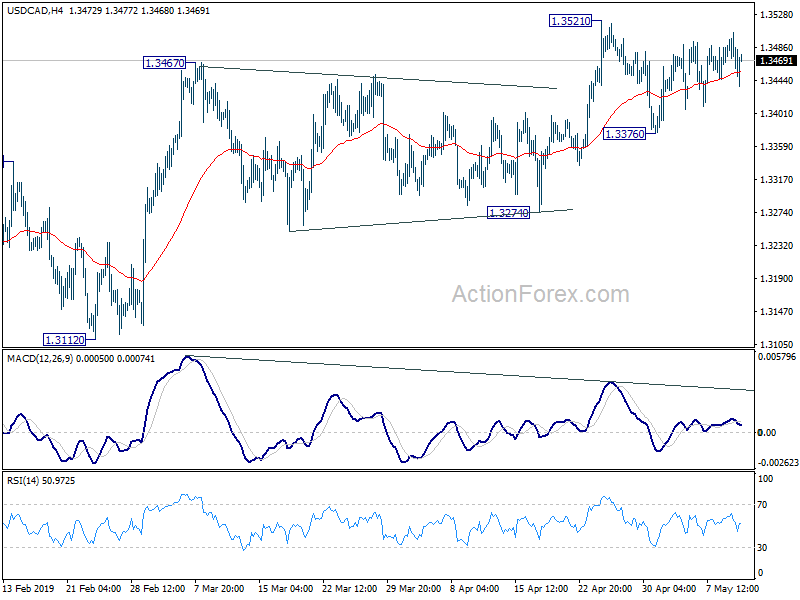
No change in USD/CAD's outlook as consolidation from 1.3521 is extending. Intraday bias remains neutral for the moment. Another decline could be seen as consolidation continues. But outlook will remain bullish as long as 1.3274 support holds. On the upside, firm break of 1.3521 will resume the whole rise from 1.3068 to retest 1.3664 high. However, decisive break of 1.3274 support will indicate completion of 1.3068 and turn outlook bearish.
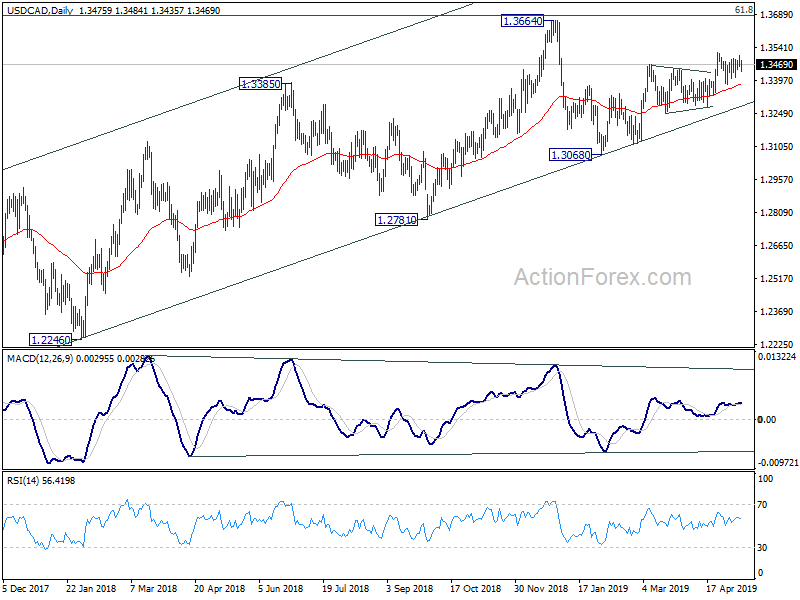
In the bigger picture, USD/CAD is staying well inside medium term rising channel (support at 1.3272). Thus, the up trend from 1.2061 (2017 low) should be in progress. On the upside, decisive break of 61.8% retracement of 1.4689 (2016 high) to 1.2061 at 1.3685 will pave the way to 78.6% retracement at 1.4127 next. This will remain the favored case as long as 1.3068 support holds. However, sustained break the channel support will be the first sign of medium term reversal. Firm break of 1.3068 would confirm.
AUD/USD Daily Outlook
Daily Pivots: (S1) 0.6967; (P) 0.6983; (R1) 0.7002; More...
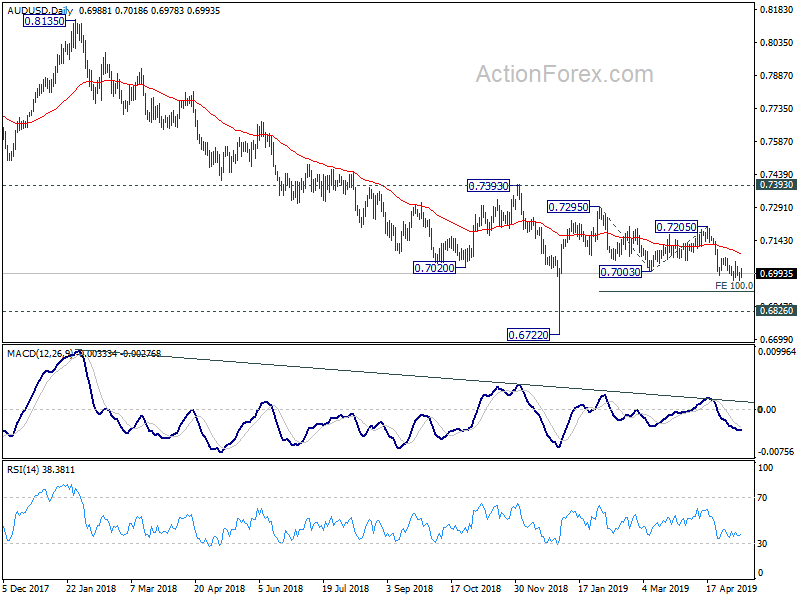
Intraday bias in AUD/USD remains neutral as consolidation from 0.6962 is extending. Another recovery cannot be ruled out. But upside should be limited by 0.7069 resistance to bring fall resumption. On the downside, break of 0.6962 will resume the fall from 0.7295 to 100% projection of 0.7295 to 0.7003 from 0.7205 at 0.6913. Decisive break there will indicate further downside acceleration and pave the way to retest 0.6722 low. However, considering bullish convergence condition in 4 hour MACD, firm break of 0.7069 will indicate near term bottoming and turn bias back to the upside for 0.7205 resistance and above.

In the bigger picture, with 0.7393 key resistance intact, medium term outlook remains bearish. The decline from 0.8135 (2018 high) is seen as resuming long term down trend from 1.1079 (2011 high). Decisive break of 0.6826 (2016 low) will confirm this bearish view and resume the down trend to 0.6008 (2008 low). However, firm break of 0.7393 will argue that fall from 0.8135 has completed. And corrective pattern from 0.6826 has started the third leg, targeting 0.8135 again.
EUR/USD Daily Outlook
Daily Pivots: (S1) 1.1173; (P) 1.1213 (R1) 1.1251; More.....
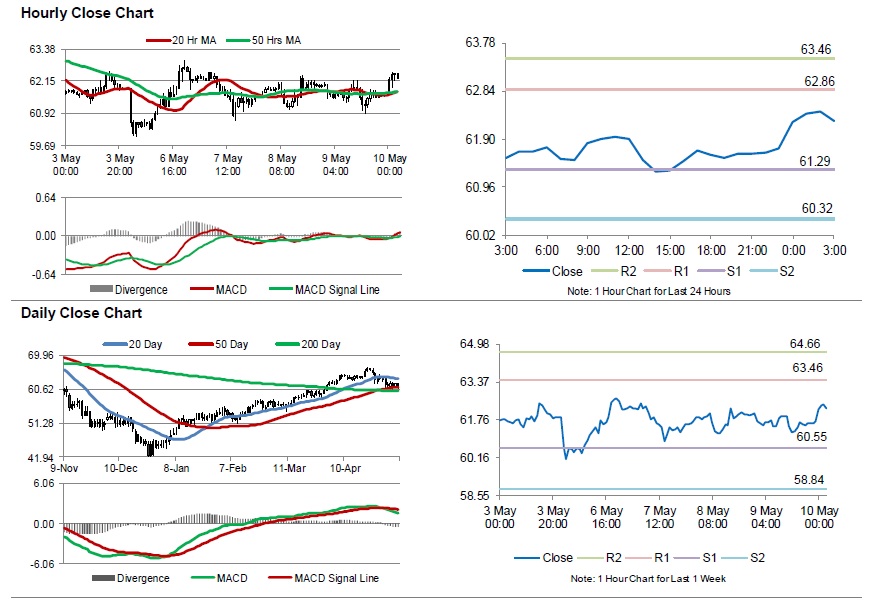
Intraday bias in EUR/USD remains neutral as it's staying in range of 1.1111/1264. More consolidation could be seen and stronger rise cannot be ruled out, even through 1.1264 resistance. But still outlook will remain bearish as long as 1.1324 resistance holds. Larger down trend is expected to resume sooner or later. On the downside, break of 1.1111 low will target 100% projection of 1.1569 to 1.1176 from 1.1448 at 1.1105 next. However, firm break of 1.1324 will be an early sign of larger trend reversal. In such case, further rise would be seen back to 1.1448 resistance for confirmation.
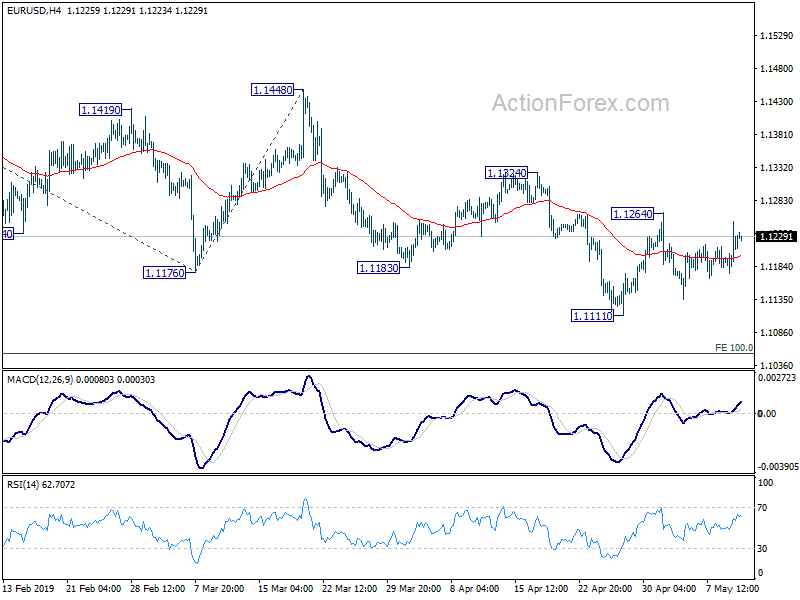
In the bigger picture, down trend from 1.2555 (2018 high) is still in progress. Current fall should now target 78.6% retracement of 1.0339 (2016 low) to 1.2555 (2018 high) at 1.0813. Sustained break there will pave the way to retest 1.0339. On the downside, break of 1.1448 resistance is needed to be the first sign of medium term bottoming. Otherwise, outlook will stay bearish in case of rebound.