

Sample Category Title
EUR/AUD Mid-Day Outlook
Daily Pivots: (S1) 1.5961; (P) 1.5993; (R1) 1.6046; More...
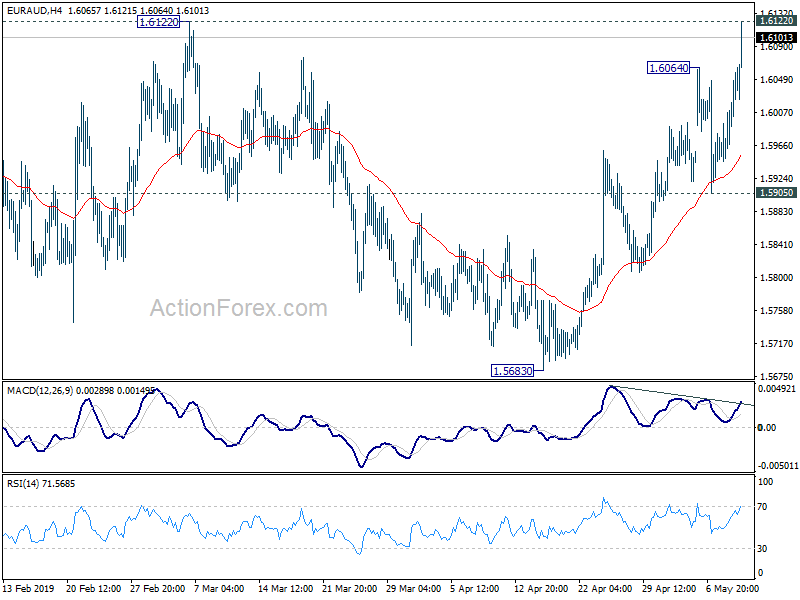
EUR/AUD's rally resumes by powering through 1.6064 temporary top and intraday bias is back on the upside. Focus is now on 1.6122 resistance. Decisive break will confirm the bullish view that correction from 1.6765 has completed with three waves down to 1.5683. In this case, further rise should be seen back to retest 1.6765 high. On the downside, break of 1.5905 support is needed to indicate completion of the rise from 1.5683. Otherwise, near term outlook will remain bullish in case of retreat.
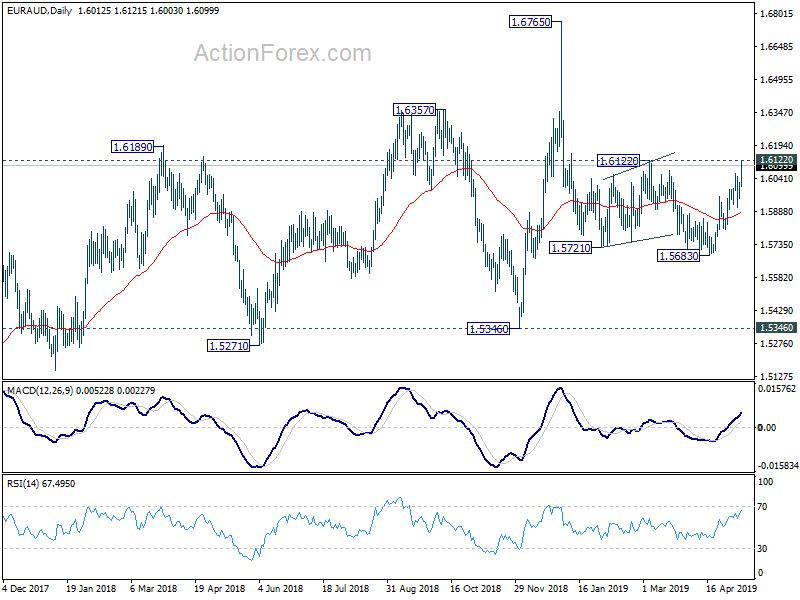
In the bigger picture, as long as 1.5346 support holds, outlook will still remain bullish. Uptrend from 1.1602 (2012 low) is expected to resume sooner or later. Break of 1.6765 will target 61.8% retracement of 2.1127 (2008 high) to 1.1602 at 1.7488 next. However, firm break of 1.5346 key support will indicate trend reversal, with bearish divergence condition in weekly MACD, and turn outlook bearish.
Specter of Trade War Returns to Haunt Markets
Investor attention has turned back to trade, as the US considers whether to launch another round of tariffs on China early on Friday (04:00 GMT). If tariffs are indeed increased, that would probably send stock markets plunging as investors brace for China’s retaliation, or worse yet for a breakdown in the talks. In the bigger picture though, the most likely endgame is still that a deal will ultimately be reached.
After months of optimistic comments from both the US and China that a trade deal is just around the corner, that narrative was turned on its head earlier this week, after President Trump threatened to impose more tariffs by Friday. It seems China attempted to renegotiate some points at the ‘last minute’, infuriating the US administration, which saw that as backpedaling on earlier promises. Trump therefore decided to ramp up the pressure, reverting back to his original methods of ‘raising the stakes’ to generate negotiating leverage and force concessions.
The threat was that the existing tariffs on $200bn worth of Chinese goods will be raised to 25% on Friday, from 10% currently, and that new levies will be imposed on the remaining $325bn of products from China ‘shortly’.
Give me shelter
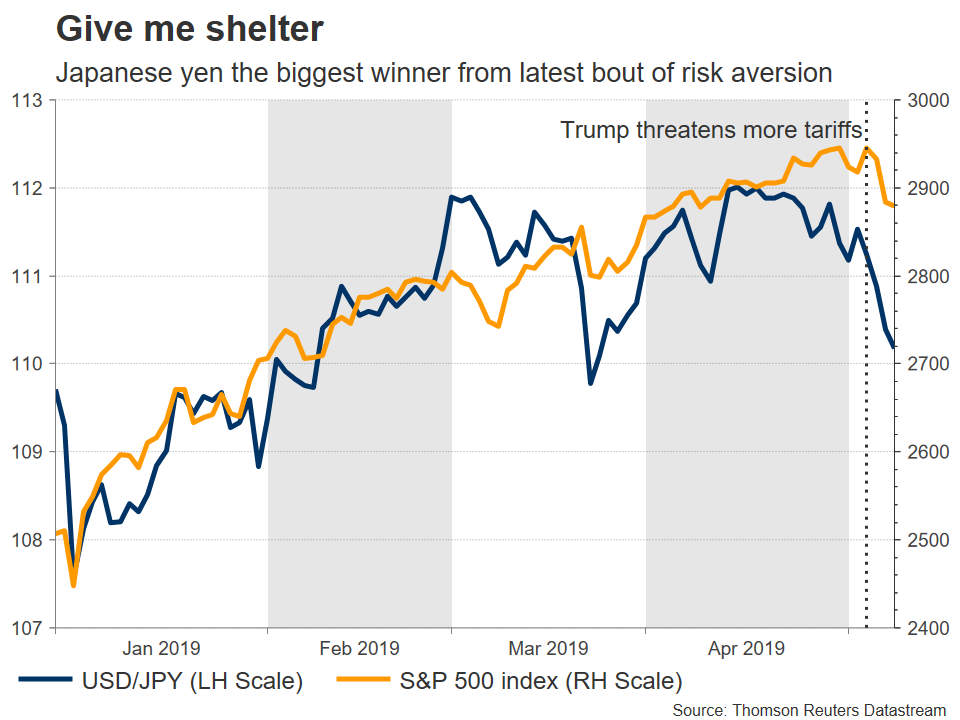
Naturally, markets were caught off guard and reacted sharply, with stocks in particular feeling most of the pain. Meanwhile, safe-haven assets – such as bonds and the Japanese yen – are back in high demand as investors seek shelter from the looming trade storm.
Commodity currencies such as the Australian, New Zealand, and Canadian dollars have held up reasonably well so far, but that could change quickly if tensions begin to escalate.
Salvaging efforts
All hope is not lost yet, though. The Chinese Vice Premier, Liu He, is currently in Washington for more talks in hopes of averting further tariffs and salvaging the overall deal. Alas, that may be easier said than done.
China doesn’t want to lose face domestically by completely caving to US demands, nor does it want to negotiate with ‘a gun to its head’. This implies that while Beijing could make some concessions, those will likely fall short of the ‘unconditional surrender’ the US is looking for. In other words, unless China is truly willing to lose face, the existing tariffs could very well be raised early on Friday.
Not all tariffs are created equal
Even if the existing tariffs on $200bn of goods are raised this week, introducing new levies on all remaining imports from China would be a different beast. Many of those items escaped the original tariff list for good reason, with several being core consumer products like phones, clothing, and computers.
The point is that taxing such goods may prove politically problematic as it could enrage consumers ahead of the 2020 election race. Public opinion could swing quickly if Apple products become more expensive overnight for example.
Therefore, while Trump may be prepared to escalate matters this week, he may stop short of pulling the trigger on new tariffs, not only due to fear that his approval rating could take a major hit but also to avoid sending US stock markets crashing down.
Market reaction
Make no mistake, what happens overnight will probably dictate market sentiment in the coming days or weeks. Either the two sides reach common ground and an increase in tariffs is averted, sending the signal that a deal is still within grasp, or levies are raised and uncertainty skyrockets as investors start to brace for China’s retaliation – or worse yet for a complete breakdown in the talks.
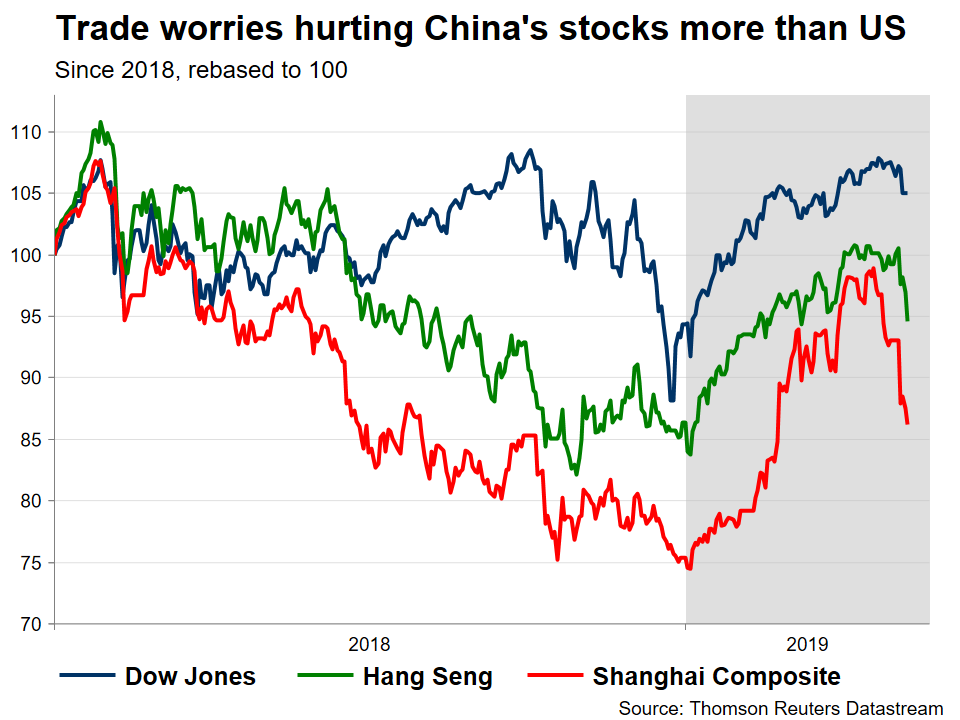
In the scenario of escalation, which on the margin seems more likely, stock markets would probably plummet alongside commodity currencies. The main beneficiary may be the Japanese yen as investors flock to safe havens, and perhaps to a lesser extent the dollar. On the flipside, if the tariff increase is avoided then equities could experience a major relief rally as the yen retreats.
But endgame still a deal
In the big picture, a deal still seems like the most likely outcome. Both sides have too much to lose by playing this game for much longer. Trump wants to score a ‘victory’ and wrap this up before the 2020 election race, while also preventing any real pain for US stock markets, which he considers a barometer for his success.
China wants to avoid any more damage to its economy, and while one could argue that can be negated with even more stimulus, remember that massive easing also carries considerable debt and financial stability risks – something Chinese policymakers are acutely aware of.
The bottom line is that regardless of what happens this week, the endgame is still an agreement. That being said, uncertainty has clearly returned and things could get worse before they get better from here.
The technical picture
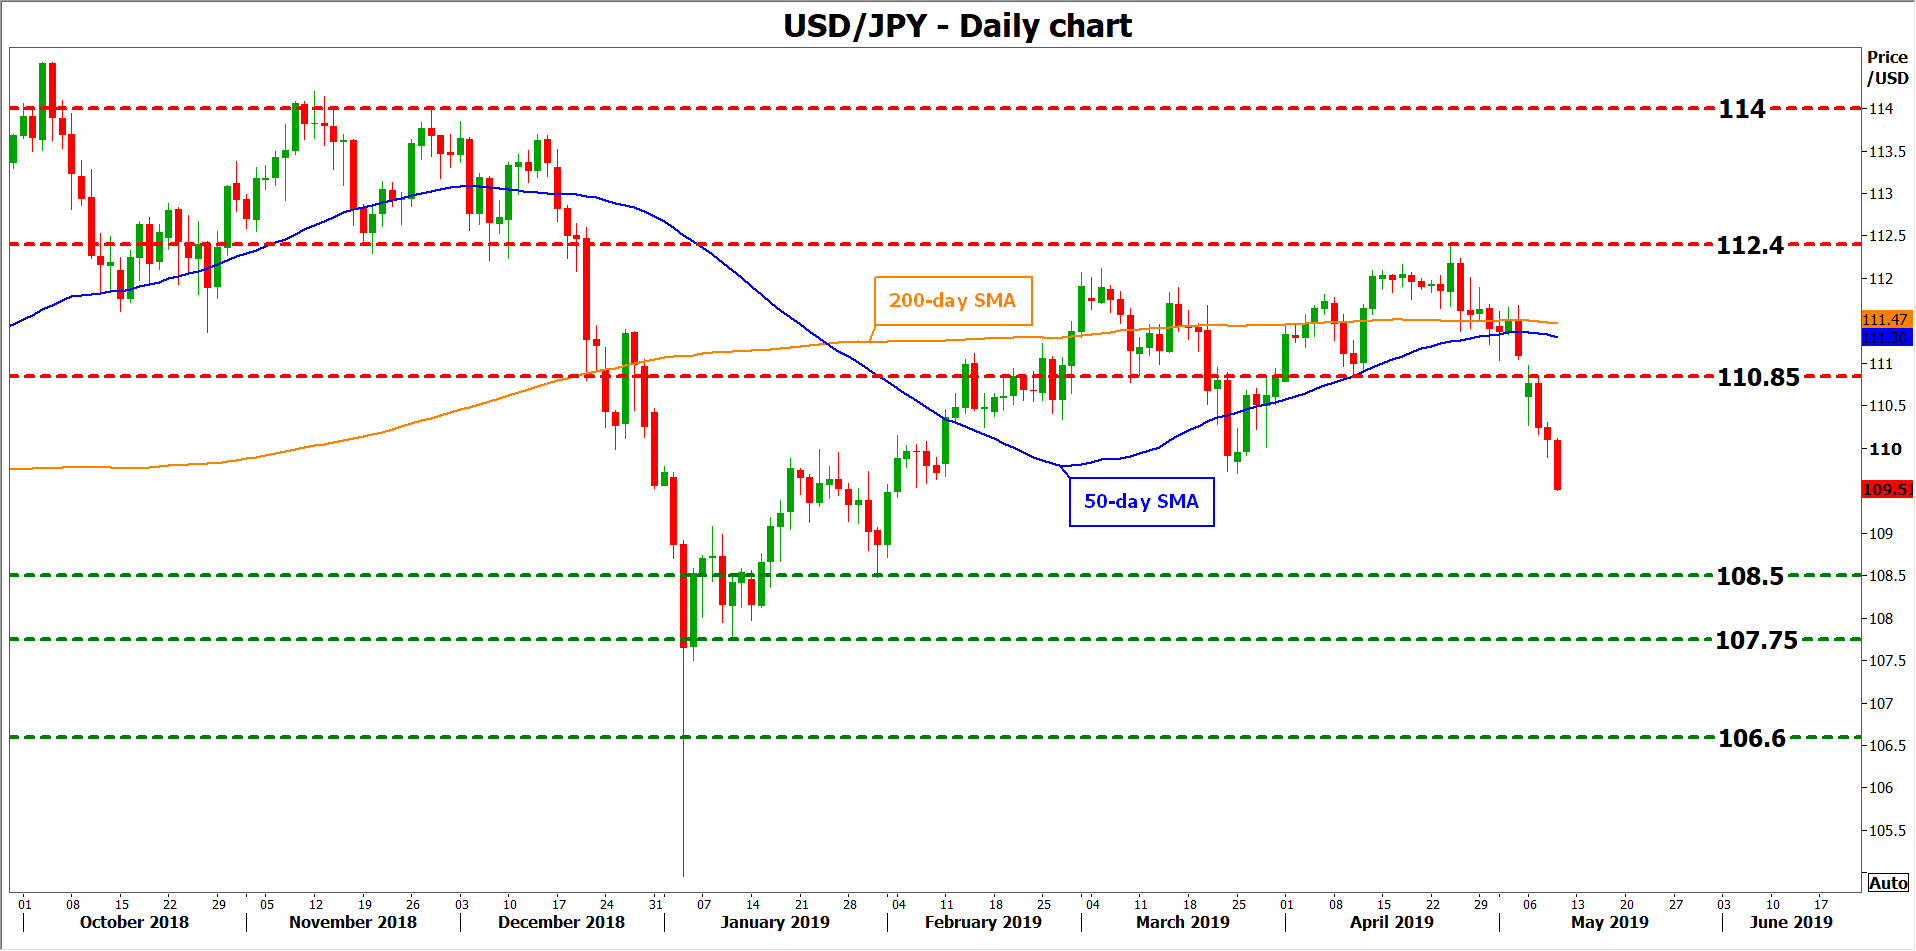
Taking a technical look at dollar/yen, support to further declines – for example in case tariffs are raised overnight – may be found near 108.50, the January 31 low. Even lower, attention would shift to the 107.75 area.
On the other hand, if trade tensions subside, the pair could reverse higher. Initial resistance to advances may come around 110.85, a zone defined by the April 10 trough, with even steeper advances aiming for the April high of 112.40.
Canadian Employment Report is Focal Point for Loonie this Week
The Canadian dollar is trading near its 2019 lows against the US dollar as investors await the employment report for April on Friday at 1230 GMT. Stronger figures in employment may provide some more relief to the domestic currency, sending dollar/loonie lower.
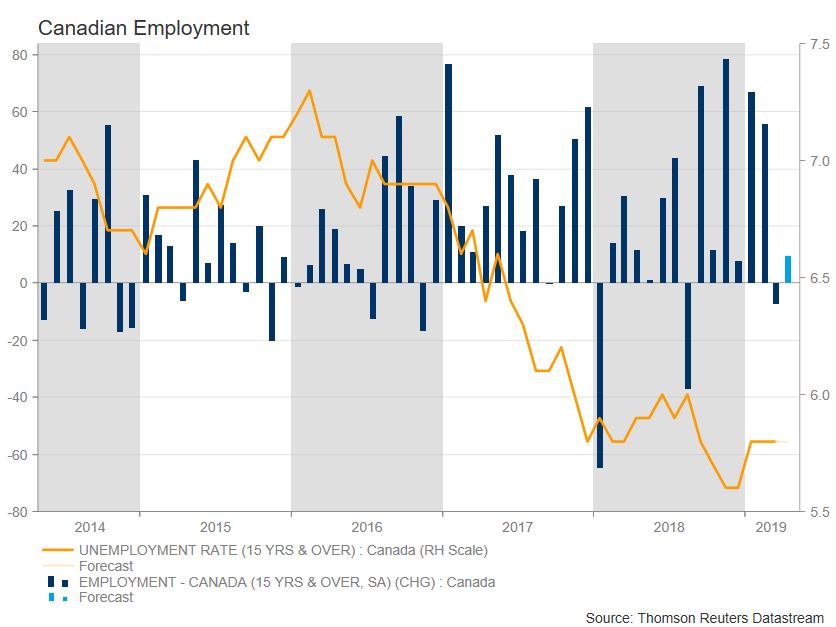
Consensus is for the unemployment rate to hold at 5.8%, which is the highest level since October while the net change in employment is expected to show that the economy added 10,000 jobs from an unexpected drop of 7,200 jobs in March, its first decline in seven months. However, the participation rate is expected to remain the same at 65.7% as the preceding month, so there could be some gains ahead for the loonie if wage growth and employment numbers show some improvement in the labour market. After a surprisingly weak print in March, the labor market is waiting for a modest rebound in these readings.
The Bank of Canada (BoC) left its interest rates unchanged at 1.75% on April 24, as widely expected, which is the highest rate since December 2008 but avoided to signal any need for future hikes and lowered its growth forecast for this year. The Bank, which has increased interest rates five times since July 2017, mentioned that it expects growth to advance in the second half of the year, as housing activity stabilizes and consumer spending is underpinned by growth in employment income.
On May 6, the Bank of Canada’s Governor Stephen Poloz in a speech in Winnipeg was optimistic for the growth in the housing market despite various challenges and referred that a supple mortgage market would support the nation for creating a better financial system.
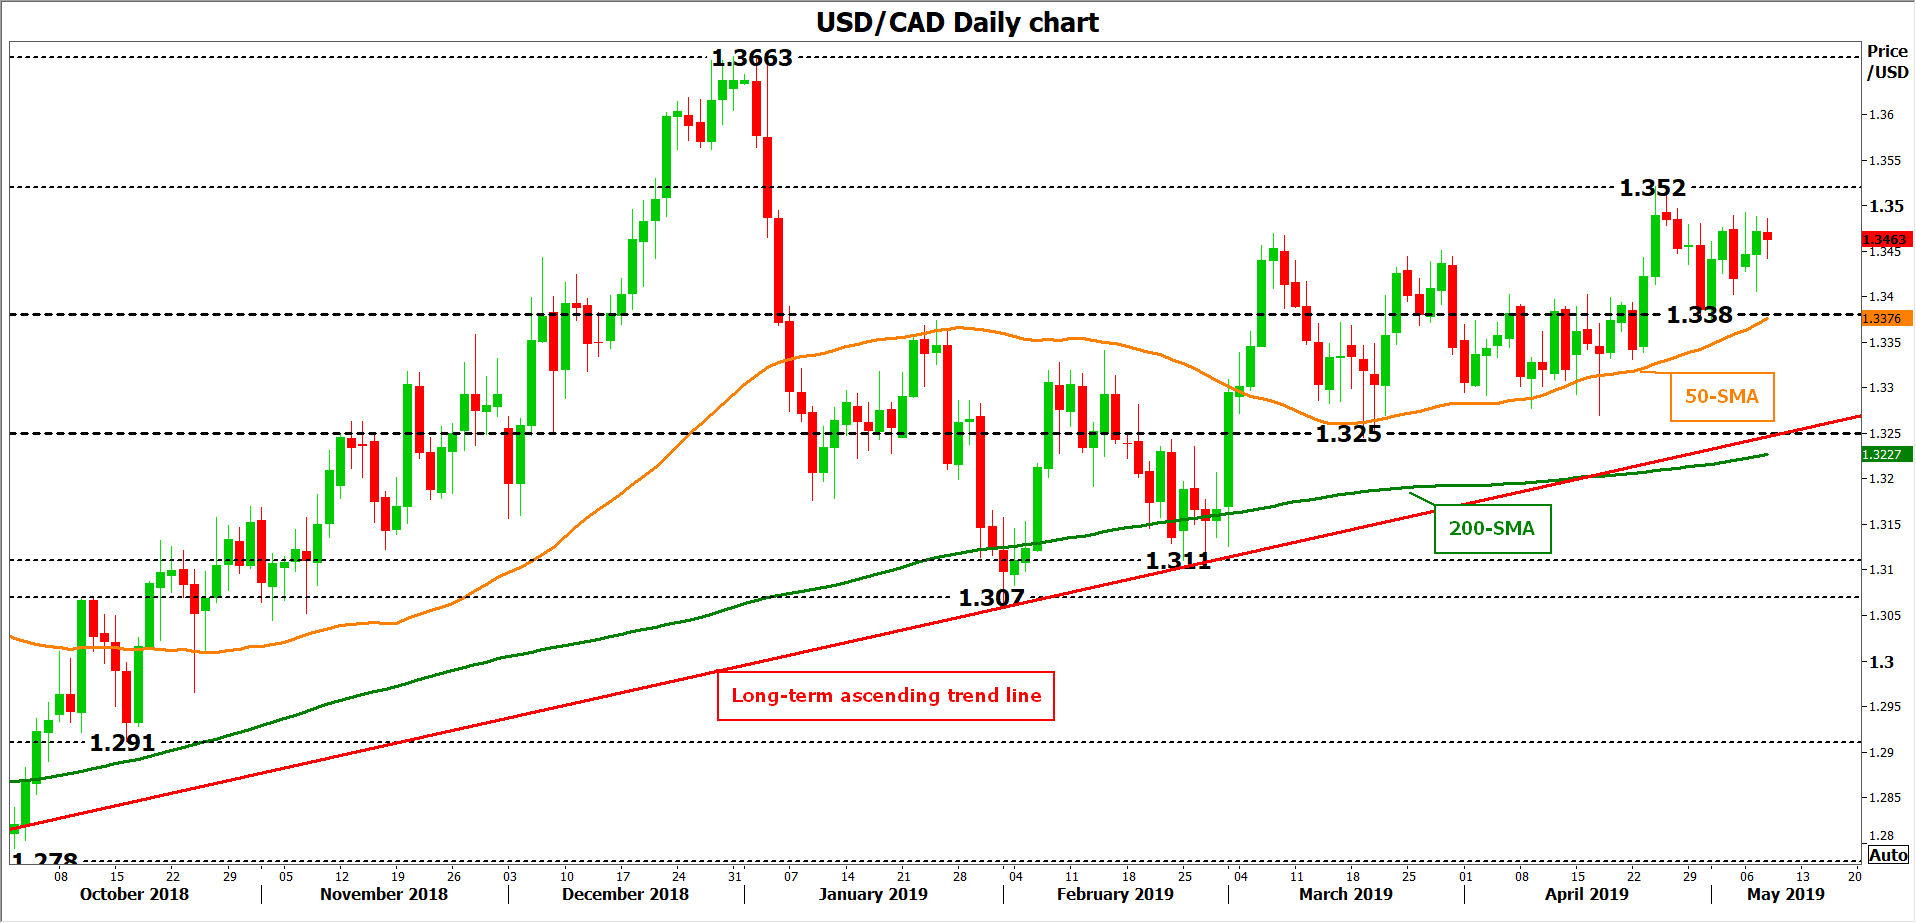
Turning to market reaction, the Canadian dollar has been losing considerable ground against the dollar since the beginning of the year, helping USDCAD to touch a three-month high of 1.3520. However, a weaker-than-predicted jobs report on Friday, could reduce chances for a rate hike and drive USDCAD to test the 19-month high of 1.3663, identified by the peaks on December 31.
Alternatively, if the employment report shows growth or/and the unemployment rate shifts lower, the pair could return to the 1.3380 support area, around the 50-day simple moving average (SMA), while steeper declines could also revisit the long-term ascending trend line, which has been holding since January 2018.
Chinese Yuan in free fall, Shanghai SSE declines on US-China trade war
Chinese investors are apparently preparing for the worse in the trade talks in Washington. Expectations is rather low for Vice Premier Liu He. Whether he could save the trade deal or not, it looks like new round of tariffs will take effect tomorrow in either case. Trump's hard line rhetoric, vowing not to back down, is an indication. White House Press Secretary Sanders also noted the administration is full prepared for stock market reactions.
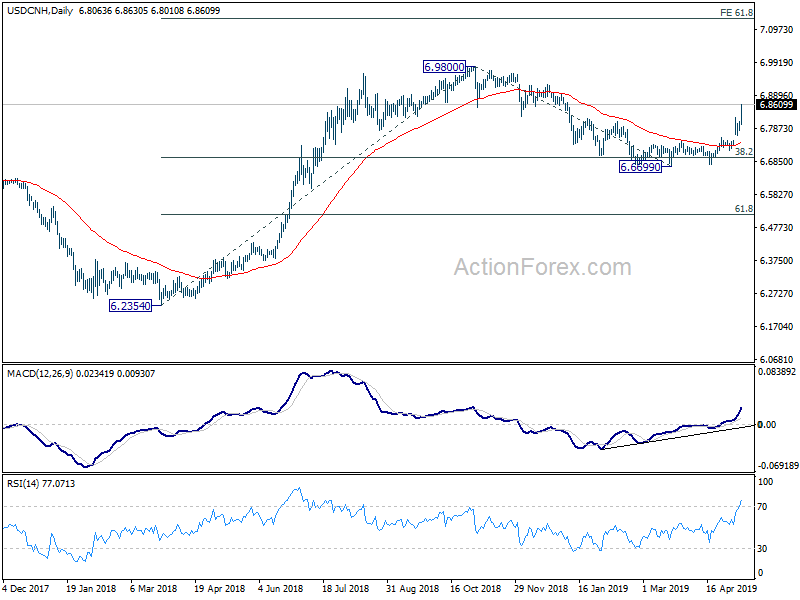
Rally in USD/CNH (off shore Yuan) accelerates sharply higher today, as Yuan is in free fall. The development further confirms that corrective pattern from 6.9800 has completed at 0.6699 after hitting 38.2% retracement of 6.2354 to 6.9800. Further rise should be seen to retest this 6.9800 high, as well as psychologically important 7 handle. Should trader war worsens, and barring any government intervention, USD/CNH should take out 6.9800 with relative ease. Next target will be 61.8% projection of 6.2354 to 6.9800 from 6.6699 at 7.1301.
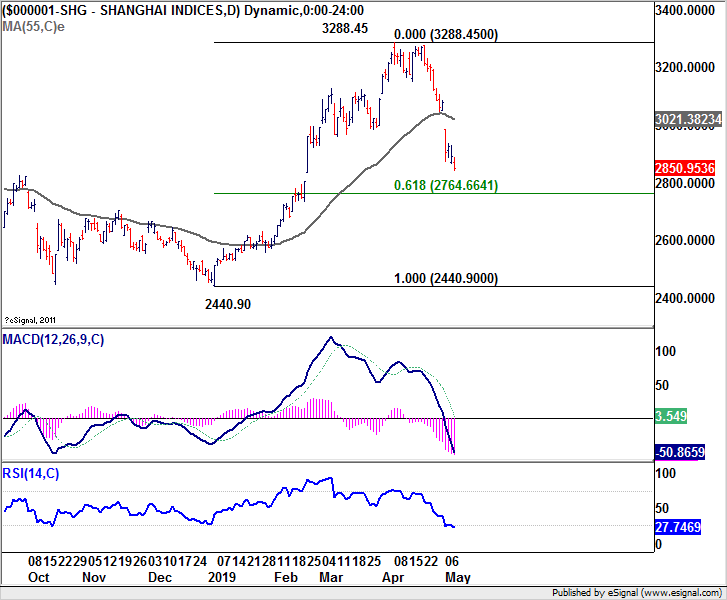
Shanghai SSSE closed down -1.48% at 2850.95 today as fall from 3288.45 extends. For now, we're just seeing such decline as at corrective move. Still, SSE will likely drop through 61.8% retracement of 2440.90 to 3288.45 at 2764.66 before slowing down.
EUR/USD Mid-Day Outlook
Daily Pivots: (S1) 1.1179; (P) 1.1196 (R1) 1.1210; More.....
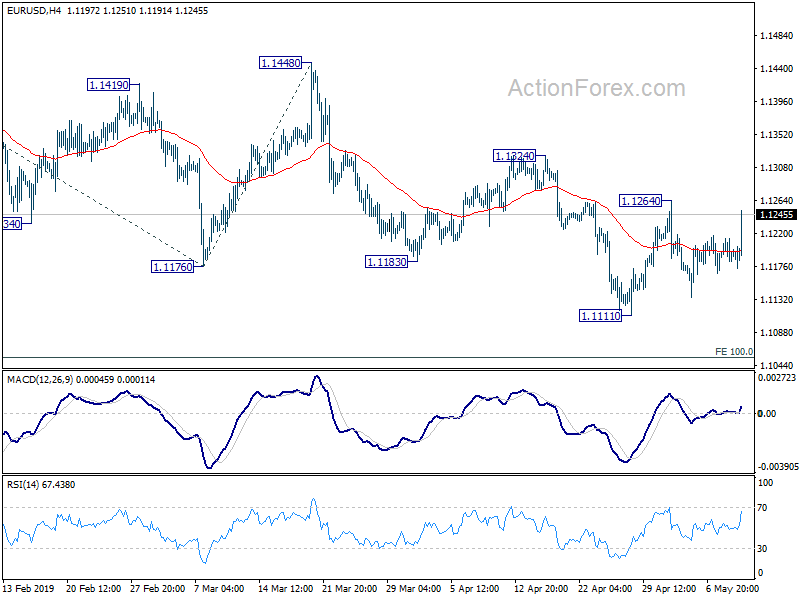
EUR/USD's strong rise today suggests that corrective rebound from 1.1111 might extend higher. But still, outlook will remain bearish as long as 1.1324 resistance holds. Larger down trend is expected to resume sooner or later. On the downside, break of 1.1111 low will target 100% projection of 1.1569 to 1.1176 from 1.1448 at 1.1105 next. However, firm break of 1.1324 will be an early sign of larger trend reversal. In such case, further rise would be seen back to 1.1448 resistance for confirmation.
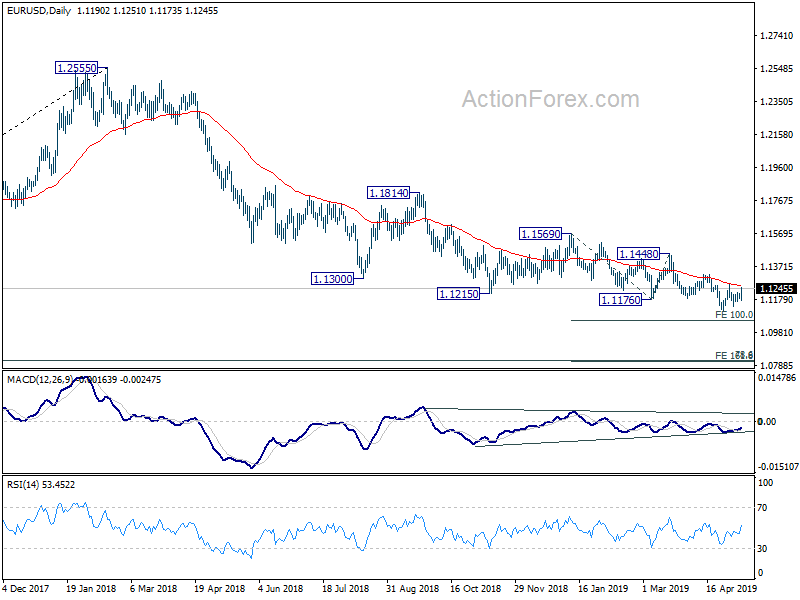
In the bigger picture, down trend from 1.2555 (2018 high) is still in progress. Current fall should now target 78.6% retracement of 1.0339 (2016 low) to 1.2555 (2018 high) at 1.0813. Sustained break there will pave the way to retest 1.0339. On the downside, break of 1.1448 resistance is needed to be the first sign of medium term bottoming. Otherwise, outlook will stay bearish in case of rebound.
GBP/USD Mid-Day Outlook
Daily Pivots: (S1) 1.2970; (P) 1.3025; (R1) 1.3064; More...
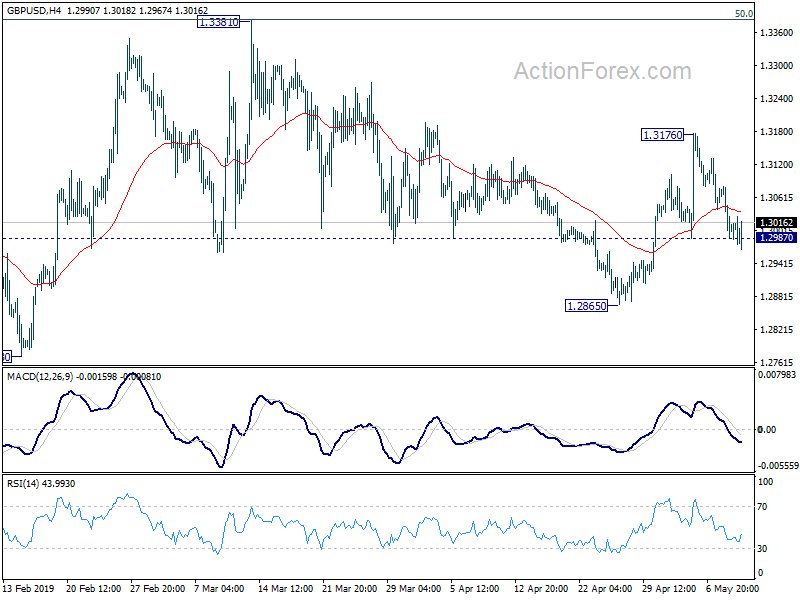
No change in GBP/USD's outlook and focus remains on 1.2987 support. Decisive break there will confirm that rebound from 1.2865 has completed at 1.3176 already. More importantly, this will revive that bearish case that rebound from 1.2391 has completed at 1.3381. And intraday bias will be turned to the downside for 1.2865 support for confirming bearishness. Nevertheless, on upside, above 1.3176 will target a retest on 1.3381 high next.
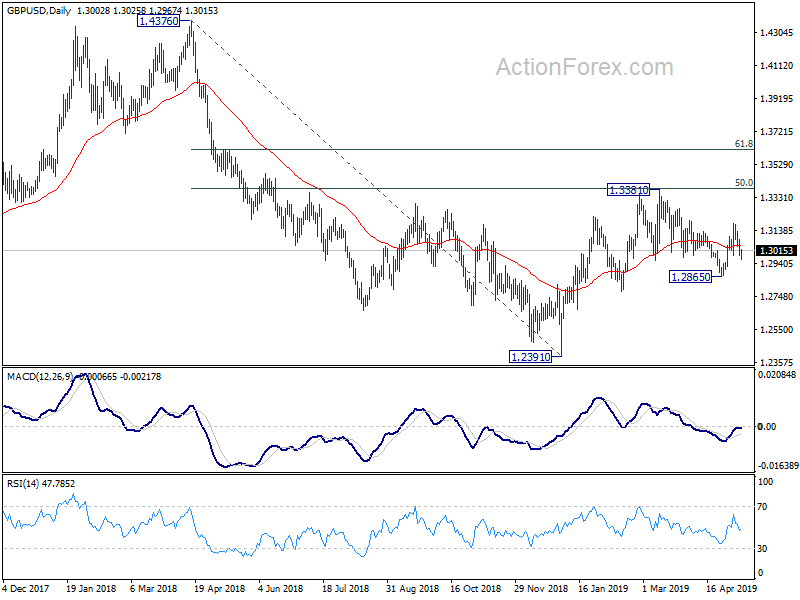
In the bigger picture, medium term decline from 1.4376 (2018 high) halted and made a medium term bottom after hitting 1.2391. Rebound from 1.2391 is seen as a corrective move for now. In case of another rise, strong resistance could be seen around 61.8% retracement of 1.4376 to 1.2391 at 1.3618 to limit upside. On the downside, break of 1.2773 support will suggests that such corrective rise is completed and bring retest of 1.2391 low first.
USD/CHF Mid-Day Outlook
Daily Pivots: (S1) 1.0178; (P) 1.0194; (R1) 1.0219; More.....
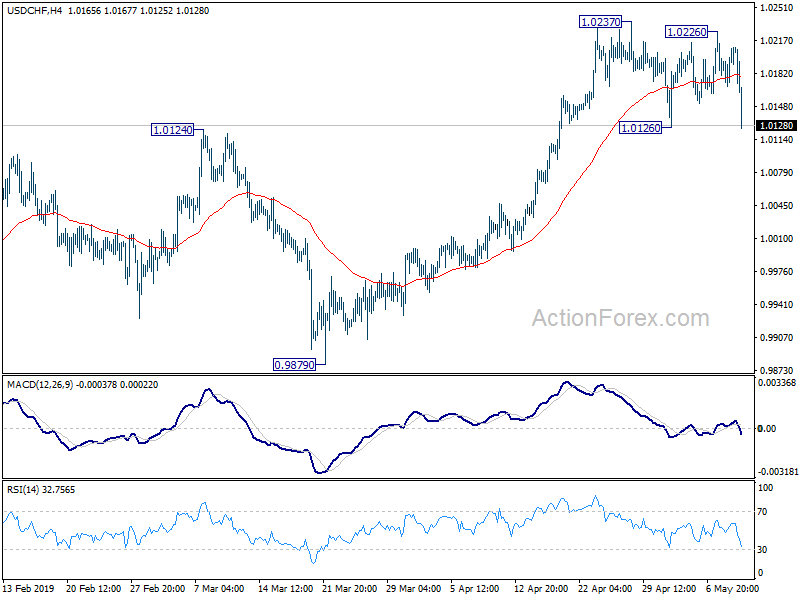
USD/CHF's consolidation from 1.0237 extends further with a steep decline today. But intraday bias will remain neutral first. On the downside, break of 1.0126 might bring deeper fall to 55 day EMA (now at 1.0078). But downside should be contained there to bring rebound. On the upside, break of 1.0237 will resume larger rise from 0.9186 to 1.0342 key resistance.
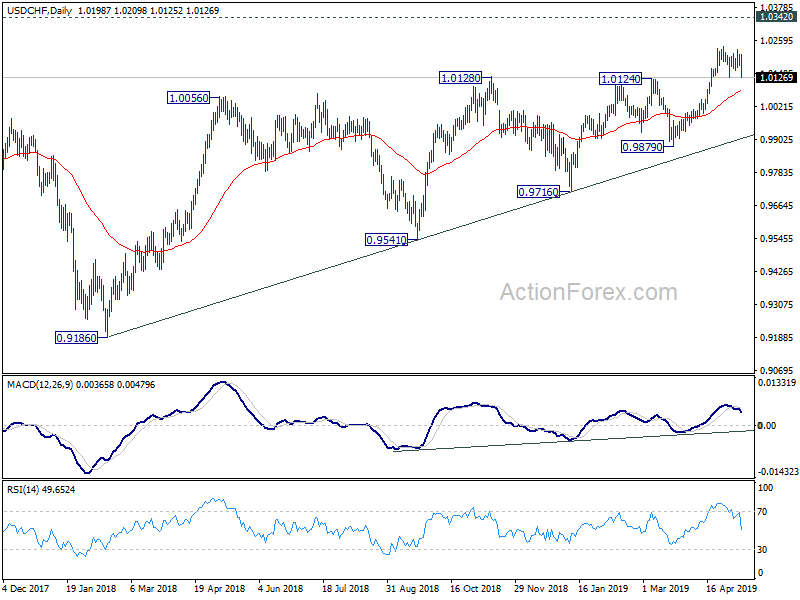
In the bigger picture, medium term up trend from 0.9186 is extending. Current rise should target 1.0342 resistance next. For now, we'd be cautious on strong resistance from there to limit upside, until we see medium term upside acceleration. On the downside, break of 0.9879 support is needed to indicate reversal. Otherwise, outlook will stay bullish in case of deep pull back.
US: Trade Deficit Widens in March as Imports Continue to Recover
- The U.S. trade deficit widened to $50 billion in March from $49.3 billion in February, broadly in line with consensus expectations.
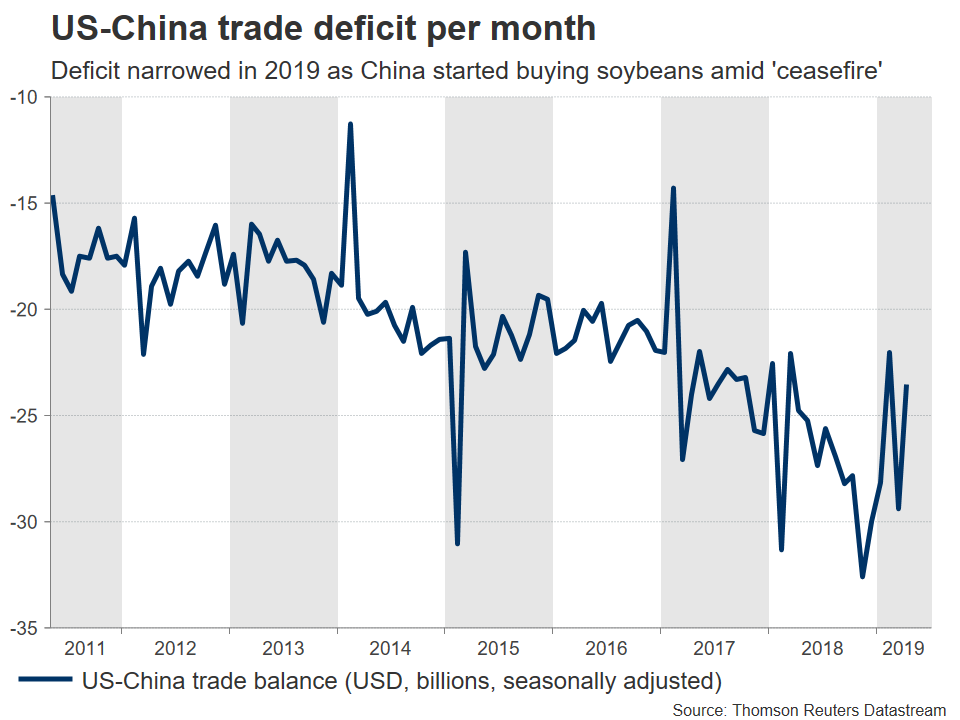
- The trade deficit widened across most major trading partners barring China and Japan. The deficit with China has narrowed over the first quarter of 2019, reversing, at least for now, a long-running trend.
- Nominal exports advanced 1.0% m/m. Agricultural products and industrial supplies and materials fueled the increase. Soybeans exports continued to spike in March, growing by 39% m/m.
- Imports expanded by 1.1% on the back of strong gains by the same categories boosting exports. Agricultural imports picked up by 8.5%, the strongest rate since March 2014, while industrial supplies imports grew by 5.6% following six straight months of contractions.
- Nominal services exports was a tad weak in March, increasing by 0.1% m/m. On the other hand, services imports grew by 0.5% rebounding from weakness in the early parts of Q1.
- On the real side, goods exports and imports both posted solid increases of 0.7% m/m.
Key Implications
- Trade deficits are here to stay. Despite the enactment of tariffs, the trade deficit has continued to widen. This highlights two realities: First, even with tariff-induced price increases, imports continue to be driven by robust domestic demand; second, imports cannot be easily substituted by domestic production. In some cases, there may be no direct domestic substitutes and even where there are, global supply chains take a long time to reorganize.
- Even as the overall trade deficit is unlikely to improve due to tariffs, bilateral balances may. Given the special attention the trade deficit with China receives, its narrowing is, perhaps, a good omen for the next round of China-U.S. trade negotiations that is set to kick off tomorrow. Still, with China backtracking on previous commitments and the U.S. administration moving forward on its threat to up tariffs on $200 billion of Chinese imports from 10% to 25%, there is considerably more uncertainty on when a deal will be reached, reversing much of the hopeful optimism present earlier this year.
Canadian International Trade Springs Back to Life in March
- Canada posted a $3.2 billion trade deficit in March, down from a revised $3.4 billion deficit in February (previously reported as $2.9 billion). This was higher than consensus estimates for a $2.4 billion deficit. Exports advanced 3.2% to $49 billion, while imports rose 2.5% to $52 billion.
- After accounting for price changes, the picture was encouraging. Export volumes accounted for a large chunk of the increase, up 2.6%. Import volumes were up 1.3%.
- Exports saw a relatively broad-based rebound, increasing in 9 out of the 11 broad categories. Nominal energy exports were up 7.7%, with crude oil volumes posting an encouraging 3.1% gain (+5% in nominal terms) after slumping in February. Excluding energy products, exports were up 2.1%. Other categories that contributed to the rebound include motor vehicles and parts (+5.6%), and basic and industrial chemical products (+7.9%). Metal ores and non-metallic minerals (-8.1%) and metal and non-metallic mineral products (-3.7%) provided some offset.
- The increase in imports was also relatively broad-based, spanning 8 of the 11 categories. Particularly notable was a strong increase in imports of consumer goods (+6.7%), motor vehicles and parts (+4.9%), and industrial machinery and equipment (+2%). Imports of energy products also increased 4%. Providing some offset was a large drop in the volatile aircraft and other transportation equipment category (-20%), after strong climbs in the prior months.
- Canada's merchandise trade surplus with the U.S. grew to $3.6 billion, but its merchandise trade deficit with the rest of the world widened to a record $6.8 billion.
Key Implications
- Canadian international trade finally bounced back to life in March with a healthy export volumes print. Additionally, the rebound in consumer-related and M&E imports is a positive sign for domestic demand. Of course, one month of data doesn't make a trend, and the fly in the ointment in this report is a substantial downward revision to the prior month's data. On the whole, export volumes were still down a significant 2.4% in the first quarter.
- The positive report offers a decent and encouraging handoff to the second quarter. For Q1, however, the release leaves our GDP tracking unchanged near 0.6%, largely due to the downward revisions for the prior month. The key message remains that the Canadian economy has hit a soft patch in the first quarter of 2019.
Better Weather Leaves (Somewhat) Better March Canadian Trade Numbers
- The nominal trade balance improved for a third straight month but was still at an elevated $3.2 billion in March
- Details were somewhat better – export volumes bounced 2.8% after falling 4.6% in February. Import volumes of machinery and equipment bounced back after a disappointing February decline.
The headline trade deficit was still elevated at $3.2 billion but edged lower for a third straight month in March. Details were arguably a little better than that headline itself would imply. A 2.8% bounce-back in export volumes in part reflected a recovery in energy shipments but non-energy export volumes were also up almost 2% by our count. Import volumes also bounced back 1.2%. While not helping with the trade deficit, the composition of that increase – led by a partial recovery in equipment imports from a big drop in February – does seemingly confirm that domestic demand is holding up okay outside of the energy sector.
Bad weather likely had a significant negative impact on transportation capacity in February, and likely was to blame for at least part of what was an ugly-looking drop in trade flows in that month. The bounce-back in March adds to the evidence that the February weakness was more head-fake than a new-trend. Yet, the underlying trade backdrop still looks unspectacular. Non-energy exports were still down from a year ago in March. The U.S. industrial sector, a key customer for Canadian exports, continues to grow but renewed saber-rattling in the U.S.-China trade dispute is still contributing to uncertainty around the future of global trading relationships – with the potential to disrupt Canadian supply chains. The data will do nothing to change the Bank of Canada’s view that further interest rate hikes are not needed at the moment.