Sample Category Title
Market Morning Briefing: Aussie Seems To Be Trading Sideways Above 0.70
STOCKS
Short-covering on equities as the US-China talk is underway. The global equities have room on the upside but the bigger picture favors further fall going forward. We will have to wait to know the outcome of the trade talks which could set the trend for next week.
Dow (25828.36, -138.97, -0.54%) has recovered sharply from its low of of 25517.39. It can test 26000, but need to see if the Dow can make a strong close above it for the week today. However, while below 26250 the outlook is bearish to break 25500 and test 25000.
DAX (11973.92, -206.01, -1.69%) is bearish and has been declining in line with our expectation. A test 11900-11850 is likely after which a bounce-back move is possible.
Nikkei (21576.17, +174.04, +0.8%) has key resistances at 21750 and 22000 which can cap the current bounce and trigger a fall in the short term.
Shanghai (2921.88, +70.93, +2.49) can test 2950-2970 while it remains above 2900.
Sensex (37558.91, -230.22, -0.61%) and Nifty (11301.80, -57.65, -0.51%) might see some short-covering rally to 38000-38300 and 11400-11450 respectively before the overall downtrend resumes.
COMMODITIES
Gold remains stable within its sideways range. Copper has bounced and can move further up before reversing lower again. Oil can see an interim bounce before resuming its overall downtrend.
Gold (1285.1) remains stable above 1280 for now within its 1266-1292 sideways range. While below 1298, the outlook is bearish for a fall to 1270-1260
As expected Silver (14.81) fell to 14.70. Though it has bounced, a dip to 14.60 is possible in the coming sessions.
Copper(2.79) has bounced sharply from near 2.73. While above 2.76, an interim rise to 2.82 and 2.85 is possible. But the bigger picture remains bearish for a fall to 2.70-2.68
WTI (62.45) may see a rise to 63-64 in the near term while to holds above 62. Need to watch if it has surpass 64 or not. We expect it to turn down again from 64.
Similarly, Brent (70.29) can test 71.5 in the coming sessions and can see a pull-back to 69-68 from there.
FOREX
US-Trade talks are to continue today also with the tariff on $200 bln goods to be implemented today after 12:01 am ET. However, there is some hope that both countries would get into a deal, the imposition of tariffs could bring in some volatility in the second half of today’s session.
USDCNY (6.8052) has fallen despite the trade talks and the looming trade tariffs on the Chinese imports. However, the charts suggest important resistance at 6.85 on the upside which could hold in the medium term bringing in some corrective dips over the next 1-2 sessions.
Dollar Index (97.38) has dipped a bit but is expected to trade above 97 in the near term. While the index sustains trade above 97, there could be chances of a rise back towards 98 or higher.
Euro (1.1228) has risen slightly but could see near term range trade within 1.1225-1.1150 as seen on the daily candles.
The Euro-Yen (123.43) has scope of testing 122 on the downside while below 124. Only on a sustained rise above 124, we may expect near term to turn bullish.
Dollar Yen (109.91) tested 109.47 yesterday before trading slightly higher today. It would be important to see if 109.50-109.00 holds well and is able to produce a decent bounce back towards 110 or higher. 109 would be crucial decider of medium term direction. While 109 holds, chances of testing 110.0-110.5 remains intact.
Aussie (0.70) seems to be trading sideways above 0.70 and while that sustains, the currency could move up towards 0.7050-0.7100 in the coming sessions. Downside extension to 0.69 is not fully negated and would come into the picture if Aussie breaks below 0.70. Preference is for a ranged movement above 0.70 just now.
Dollar-Rupee (69.95) has tested a high of 70.24 on the offshore NDF yesterday and that could be reflected on a possible OTC opening above 70 today. While we keep chances of 70.30 intact note that it is an important near term resistance and could hold pushing Dollar Rupee down from there back towards 69.80. Only on a break above 70.30, we would look at a test of higher resistance near 70.50/60. Repeat: 70.30 and 70.50/60 would be crucial levels to watch in the near term that would decide further direction of the currency pair going forward.
INTEREST RATES
The US 30-5Yr (0.61%0 has some scope of moving down towards 0.50% and while that falls the 30YR could start falling, pulling along the other yields of shorter time frame. The 30Yr (2.88%), 10Yr (2.46%) and 5Yr (2.27%) are almost stable just now. But we could soon see a sharp fall coming in for the US yields in the near term. Preference is for a fresh fall to be seen in the US yields next week.
The Japan yields have mode up. The 10Yr (-0.04%) and 30YR (0.54%) have risen from -0.04% and 0.537% respectively and look bullish for the near term.
The US-JGB 10Yr (2.50%) has fallen but could see a small temporary corrective bounce from here. Although the spread looks bearish for the medium term towards 2.45%, immediate bounce looks possible that could hold for a few sessions before giving way.
The German yields have dipped as expected. The 5Yr (-0.472%), 10Yr (-0.047%) and the 30YR (0.599%) are down from -0.46%, -0.043% and 0.602% seen previously. Near term looks bearish for the German yields as the 5Yr, 10Yr and the 30Yr could target -0.48%, -0.07% and 0.57% respectively as mentioned yesterday.
The German-JGB 10Yr (-0.01%) has fallen as expected and could now test -0.5% before pausing or rising back from there.
The UK yields are also falling and look bearish in the coming sessions. The 5YR (0.82%), 10Yr (1.13%0) and the 20Yr (1.58%) are down by 1bps and could fall towards 0.75%, 1% and 1.50% respectively. This could indicate a fall in Pound too in the near term.
The Indian 10Yr GOI (7.4937%) is stuck in the 7.45-7.50% region just now and is unable to break below 7.45% to move towards lower support near 7.40%. We need to keep a close watch to see if it break above 7.50/55% to turn towards upside for the early sessions next week.
Chinese VP Liu wrapped first day of negotiation with a smile as new tariffs will start shortly
Chinese Vice Premier Liu He wrapped his first day of meeting with US Trade Representative Robert Lighthizer and Treasury Secretary Steven Mnuchin. After 90 minutes meeting in the USTR office, they had a dinner together. Ahead of the meeting, Liu said: “We come here this time, under pressure, which shows China’s greatest sincerity, and want to sincerely, confidently, and rationally resolve certain disagreements or differences facing China and the United States. I think there is hope,”
Trump said he got a "beautiful letter" from Chinese President Xi Jinping and they' "probably" speak by phone. Trump reiterated his hard line and said “Our alternative is an excellent one, it’s an alternative I've spoken about for years. We’ve taken well over $100 billion from China in a year.”
For now, no phone call has been made yet, nor scheduled. White House just noted that the negotiations will continue on Friday morning in Washington. Meanwhile, the tariffs on USD 200B of Chinese imports will be raised from 10% to 25% at 12:01am EDT (0401 GMT) today. China's retaliations are expected to follow soon. And, the US has also started the paperwork to impose 25% tariffs on extra USD 325B in untaxed Chinese goods.
USD/JPY Daily Chart Suggests Crucial Downside Break
Key Highlights
- The US Dollar declined sharply after it was rejected above 112.00 against the Japanese Yen.
- USD/JPY traded below a crucial bullish trend line with support at 111.05 on the daily chart.
- The US PPI in April 2019 increased 2.2% (YoY), less than the +2.3% forecast.
- The US CPI in April 2019 could rise 2.1% (YoY), up from than the last +1.9%.
USDJPY Technical Analysis
This past month, the US Dollar climbed above the key 112.00 resistance against the Japanese Yen. The USD/JPY pair failed to hold gains above 112.00, topped at 112.39, and recently declined below 110.00.
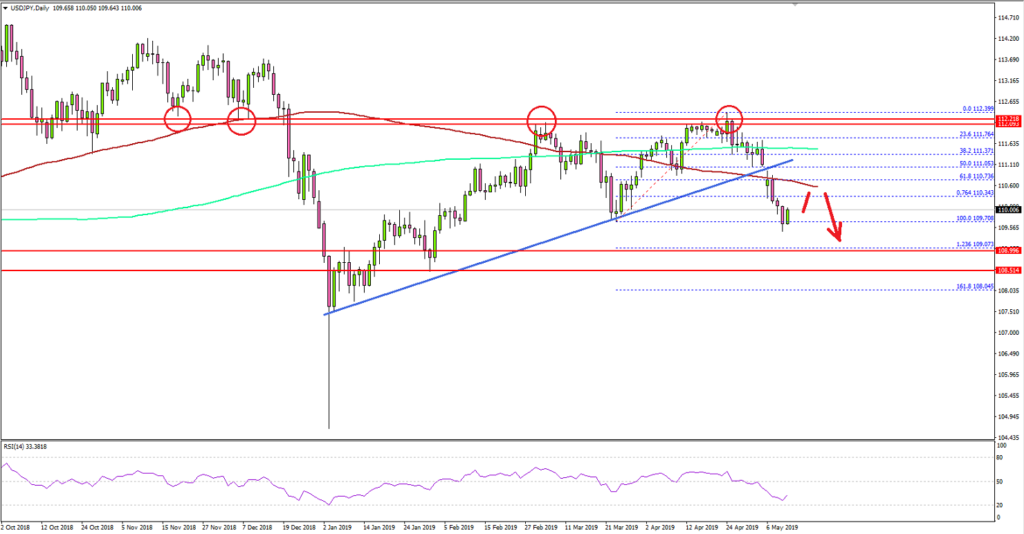
Looking at the daily chart, the pair started a major decline after it was rejected above 112.00 and 112.20. It traded below many supports such as 111.80, 111.50 and 111.00.
During the drop, there was a break below a crucial bullish trend line with support at 111.05. The pair even broke 110.80, the 100-day simple moving average (red), and the 200-day simple moving average (green).
Recently, the pair traded below the 76.4% Fib retracement level of the upward move from the 109.70 swing to 112.39 high. It opened the doors for more losses and the pair spiked below the 109.70 low.
It seems like the pair moved into a strong downtrend below 110.80 and the 100-day SMA. Therefore, there is a risk of further downsides towards the 109.00 level or the 1.236 Fib extension level of the upward move from the 109.70 swing to 112.39 high.
On the upside, the previous supports near 110.80, 100-day SMA, and the 111.00 pivot level are likely to prevent gains if the pair starts a rebound in the near term.
Fundamentally, the US Producer Price Index for April 2019 was released by the Bureau of Labor statistics, Department of Labor. The market was looking for a 2.3% rise in the PPI, compared with the same month a year ago.
However, the actual result was below the forecast, as the UP PPI increased 2.2%, similar to the last reading. Looking at the monthly change, it came in at 0.2%, similar to the forecast, but down from the last 0.6%.
The report added:
The index for final demand less foods, energy, and trade services moved up 0.4 percent in April, the largest increase since rising 0.5 percent in January 2018. For the 12 months ended in April, prices for final demand less foods, energy, and trade services advanced 2.2 percent.
Overall, GBP/USD declined recently below 1.3050, EUR/USD remained below the key 1.1250 resistance, and USD/JPY remains at a risk of more downsides in the coming days.
Economic Releases to Watch Today
- UK Industrial Production for March 2019 (MoM) – Forecast +0.1%, versus +0.6% previous.
- UK Manufacturing Production for March 2019 (MoM) – Forecast +0.2%, versus +0.9% previous.
- UK GDP for Q1 2019 (Preliminary) (QoQ) – Forecast +0.5%, versus +0.2% previous.
- US Consumer Price Index April 2019 (MoM) – Forecast +0.4%, versus +0.4% previous.
- US Consumer Price Index April 2019 (YoY) – Forecast +2.1%, versus +1.9% previous.
- US Consumer Price Index Ex Food & Energy April 2019 (YoY) – Forecast +2.1%, versus +2.0% previous.
- Canada’s Net Employment Change April 2019 – Forecast 10K, versus -7.2K previous.
- Canada’s Unemployment Rate April 2019 – Forecast 5.8%, versus 5.8% previous.
Daily Markets Broadcast
Wall Street pressured as tariff deadline nears
US indices extended recent declines, as uncertainty surrounding today’s tariff deadline took hold. Will Trump pull the trigger and raise tariffs from 10% to 25% on Chinese goods? China shares have suffered more than Wall Street under the threat.
US30USD Daily Chart
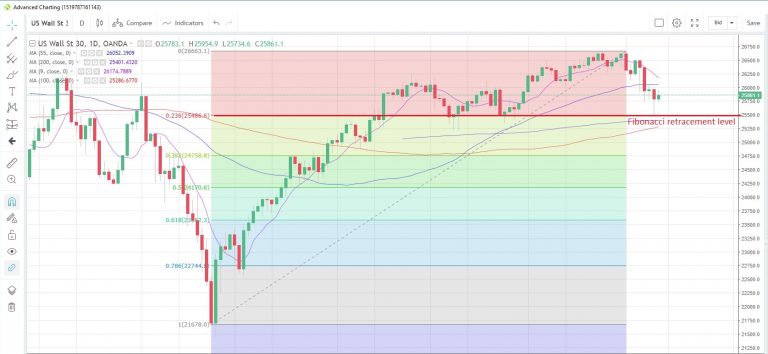
The US30 index fell to the lowest level since March 27 as a lack of news on the trade negotiation front exacerbated weakness from the tariff deadline
The decline stalled at the 23.6% Fibonacci retracement of the December-May rally at 25,486. The index rebounded into the close but still ended in the red
US consumer prices probably rose at a marginally faster pace of 2.1% y/y in April, from +1.9% in March. Speeches from Fed’s Brainard and Bostic are scheduled, but will no doubt be overshadowed by developments after the tariff deadline.
DE30EUR Daily Chart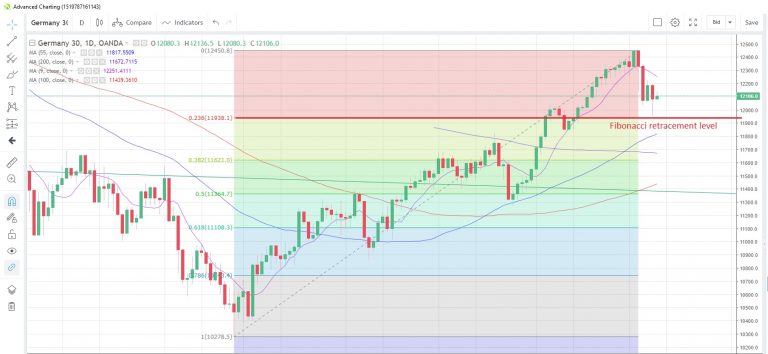
The Germany30 index fell yesterday, touching the lowest in almost a month as pressure on Wall Street intensified
The index is still holding above the 23.6% Fibonacci retracement of the rally since December at 11,938
Germany’s March trade data are due today and are expected to show a narrowing of the trade surplus to EUR18.2 billion from EUR18.7 billion. ECB’s Lautenschlaeger is scheduled to speak.
CN50USD Daily Chart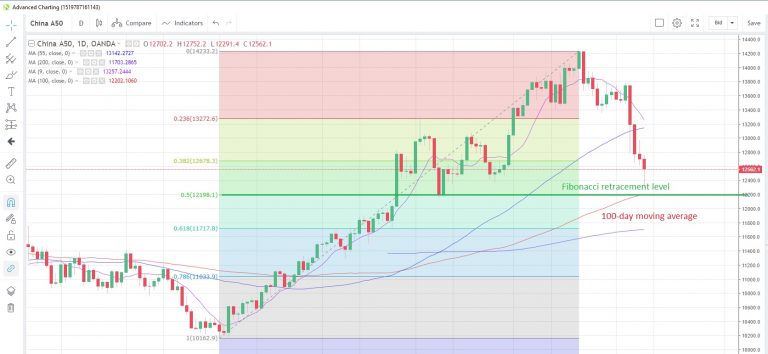
The China50 index fell for a fourth straight day yesterday amid fears of a trade war escalation after the tariff deadline tonight
The index dropped to a two-month low but halted the decline near the convergence area of the 100-day moving average at 12,202 and the 50% retracement level of the 2019 rally at 12,198
China publishes new loans data for April today with a bumper total of 1.2 trillion yuan ($175 billion) expected. This would bring the year-to-date total to more than 7 trillion yuan ($1.02 trillion), a serious injection of liquidity into the corporate world.
USDCHF Weakens On Price Sell Off With Eyes On 1.0100
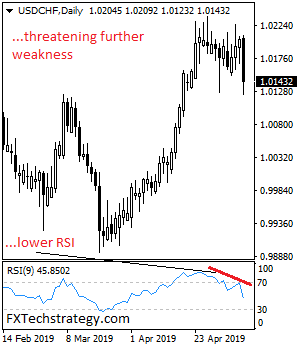
USDCHF weakens on price sell off with eyes on 1.0100 support level. On the downside, support is seen at the 1.0100 level. A turn below here will set the stage for more decline towards the 1.0050 level. And then the 1.0000 level. Further down, support resides at the 0.9950 level. Its daily RSI is bearish and pointing lower suggesting further weakness. On the upside, resistance resides at the 1.0200 level. Above here, resistance lies at the 1.0250 level and then the 1.0300 level. Further out, resistance comes in at the 1.0350 level. All in all, USDCHF continues to eye further downside pressure towards the 1.0100 support level
Beautiful Minds And The Sword Of Trump-Ocles
Beautiful minds and the sword of Trump-ocles
The markets were down but not out overnight as President Trump stabilised them somewhat by saying he had received a “beautiful letter” from Chinese President Xi Jinping urging them to work together. It was well timed, of course, arriving by the diplomatic carrier pigeon as the trade talks got underway in Washington DC. One struggles though, to see how either of these two presidents will ever manage to really share the toys and play nicely on the global stage.
The Sword of Trump-ocles hangs over the global markets with tariffs increases commencing at 00:01 EDT as the clock rolls over into Saturday. It leaves both negotiating teams precious little time to come up with something that satisfies both sides. The markets themselves appear to have settled into a cautious wait-and-see mode, but the peace is fragile, and it won’t take much today to panic investors into heading for the exit door en masse.
The Reserve Bank of Australia Statement on Monetary Policy and Singapore and Malaysia retail sales should have been the regions data highlights today. Unfortunately, they will be subsumed and forgotten as investors man the trade-war battlements, hoping dawn is coming. Apart from China itself, high beta markets such as Australia, Taiwan and South Korea are among the most vulnerable to a breakdown in negotiations. Japan has been benefiting from safe-haven flows as Japanese investors repatriate and wait for the dust to settle.
Currencies
The dollar gently eased against its G10 counterparts overnight but continued to march higher against emerging market currencies. Given the exposure to a global slowdown in trade by emerging markets generally, this shouldn’t be a surprise. The dollar and the US10-year bond should remain the destination of choice for global investors seeking safe harbour as the tariff deadline nears. Expect any dips in the greenback to be met with buyers. This is also a theme that will continue through 2019 as the high-yielding developed market carry trades of choice.
The Japanese yen (JPY) is also a major beneficiary of safe-haven inflows and rallied further against the dollar overnight, with USD/JPY falling to 109.80. A trade-talk breakdown should see the yen continue to rally, most notably against regional currencies such as the Korean won (KRW), Australian dollar AUD) and Chinese offshore renminbi (CNH).
Equities
Wall Street followed Asia and Europe lower overnight but managed to pare its losses after President Trump’s “beautiful letter”. The S&P 500 fell 0.30%, the Nasdaq was down 0.41%, and the Dow Jones dropped 0.54%. Not a bad performance overall, given the rout in China this week.
We expect Asian equities to open nervously lower following Wall Street’s cautious lead. Regional markets have always been vulnerable to a drop in global trade in their role as the workshop of the world. Today they will be especially so and any reactions to trade headlines – either positive or negative – should see outsized, rapid moves either way.
Oil
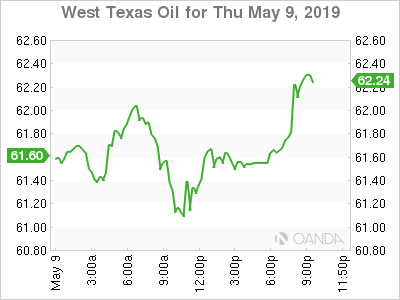
Oil continues to doggedly hold on to some of its hard-won gains of the last month, but a trade talk failure would be the straw that breaks the camel’s back, for obvious reasons. Faced with the sword of Trump-ocles hanging above, the black gold put on a brave face, but eased lower. Brent Crude fell 0.36% to USD70.10 a barrel, while WTI fell 0.90% to USD61.60 a barrel.
Trading in Asia will be muted as energy markets adopt a wait-and-hide attitude. Like equities, oil will see outsized price reactions – up or down – to trade talk headlines, both good and bad. It’s a cliché, I know, but particularly today, traders need to be as nimble as trade negotiators.
Gold
Gold carved out a 0.22% gain to USD1,284.00 overnight in another underwhelming performance by the supposedly safe-haven port of choice. Risk-aversion into Big Friday, and ahead of the weekend, should be supportive of gold today in Asia.
However, its inability to rally, as the dollar and US yields eased slightly overnight, increases concern about its medium-term price action. Gold may be vulnerable to positive headlines coming from Washington if they spur traders to rotate out of safe havens.
USD/CAD Canadian Dollar Rises As Trade War Triggers Dollar Selloff
The Canadian dollar is slightly higher against the US dollar on Thursday after trade uncertainty and a soft dollar. The loonie got little support from a reduction of the trade deficit in March. Exports grew, specially oil as Canadian energy product rose 7.7 percent.
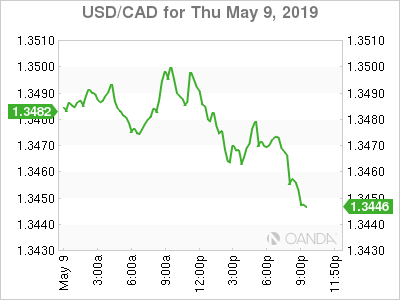
The loonie will be caught between Canadian employment data and US-China trade developments to close out the trading week. Jobs are expected to rebound from last month, and maintain the unemployment rate at 5.8 percent. The data won’t be enough to get the Bank of Canada (BoC) out of its dovish funk as macro headwinds will continue to put pressure on the Canadian economy.
The US dollar is lower against major pairs on Thursday after US President Donald Trump showed some hope a deal with China is still possible ahead of its meeting with the Chinese negotiators. The dollar was sold across the board as US inflation indicators showed no immediate pressure giving the Fed no reason to raise interest rates.
The Fed hit the brakes hard in January after lifting rates four times in 2018. The Fed has removed a rate hike from its dot plot and will be patiently awaiting significant improvement before it reassumes its tightening of monetary policy.
Safe haven currencies lead the pack moving against the dollar. The Swiss franc rose 0.51 percent and the Japanese yen 0.33 percent as investors awaited the outcome of the trade talks with high uncertainty given the various statements.
Oil prices retreated as a possible trade war will reduce energy demand while gold rose as the appeal of the metal as a refuge increased.
Crude Falls on Trade Uncertainty
Oil prices fell on Thursday. Brent slipped 0.27 percent and West Texas Intermediate fell by 0.89 percent. Energy prices were higher after a surprise drawdown in US inventories compounded with supply disruptions of Russian, Venezuelan and Iranian supply.
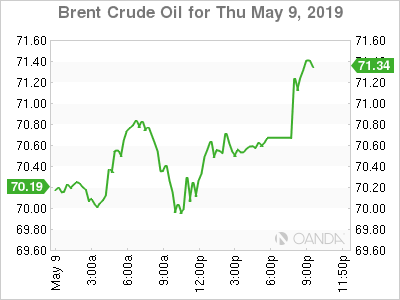
Crude prices are under pressure as the outcome of the US-China trade talks remains uncertain. Donald Trump has added to the confusion with his comments hoping for a deal, but ready to increase tariffs as a viable alternative if one is not reached.
Global growth forecasts were hit by tariff escalation last year, before a cease fire and negotiations kicked up a notch. Energy demand expectations suffered as lower growth around the globe drove crude prices lower.
Supply disruptions have moved to the background as demand fundamentals are the key factor for investors at the moment. US sanctions against Iran and Venezuela, alongside the Russian
Safe Haven Appeal Drives Gold Higher
Gold rose 0.34 percent on Thursday after the dollar lost traction as investors sold the currency in search of risker assets. The fact that the outcome of US-China trade talks remains uncertain keep gold bid as investors are not optimistic on a positive outcome and are seeking the safety of the metal.
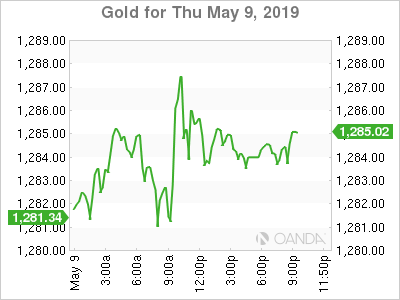
Mixed signals and a close tariff deadline are stoking anxiety in the market on the trade front.
Stocks Keep Falling as US and China Meet on Trade
Global equities continued to fall after confusing comments from US president Donald Trump regarding its upcoming negotiations with China. He mentioned President Xi reached out and would be speaking with him. Trump has hinted a deal with China is possible, but he is ready with tariffs as that is another viable alternative. After months of positive comments, but little details the comments could be read as a negotiation tactic or an unstructured response to China walking back its previous commitments.
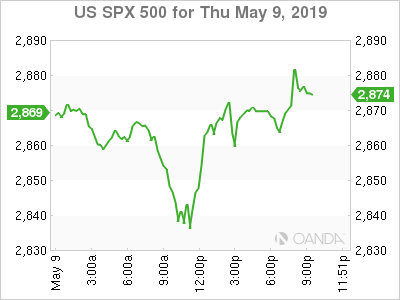
China has already stated that it hasn’t walked back out of the deal and wishes to meet the US halfway. That statement in itself it’s also a bit confusing given that according to some official sources the deal was close with both parties ready to announce an agreement.
Volatility as measured by the CBOE Volatility Index rose 20 percent as market uncertainty on the trade deal remains the driving force.
Eco Data 5/10/19
[php_everywhere instance="1"]
DOW breaks 55 day EMA decisively, confirming near term bearish reversal
US stock markets are in deep selloff today on trade war concerns. At the time of writing, DOW is down -365 pts or -1.41%. S&P 500 is down -1.39%. NASDAQ is down -1.59%. 10-year yield is down -0.047 at 2.435. Technically, the near term outlook in the indices are rather bearish too.
Regarding DOW, firstly, rise from 21712.53 is seen as the second leg of medium to long term consolidation pattern from 26951.81. (S&P 500 and NASDAQ broke respective historical highs but couldn't sustain above. So, that doesn't violate the view that equivalent rebounds were the second legs of corrective patterns too). Secondly, 26695.96 was reasonably close to 26951.81 high. Thirdly, bearish divergence is seen in daily MACD. Fourthly, 55 day EMA is now firmly taken out today.
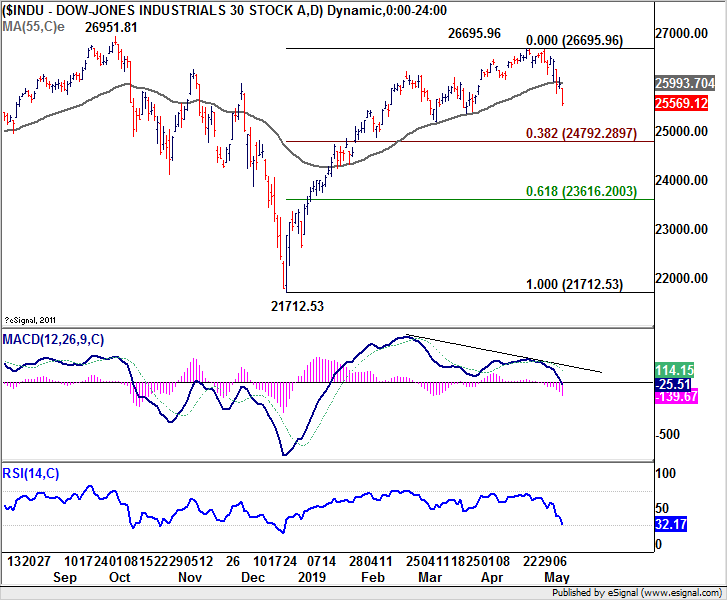
The developments suggest that rise from 21712.53 has completed at 26695.96 already. And fall from there should be the third leg of the above mentioned corrective pattern from 26951.81. Further decline should now be seen back to 38.2% retracement of 21712.53 to 26695.96 at 24792.28. Sustained break there should confirm our view and target 61.8% retracement at 23616.20 and below.
Meanwhile, a turn around in US-China trade negotiation could reverse the decline in stocks. But could Chines Vice Premier achieve that? Theoretically yes but unlikely.
Elliott Wave Analysis: GBPAUD In A Temporary Correction; 1.860/1.870 Can Represent A Reversal!
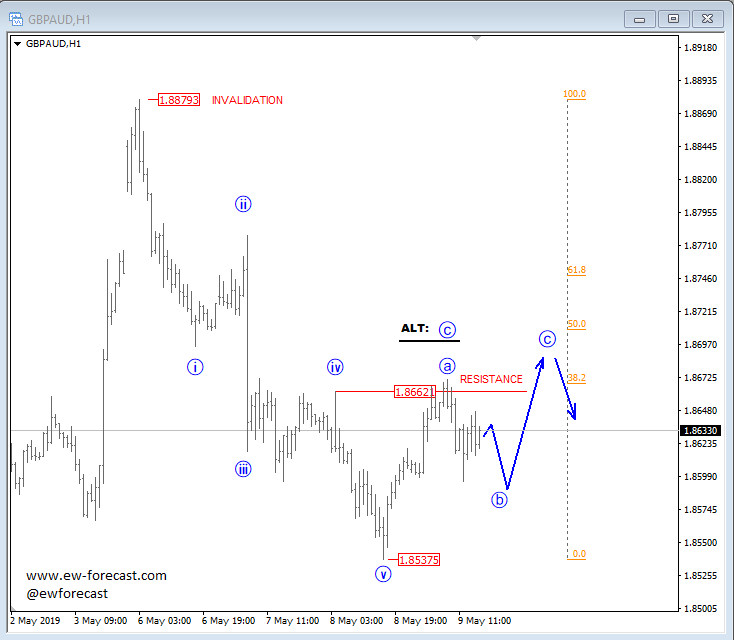
GBPAUD looks to have found a low at the 1.853 level, from where price started to rose again. Ideally a three-wave retracement started to unfold, that can in upcoming sessions look for resistance, and a bearish turn around the 1.866/1.872 region, where various Fibonacci ratios and the former swing high are located. We are certain that a three-wave pullback is now in play, because we can count five waves from the 1.887 high, which in Elliott wave theory suggest that a three-wave contra trend reaction may follow.
GBPAUD, 1h