Sample Category Title
USD/TRY Outlook: Turkish Lira Hit New 2019 Low on Expectations for Istanbul Vote Rule
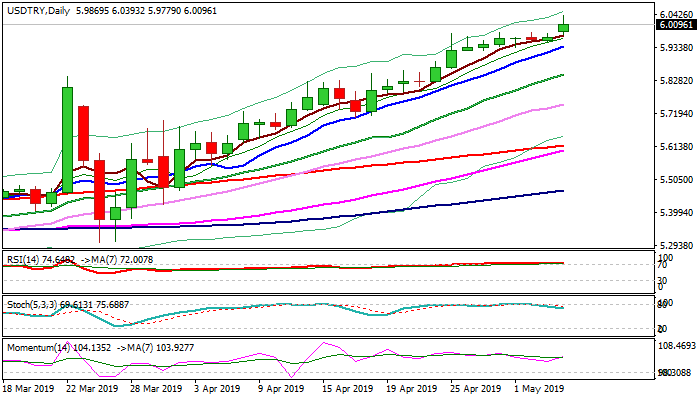
The USDTRY advanced through psychological 6 barrier on fresh bullish acceleration on Monday and hit new 2019 high at 6.0393 on Monday. Fresh lira's weakness was boosted by political turmoil, as governing AK party requested re-run of Municipal election in Istanbul, where the party was defeated. Strong uncertainty on political instability, as well as measures that government takes in order to stabilize the economy, but delay's key structural reforms, prompted investors from lira into foreign currencies that keeps Turkish currency under increased pressure. Fresh advance of the pair eyes key Fibo barrier at 6.1198 (50% retracement of pullback from new record high at 7.1074 to 5.1323), violation of which is expected to generate strong bullish signal for extension of recovery rally from 5.1323 (29 Nov low). Interim barriers lay at 6.0467 (Fibo 138.2% projection) and round-figure 6.10 level. Bullish studies support scenario, with dips seen as positioning for further advance. Rising 10SMA (5.9364) offers solid support which should keep the downside protected.
Res: 6.0393; 6.0467; 6.1000; 6.1198
Sup: 6.0000; 5.9779; 5.9540; 5.9364
More Oil and Gas Mergers to Come after Anadarko Deal Finalized
Latest update on OXY latest offer for Anadarko
Occidental’s higher $38 billion offer for Anadarko just got a little better. Over the weekend, Occidental increased the cash part of the bid from 50% to 78%, adding they would cover the $1 billion breakup fee with Chevron. The improved offer was possible after Occidental announced if the deal was successful, they would sell the African operations to Total for $8.8 billion. Carl Icahn also acquired a minor stake on May 3rd, but is not expected to sway the debate. The current Occidental offer is $11 a share higher than Chevron.
Occidental’s earnings Preview
Occidental Petroleum is expected to deliver a 23% decline in EPS to $0.71, while Revenues rise 5% to $4.0 billion. Historically we see them beat on both the top and bottom line 75% of the time.
With oil around $60 a barrel, OXY can deliver on dividend and output expansion. Shareholders are not happy with the stock’s recent performance and may want a vote against the deal, but the raising of $10 billion preferred-stock investment from Buffett’s Berkshire may reduce thresholds of new equity below the 20% level, thus not forcing a vote.
More Mergers to come
Occidental Petroleum improved the composition of its offer for Anadarko ahead of their Tuesday earnings. Markets are unsure if Chevron will up its offer, they easily can, but may set their eyes on another company. The oil industry is likely to see continued consolidation with possibly Apache, Parsley, Pioneer Nat or Concho.
If Chevron does win the Anadarko deal, they will match Exxon and Shell’s production in the Permian. It is clear that Chevron is a better fit for Anadarko based on integration, but they may not want to continue this bidding war.
If oil retraces closer to the mid-point of the recent range ($45 to $65), we could see more multiple independent exploration outfits consolidate.
Yen Improves to 5-Week High as Trump Talks Tough on China
USD/JPY has continued where it left off on Friday, as the pair as lost ground on Monday. In the North American session, the pair is trading at 110.87, down 0.20% on the day. Earlier in the day, the pair touched a low of 110.28, its lowest level since March 28. It’s a quiet start to the week on the fundamentals front. There are no data releases in the U.S. In Japan, Final Manufacturing PMI is expected to improve to 49.5. On Tuesday, the U.S. releases JOLTS Job Openings and the BoJ releases the minutes of its March meeting.
President Trump sent the equity markets sharply lower on Monday, after threatening to raise tariffs on $200 billion worth of Chinese goods as early as Friday, from 10% to 25%. Trump sounded nonchalant about the trade talks, saying that even if an agreement wasn’t reached, the U.S. would benefit from the new tariffs. This has boosted the yen, as nervous investors seek safe-haven assets such as the yen. China has threatened to cancel the talks, so traders should be prepared for some swings in the currency markets in the coming days.
On Friday, the focus was on U.S. employment data in April. The numbers were mixed, as nonfarm payrolls were strong, but wage growth remained soft. Average Hourly Earnings edged up to 0.2%, up from 0.1%. However, this missed the estimate of 0.3%. Nonfarm payrolls sparkled, climbing to 263 thousand, up from 196 thousand a month earlier. The reading easily beat the forecast of 181 thousand. The unemployment rate dipped to 3.6% in April, down from 3.8% a month earlier. This marked the lowest unemployment rate since 1969.
CADJPY Trades Below Bollinger Band; Narrow Range in Near Term
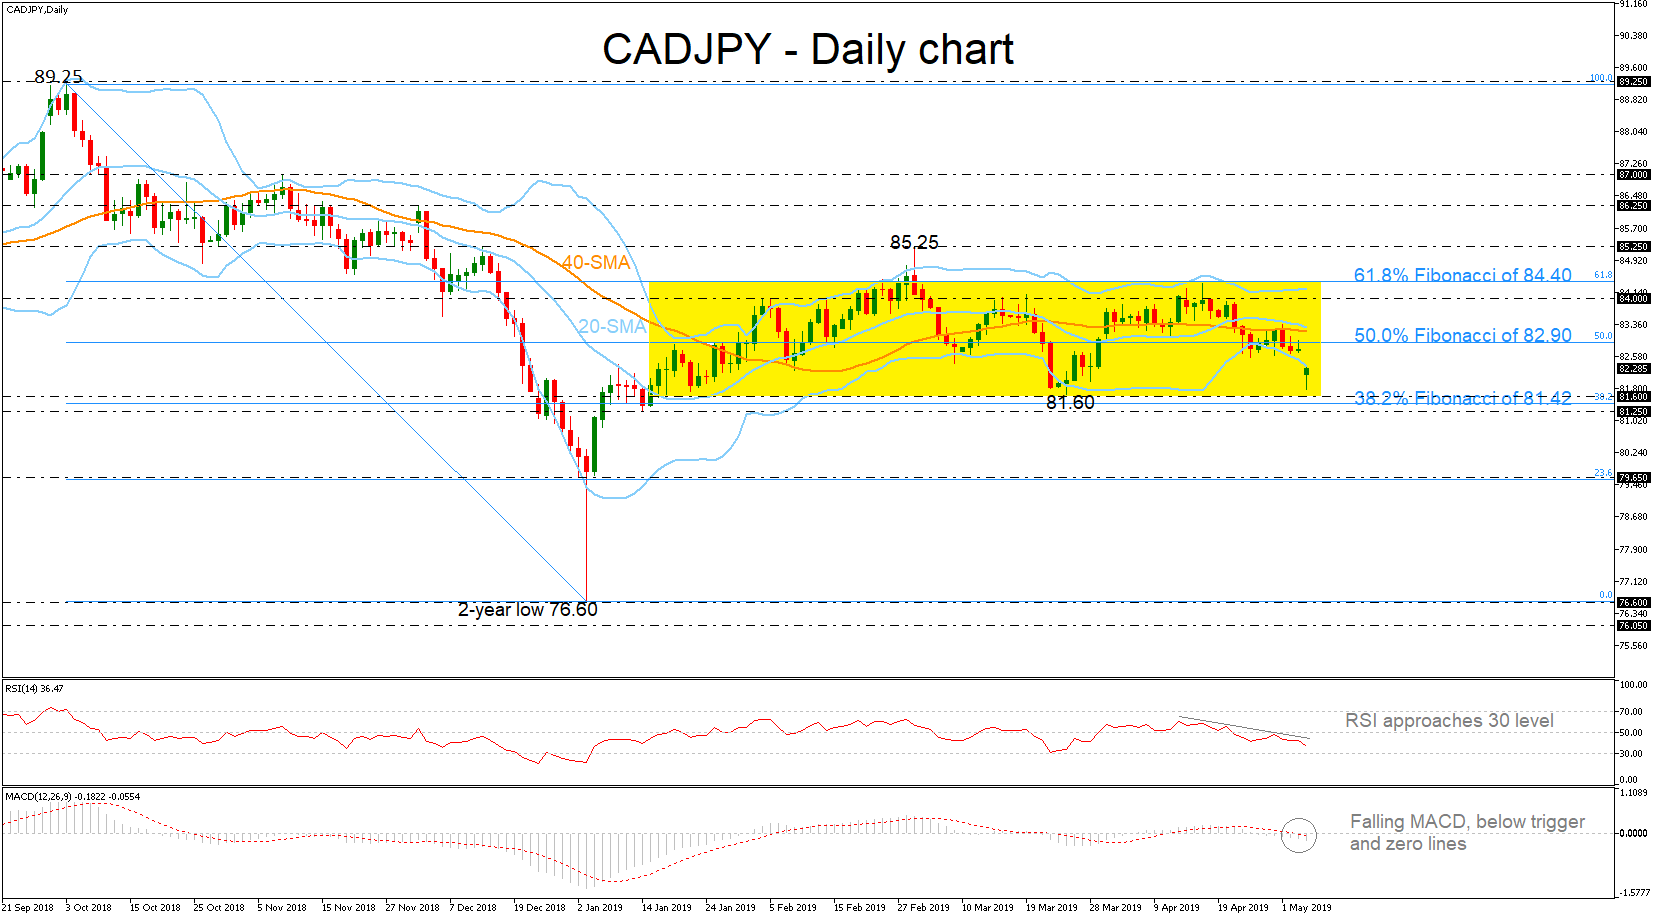
CADJPY has been finding strong support on the 81.60 barrier, after the gap down earlier on Monday, falling beneath the lower Bollinger band in the daily chart. Since the mid-January, the pair has been trading within a narrow range from 61.8% Fibonacci of the downleg from 89.25 to 76.60 near 84.40 until the 81.60 support.
Having a look at the momentum indicators, the RSI is pointing down below the neutral threshold of 50 and the MACD is hovering marginally below the trigger and zero lines.
A step lower could find immediate support at the 81.60 level, the 38.2% Fibonacci of 81.42 and the 81.25 hurdle. More downside pressures could drive the pair towards the 23.6% Fibonacci of 79.65, increasing bearish sentiment.
An advance above the 50.0% Fibonacci of 82.90 could open the door for bullish actions until the 84.00 psychological level and the 61.8% Fibonacci of 84.40. If there is a successful daily close above the aforementioned obstacle, the pair could push until 85.25, while a sharper move higher could shift the neutral bias to more bullish one, testing 86.25.
However, a break below the 38.2% Fibonacci and the 81.25 support could confirm the long-term negative momentum.
Doubling Down on the Trade Dispute with China
Potential Financial and Economic Effects of Trade Policy Uncertainty
Over the past year or so the United States has levied tariffs on roughly $250 billion of Chinese imports. This ongoing trade dispute has been on the backburner since February when U.S. Trade Representative Lighthizer notified Congress that the administration would hold off on increasing the tariff rate to 25% from 10% on March 1 as originally planned. The intention of the decision was to allow trade negotiations between the United States and China to proceed.
But the trade dispute took a new turn this weekend when President Trump tweeted, just days before a high-ranking Chinese delegation is due to arrive in Washington for the latest round of negotiations, that the increase would now go into effect on Friday, May 10. Additionally, the president announced $325 billion in new tariffs on other Chinese imported goods which would go into effect “shortly” and would be subject to the higher 25% rate.
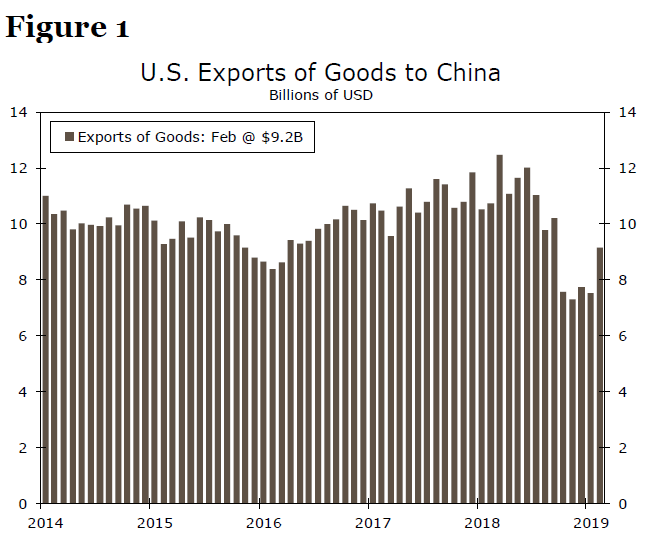
Trump’s action clearly is intended to put pressure on the Chinese to make concessions. Perhaps it will work, but miscalculation on both sides could also occur. If negotiations were to break down China could potentially respond with more retaliatory tariffs, which already have taken a toll on American exports to China (Figure 1). The value of U.S. exports to China fell to $120 billion last year from $130 billion in 2017, a 7% drop compared to the 8% rise in the total value of American exports in 2018. Although China currently levies tariffs on most U.S. goods, the Chinese government could increase the tariff rate, which would likely depress American exports further.
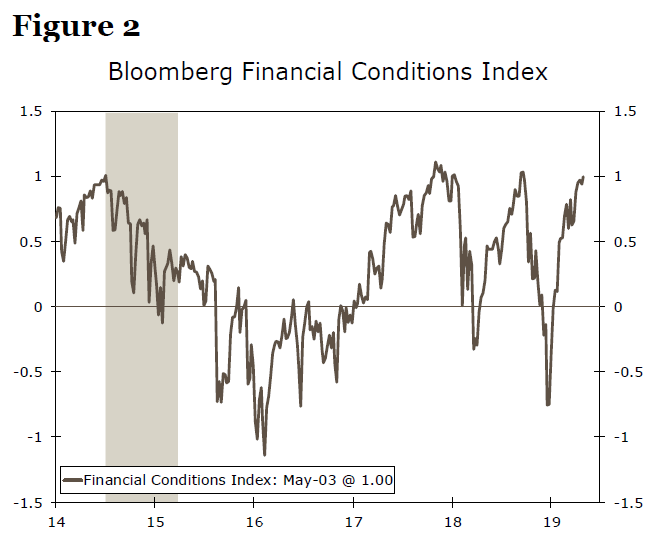
We wrote in a previous report that the direct effects of a full blown trade war with China, should one occur, would probably not bring the U.S. economy to its knees. Exports to China account for less than 1% of U.S. GDP. As we also noted, however, there could be indirect effects that could amplify the slowing effect on the economy. For starters, stock markets around the world have weakened in the wake of the president’s tweets. Generalized weakness in financial markets à la last December would represent a tightening in financial conditions (Figure 2) that could lead to slower economic growth.
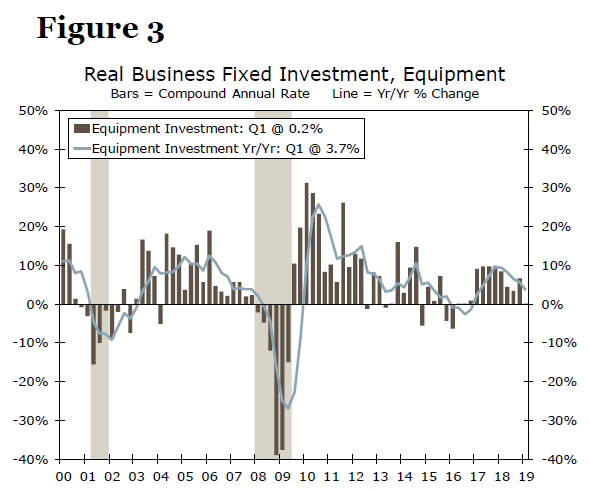
Furthermore, President Trump needs to decide by May 18 whether to impose tariffs on imported automobiles on national security grounds. The increased trade tension with China could lead some businesses to infer that the administration is potentially embarking on a more aggressive trade policy stance. The deceleration in business investment in equipment in recent quarters could reflect, at least in part, uncertainty related to trade policy (Figure 3).1 Further deceleration in business fixed investment spending would clearly lead to slower overall GDP growth.
Higher tariffs on Chinese imports, should they be levied, could impart some upward pressure on CPI inflation in the near term. In our view, however, the Federal Reserve would likely look through any temporary increase in inflation that was caused by a one-off increase in tariffs rates. Rather, any slowing effect that the trade dispute would impart on the economy likely would lead to eventual Fed rate cuts. For now, the Fed is in wait-and-see mode. But trade policy is on the front burner again, and the situation likely will remain fluid in coming days. Stay tuned.
1 A survey by the National Association for Business Economics reported that 38% of respondents in the goods-producing sector said that they have delayed investment due to trade policy uncertainty. See NABE Business Conditions Survey, October 2018.
Sunset Market Commentary
Markets
Core bonds erased all (Germany) to part (US Treasuries) of this morning’s gains during European dealings. The gains stemmed from US President Trump’s twitter rage against China, saying he will raise tariffs on existing Chinese imports and introduce new ones on goods which are currently left out. The announcement poured cool water on trade negotiations which are still intended to restart on Wednesday in Washington. The adverse market reaction proves that markets weren’t anticipating hiccups in what seemed to be the final inning of US-Sino trade negotiations. Core bonds and oil markets (initially lower) returned course from the European start while stock markets (-2% in Europe) failed to do so. Today’s eco calendar was empty bar outdated EMU retail sales (flat in March) and Final EMU services PMI’s. The US yield curve bull steepens at the time of writing with yields down 4.3 bps (2-yr) to 2.1 bps (30-yr) lower. The German yield curve bull flattens slightly with yield dropping between -0.4 bps (2-yr) and -1.3 bps (30-yr). 10-yr yield spread changes vs Germany widen by 1 bp to 3 bps.
US president Trump threatening to raise tariffs on Chinese imports shocked global investors and triggered a sell-off on global equity markets. However, the impact on core bonds and on FX was much more modest. Smaller, less liquid currencies (e.g. the Swedish Crown) lost ground, but most moves developed in an orderly fashion. The yen attracted safe have interest in Asia this morning. USD/JPY dropped to the 110.30 area but reversed part of the initial loss later. The intraday swings in EUR/USD are remarkably limited. The pair held a tight range close to, mostly slightly below 1.12 for most of the day. The trade-weighted dollar showed a similar lackluster pattern, holding in the mid 97 area. So, the dollar hardly profits from the trade-tensions. Several reasons are in play. The ‘high-yielding’ dollar is losing interest rate support against the likes of the euro as US yields decline more than European ones. More trade turbulence might weigh on US data and raise chances for a Fed rate cut. A further escalation of the trade war at some point might cause US president Trump threatening to weaken the dollar in order to support US exports. EUR/USD is currently trading in the 1.1180/85 area. Remarkably, the Swiss franc also didn’t profit. A rise in sight deposits at the SNB maybe rekindled speculation on SNB interventions.
UK markets were closed for a holiday. At the end of last week, sterling rallied as investors hoped/speculated that the defeat in the local elections could inspire the conservative party and labour to put aside differences and strike a Brexit deal. However, political comments over the weekend showed that the water between the two remains deep. Sterling ceded ground today. EUR/GBP rebounded off the 0.85 area and trades currently near 0.8540.
News Headlines
A broad risk-off move and a further declining Swedish PMI business confidence (services 54.0 vs. 55.1 in March) send the country’s krona again lower vs. the euro. Krona selling pressure increased during US trading hours, sending EUR/SEK to an intraday high 10.74, the highest level in almost a decade.
Former Catalan leader Puigdemont, who fled to Belgium in 2017 to avoid being arrested because of his role in an independence referendum, can run in the European elections on May 26, a court in Madrid ruled today.
A closely watched volatility indicator (VIX) spiked this morning and remains at elevated levels (around 18) as markets assess president Trump’s renewed tariff threat. The VIX jumped almost 5 points and ends the period of relative calm that kicked in after the October-December shock waves roiled markets.
EUR/USD Mid-Day Outlook
Daily Pivots: (S1) 1.1156; (P) 1.1181 (R1) 1.1226; More.....
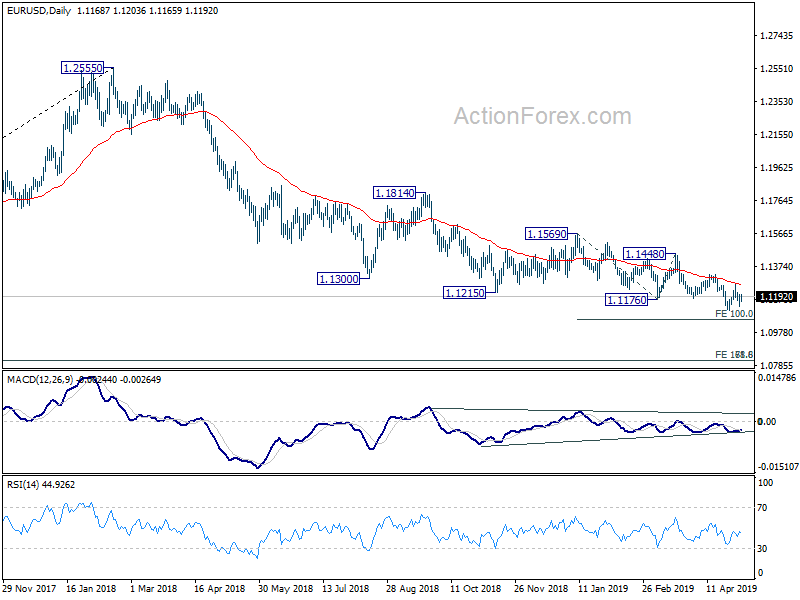
EUR/USD is staying in consolidation above 1.1111 and intraday bias remains neutral. Near term outlook stays bearish with 1.1324 resistance intact and further decline is expected. On the downside, break of 1.1111 low will target 100% projection of 1.1569 to 1.1176 from 1.1448 at 1.1105 next.
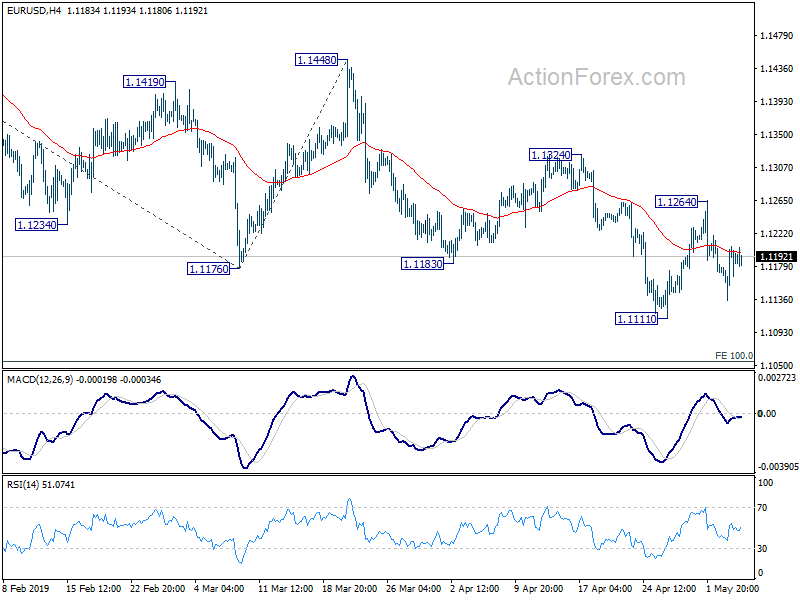
In the bigger picture, down trend from 1.2555 (2018 high) is still in progress. Current fall should now target 78.6% retracement of 1.0339 (2016 low) to 1.2555 (2018 high) at 1.0813. Sustained break there will pave the way to retest 1.0339. On the downside, break of 1.1448 resistance is needed to be the first sign of medium term bottoming. Otherwise, outlook will stay bearish in case of rebound.
GBP/USD Mid-Day Outlook
Daily Pivots: (S1) 1.3051; (P) 1.3114; (R1) 1.3238; More...
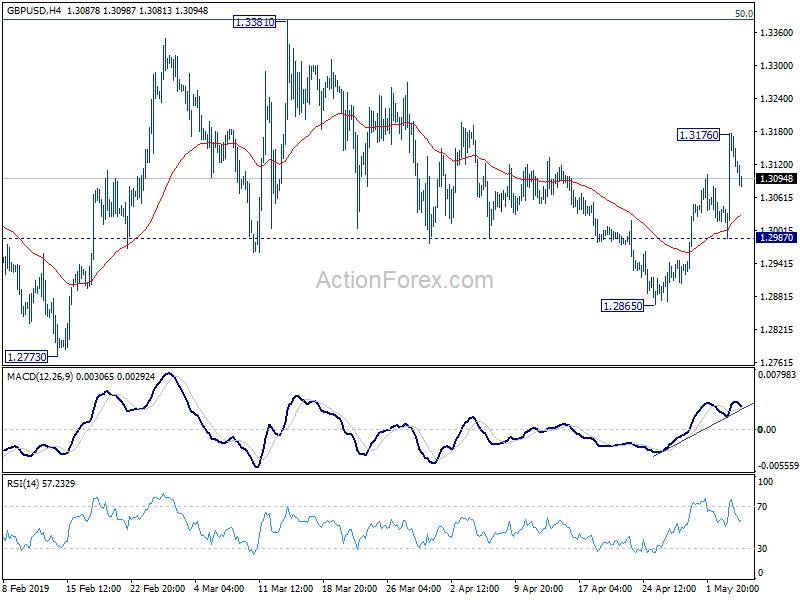
A temporary top is in place in GBP/USD at 1.3176 and intraday bias is turned neutral first. Further rise is expected as long as 1.2987 minor support holds. We'd holding on to the view that corrective decline from 1.3381 has completed at 1.2865 already. On the upside, above 1.3176 will target a retest on 1.3381 high first. On the downside, below 1.2987 minor support will turn bias back to the downside for 1.2865 support instead.
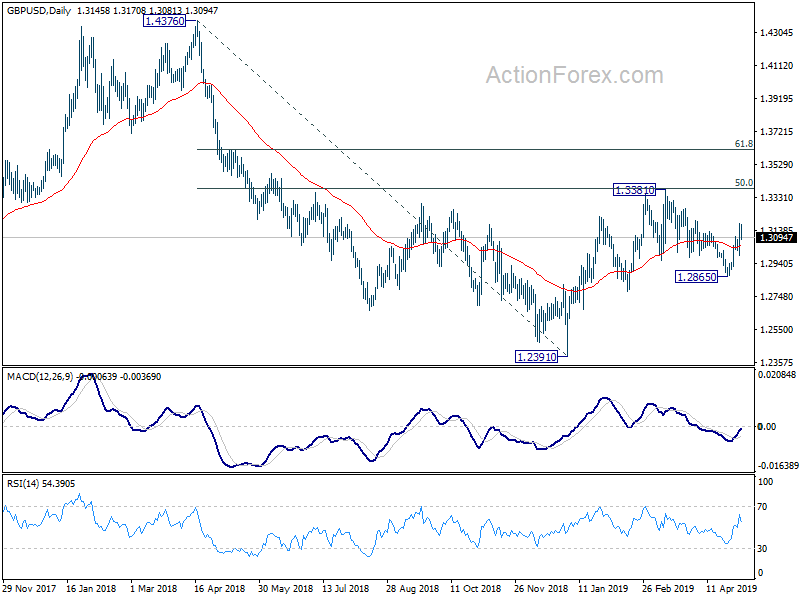
In the bigger picture, medium term decline from 1.4376 (2018 high) halted and made a medium term bottom after hitting 1.2391. Rebound from 1.2391 is seen as a corrective move for now. In case of another rise, strong resistance could be seen around 61.8% retracement of 1.4376 to 1.2391 at 1.3618 to limit upside. On the downside, break of 1.2773 support will suggests that such corrective rise is completed and bring retest of 1.2391 low first.
USD/JPY Mid-Day Outlook
Daily Pivots: (S1) 110.88; (P) 111.29; (R1) 111.52; More...
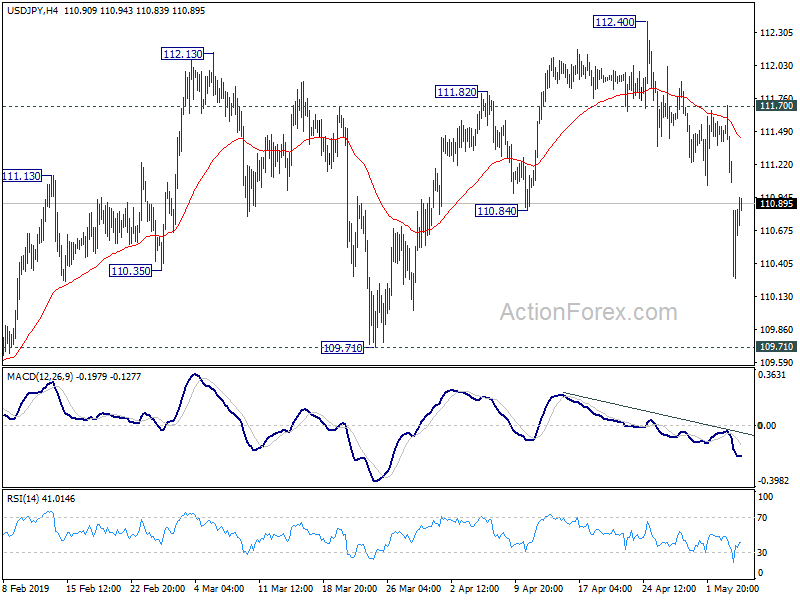
Intraday bias in USD/JPY remains on the downside at this point. Fall from 112.40 is in progress for 109.71 support next. Rebound from 104.69 has completed at 112.40 on bearish divergence condition in daily MACD. Decisive break of 109.71 will confirm this bearish case and targets retesting 104.69 low. On the upside, break of 111.70 resistance is needed to confirm completion of the fall. Otherwise, outlook will now remain cautiously bearish in case of recovery.
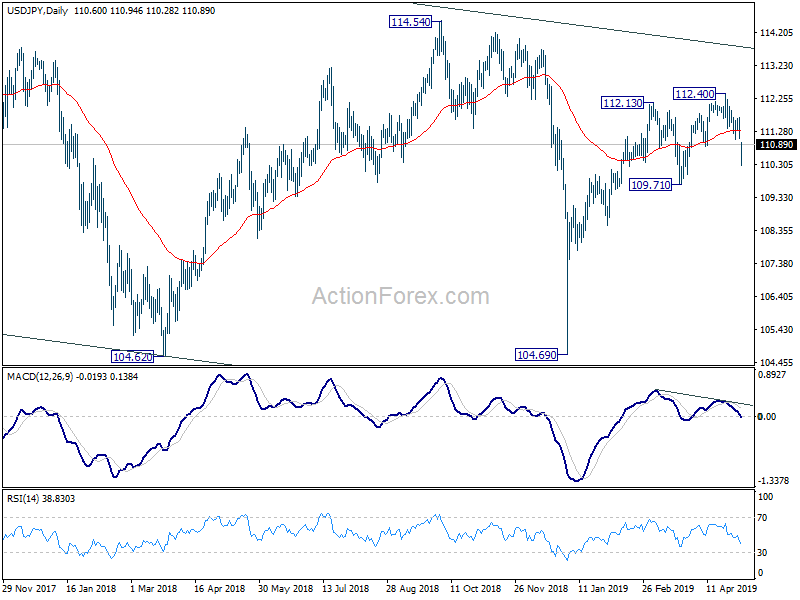
In the bigger picture, medium term outlook in USD/JPY remains a bit mixed as it's staying inside falling channel from 118.65, but there are signs of bullish reversal. On the upside, break of 114.54 resistance will revive the case the corrective fall from 118.65 has completed with three waves down to 104.69. And whole rise from 98.97 (2016 low) is resuming for 118.65 and above. However, sustained break of 109.71 will raise the chance that fall from 118.65 is still in progress for another low below 104.62.
USD/CHF Mid-Day Outlook
Daily Pivots: (S1) 1.0145; (P) 1.0180; (R1) 1.0200; More.....
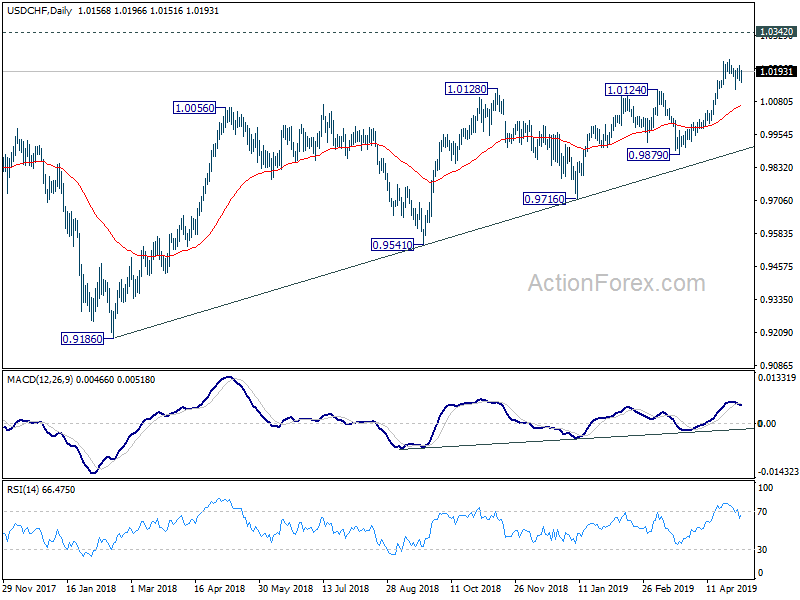
USD/CHF rebounds notably today but stays in range below 1.0237. Intraday bias remains neutral first and more consolidation could still be see. On the upside, break of 1.0237 will resume larger rise from 0.9186 to 1.0342 key resistance. However, break of 1.0126 will turn bias to the downside for deeper decline to 55 day EMA (now at 1.0066).
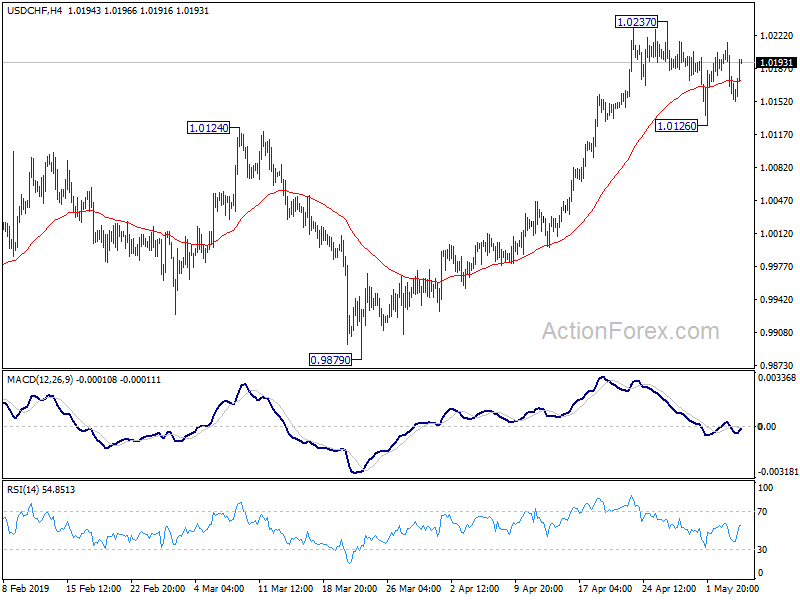
In the bigger picture, medium term up trend from 0.9186 is extending. Current rise should target 1.0342 resistance next. For now, we'd be cautious on strong resistance from there to limit upside, until we see medium term upside acceleration. On the downside, break of 0.9879 support is needed to indicate reversal. Otherwise, outlook will stay bullish in case of deep pull back.