Sample Category Title
DAX Slumps As Trump Threatens Tariffs On China
The DAX index has plunged on Monday. Currently, the DAX is at 12,168, down 1.98% on the day. German services PMI improved to 55.7, just above the estimate of 55.6. This marked the strongest score since September. The eurozone release dipped to 52.8, but still beat the forecast of 52.5. Eurozone Sentix Investor Confidence jumped to 5.3, well above the estimate of 1.1. As well, retail sales slowed to 0.0%, above the estimate of -0.1%. On Tuesday, Germany releases factory orders and the EU posts its economic forecasts of member states.
The DAX climbed 7.1% in April, but has fallen hard to earth in early May. The index has fallen close to 2 percent since the weekend, in response to President Trump’s threat to impose further tariffs against China. On Sunday, Trump said that the U.S. would raise tariffs on $200 billion worth of Chinese goods as early as Friday, from 10% to 25%. Trump sounded nonchalant about the trade talks, saying that even if an agreement wasn’t reached, the U.S. would benefit from the new tariffs. The belligerent comments have spooked investors and sent equity markets sharply lower on Monday. China has threatened to cancel the talks, but the stakes are huge, so cooler heads will likely prevail and the talks are expected to continue.
Eurozone inflation is expected to climb to 1.7% in April, marking a 5-month high. The stronger reading is a reflection of higher oil prices, which has pushed prices higher. Inflation is moving closer to the ECB target of close to 2 percent, and if the upward trend continues, ECB rate-setters will have to give some thought to raising interest rate levels. The bank recently announced that no rate hikes were planned before the spring of 2020, and this dovish stance makes the euro less attractive to investors and is bullish for European equity markets.
No Deal With China? Trump Reversed Markets
On Sunday, Donald Trump announced his intention to raise tariffs on Chinese goods worth $200 billion from 10% to 25%. In addition, the American president announced his readiness to set a higher tariff of 25% on an additional list of goods worth $325 billion (by the way, before that the rate on them was zero).
The news caused consternation among traders, and the start of trading on Monday was marked by a sharp increase in demand for defensive assets. Earlier, the markets priced in the signing of a trade deal, which was to take place already on this Wednesday and become the formal end of a trade conflict. However, things went wrong. As a result, China's A50 China Blue Chip Index has been losing more than 5% since the start of the day, while futures for major US indices declined by around 2%.
The impressive stock indices rally since early January was based on three factors: monetary policy easing, improved macroeconomic indicators, and hope for a trade deal. The fact that the US indices at the end of last week were at historical highs, increases the likelihood of a strong correction. Moreover, the tightening of trading rhetoric may cause a prolonged sale and reduce the demand for risky assets in the coming days. Technical analysis indicates little support for the S&P 500 down to the level of 2850, through which the 50-day moving average passes.
EURUSD
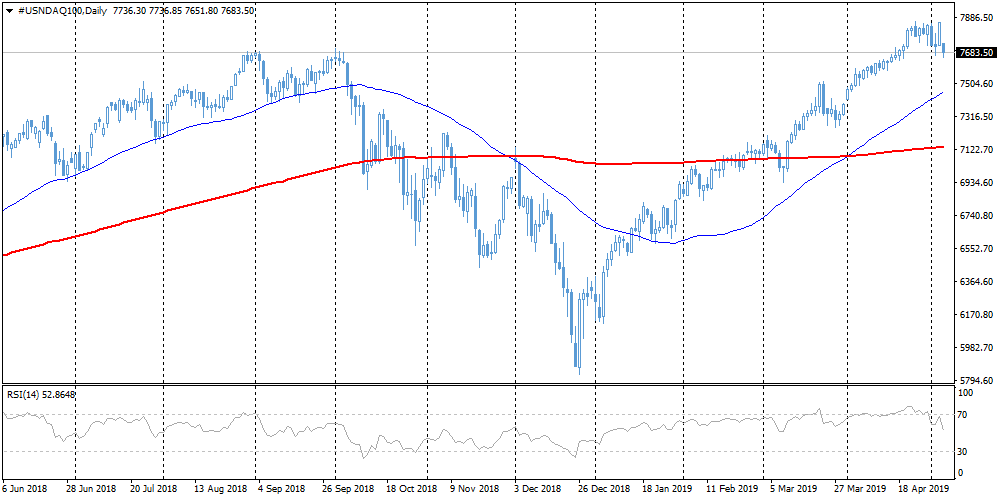
The dollar declines after the release of Friday's labor market data (Nonfarm Payrolls), as investors did not see signs of increasing inflationary pressure in the report. At the beginning of the week, EURUSD began to trade with a gap down, due to risk aversion. However, at the start of trading in Europe, the pair turned back to 1.1200. In a broader perspective, it is worth bearing in mind that trade conflicts and a slowdown in the global (and Chinese) economy often form downward pressure on EURUSD.
USDCNH
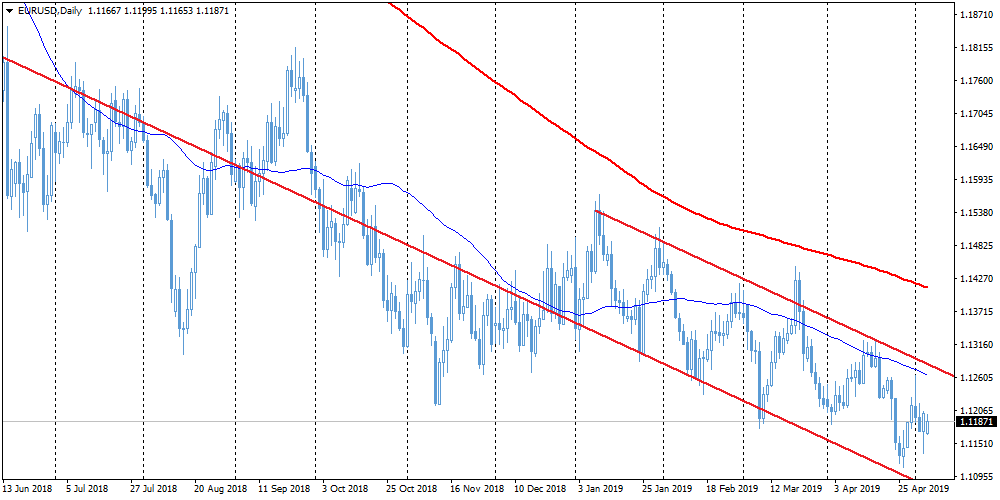
The Chinese yuan started trading on Monday with a 1.3% drop, the sharpest in the last 3 years, at some point touching the level of 6.82 per dollar (this is the maximum since January). The next few days may become critical for determining the future trend: will there be a reversal, or the situation will be resolved differently - we will see very soon.
Equities Tumble As Trump Threaten China
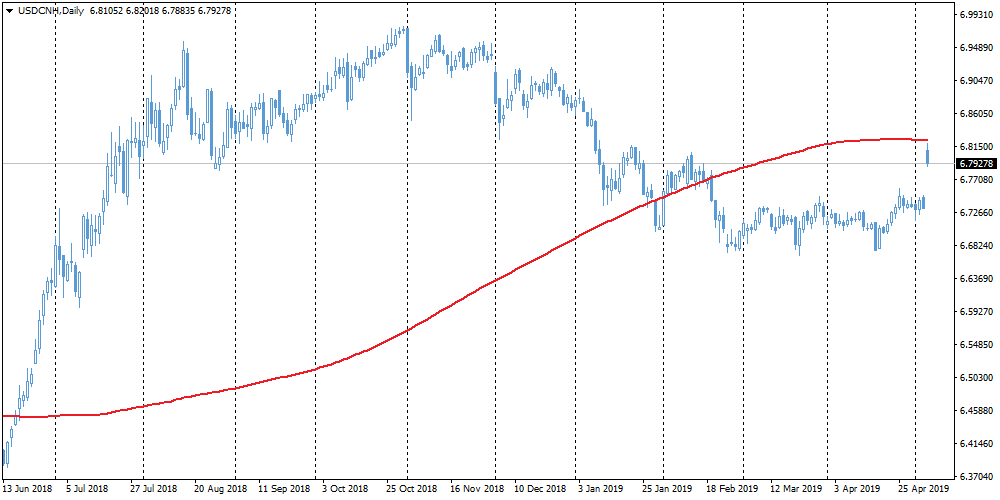
After months of waiting Donald Trump finally dropped a hint suggesting that Chinese negotiators have been dragging their feet in meeting US demands. On Saturday, the US president threatened to enforce higher tariffs as trade talks stall. Financial markets immediately adjusted to the downside at Sunday/Monday opening with the Japanese yen appreciating as much as 0.75% against the greenback. In the equity market, indices sharply dropped with futures on the S&P 500 opening more than 1% lower – front month contracts slid as low as 2,883 points. Across the Atlantic, futures on the EuroSTOXX 50 gapped 0.75% to 3,433 and continued to grind lower to reach 3,381 points. EUR/USD suffered a moderate sell-off as the single currency returned quickly to Friday close after sliding 0.40% during the Asian session. Looking at both markets, it seems that FX traders were more conscious of the risk of failure of the negotiations as the USD appreciated only moderately against its peers, while overall volatility remained low. On the other hand, equity investors were overly optimistic, as they didn’t even consider the possibility of failure. The VIX is up 42% on Monday morning as it jumped to 18.30%.
It was only a matter of time before the truth came out: the negotiations between China and the US are not going particularly well despite lots of enthusiastic tweets from Donald Trump and positive comments from its administration. In view of most recent events, it looks like President Trump greatly overestimated the grip that he has on China. According to the latest news, it seems that Chinese officials are still traveling to the US for the “final” round of talks.
However, it is hard to tell whether it was just a threat aiming at forcing China to make real concessions or measures that will be implemented soon. We tend to favour the second option. Nevertheless, it may take a couple of days for the equity market to stabilise. After such a long and sustained rally, what could be more normal?
US crude production, Trade weigh on oil prices
Resisting the steady increase in US oil inventories over the past two weeks, oil prices are losing momentum, as headlines about the year-long trade dispute between the United States and China has prompted investors to divest themselves of risky investments. Oil prices have turned down from 6-months high, with Brent crude trading below 70 (-1.75%), West Texas Intermediate at 60.80 (-1.80%) and finally Shanghai futures at CNY 471 (-2.80%). Yet it seems that despite recent tweet from US president Donald Trump about potential tariffs hike, the situation has not changed. OPEC output cut is still in place while major supply shortages related to Iran, Venezuela, Nigeria or Libya are still in place. It is therefore to consider that positive headlines concerning US – China trade talks should again benefit oil prices.
US EIA crude oil inventories for the week ended 26 April have been pointing to a rise of 9.93 million, its highest level since November 2018 while total production reached a record of 12.3 million bpd.
Currently trading at 60.80, WTI is heading along 61.50 as buying pressures are emerging.
The Analytical Overview Of The Main Currency Pairs
The EUR/USD currency pair
Technical indicators of the currency pair:
Prev Open: 1.11713
Open: 1.11659
% chg. over the last day: +0.21
Day's range: 1.11583 – 1.11775
52 wk range: 1.1111 – 1.2009
On Friday US published mixed reports on the Labour Market for April. The non-agrarian industry created 263 000 workplaces which is much higher than expected. The unemployment lowered to 3.6% - the 49-year minimum. At the same time, the average hourly wage grew only by 0.2%, which is lower than expected 0.3%. The economically active population lowered from 63% to 62.8%. The ISM's non-industrial business activity index slowed down from 56.1 to 55.5.
The trading conflict between Washington and Beijing in once again in the foreground. Donald Trump tweeted that on Friday the Chinese wares worth more than 200 billion USD will have their fees increased from 10% to 25%. Keep an eye on this issue.
EUR/USD is consolidating around 1.11650-1.12000. Open positions from these marks.
At 11:00 (GMT+3:00) we expect an array of economic releases from the EU.
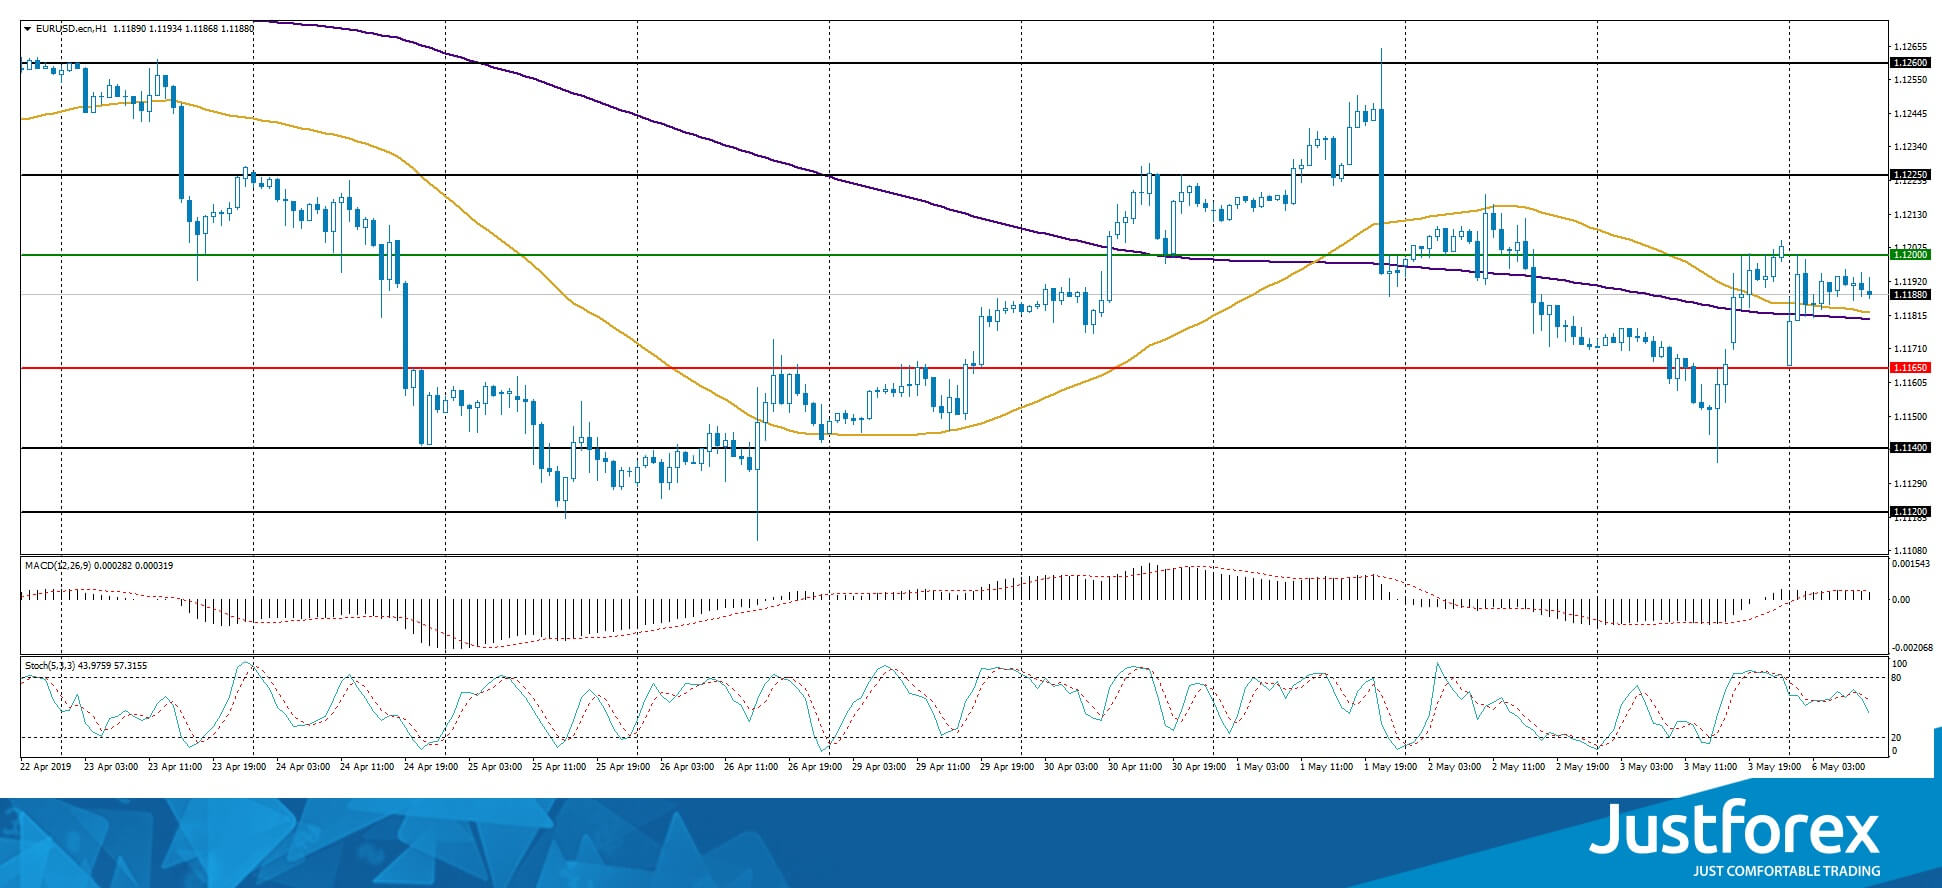
The indicators do not provide precise signals: 50 MA started to cross 200 MA.
The MACD histogram is in the positive zone but below the signal line which gives a weak signal to buy EUR/USD.
The Stochastic Oscillator is in the neutral zone, the %K line is below the %D line which points to the bearish mood.
Trading recommendations
Support levels: 1.11650, 1.11400, 1.11200
Resistance levels: 1.12000, 1.12250, 1.12600
If the price fixes below 1.11650, expect further descend toward 1.11400-1.11200.
Alternatively, the quotes can grow toward 1.12250-1.12500.
The GBP/USD currency pair
Technical indicators of the currency pair:
Prev Open: 1.30276
Open: 1.31371
% chg. over the last day: +1.07
Day's range: 1.31102 – 1.31706
52 wk range: 1.2438 – 1.3631
GBP/USD had shown agressive sales on Friday. GBP updated the key maximums. Jeremy Corbin, the leader of the British Labour party made a statement that the Parliament should just "deal with it" and reach an agreement on Brexit. These comments gave GBP remarkable support. The quotes are currently consolidating around 1.31000-1.31400. You should open positions from these levels. Further growth is not out of question.
The British markets are currently closed due to a holiday.
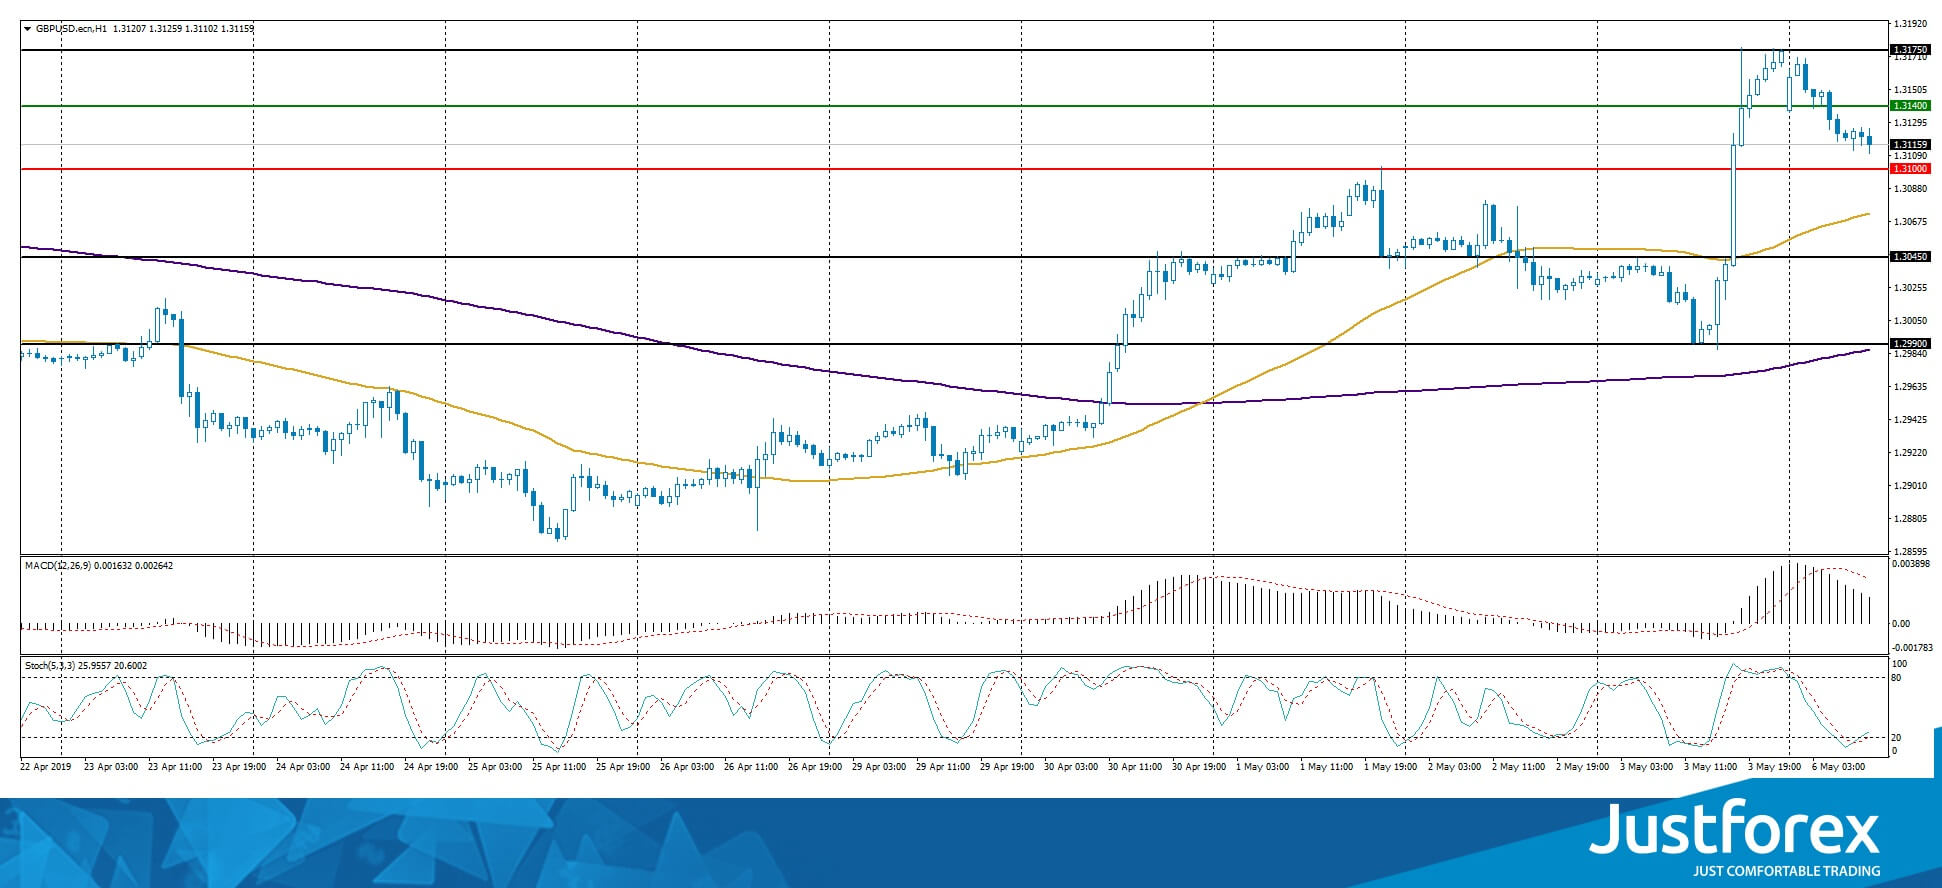
The price fixed above 50 MA and 200 MA which points to the power of the buyers.
The MACD histogram is in the positive zone but below the signal line which gives a weak signal to buy GBP/USD.
The Stochastic Oscillator started to leave the oversold zone, the %K line is above the %D line which points to the bullish mood.
Trading recommendations
Support levels: 1.31000, 1.30450, 1.29900
Resistance levels: 1.31400, 1.31750, 1.32000
If the price fixes above 1.31400, expect further growth toward 1.31750-1.32000.
Alternatively, the quotes can correct toward 1.30700-1.30500.
The USD/CAD currency pair
Technical indicators of the currency pair:
Prev Open: 1.34657
Open: 1.34559
% chg. over the last day: -0.41
Day's range: 1.34544 – 1.34938
52 wk range: 1.2727 – 1.3664
USD/CAD shows an ambiguous technical picture. The CAD keeps consolidating. The key support and resistance levels are 1.34550 and 1.34900. The pressure on the CAD is caused by the weak oil quotes. The trading instrument can grow further. You should open positions from the key levels.
Keep an eye on the statements made by the Head of the Bank of Canada.
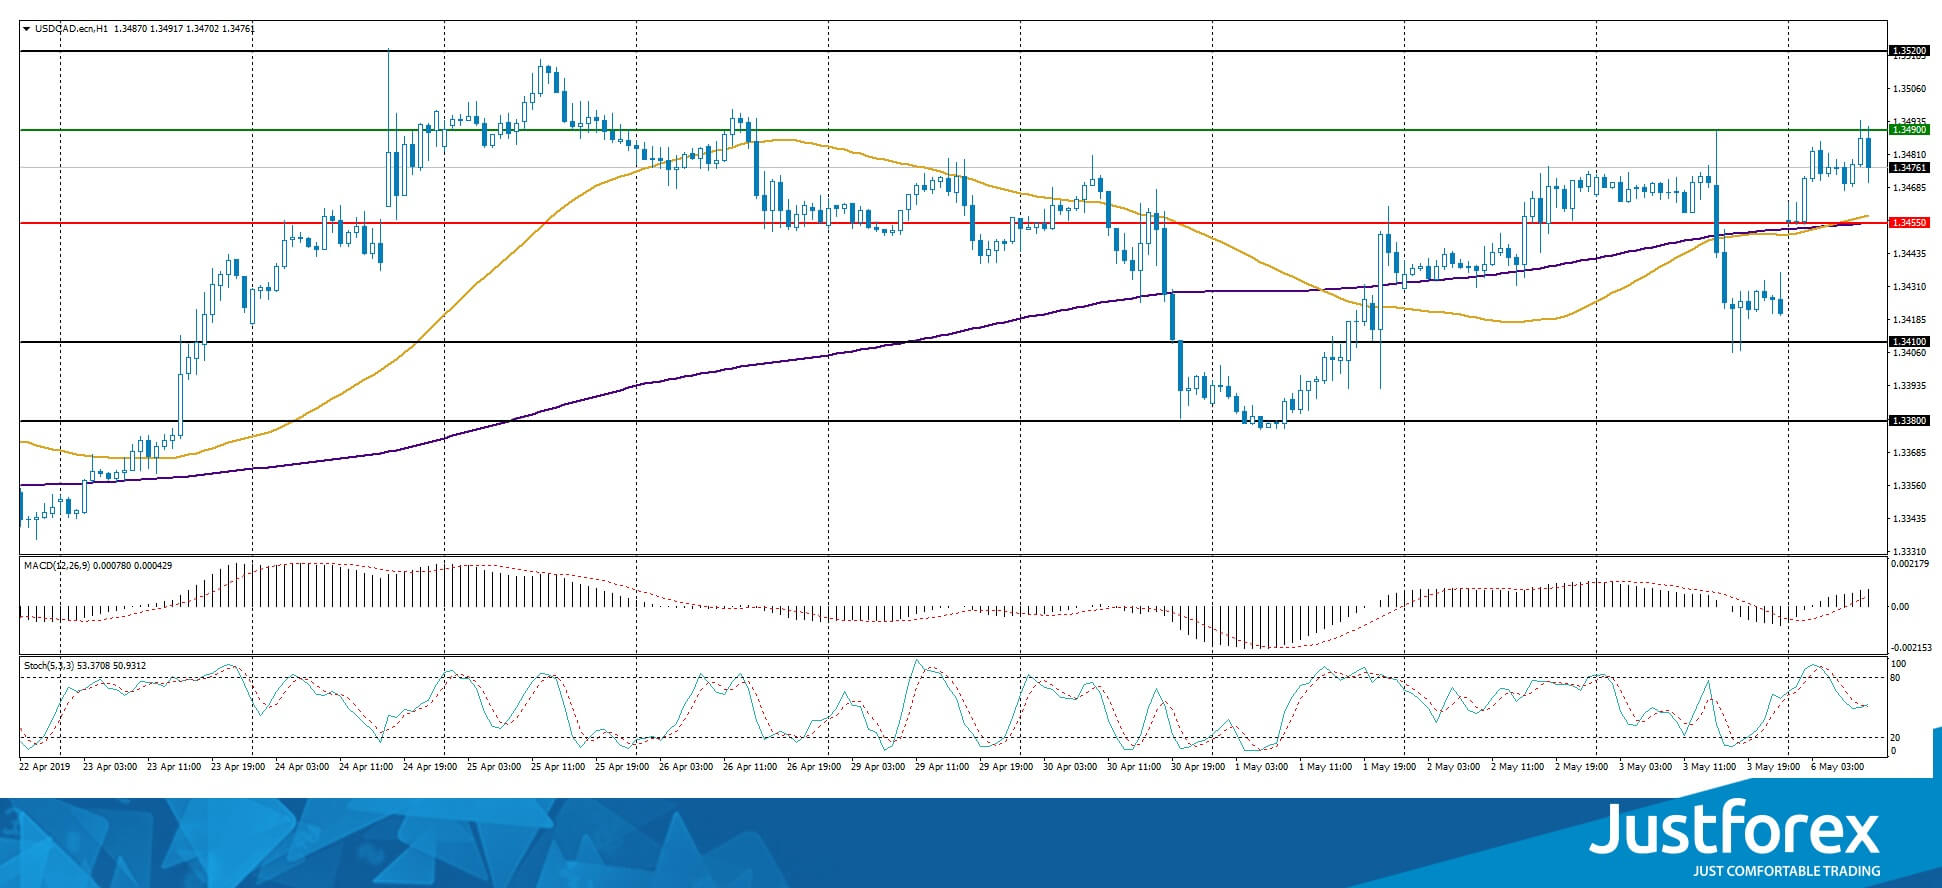
The indicators do not provide precise signals, 50 MA has crossed 200 MA.
The MACD histogram is in the positive zone but above the signal line which gives a strong signal towards buying USD/CAD.
The Stochastic Oscillator is in the neutral zone, the %K line is crossing the %D line. There are no signals at the moment.
Trading recommendations
Support levels: 1.34550, 1.34100, 1.33800
Resistance levels: 1.34900, 1.35200
If the price fixes above 1.34900, consider buying USD/CAD. The price is supposed to move toward 1.35200-1.35400.
Alternatively, the qutoes can descend toward 1.34200-1.34000.
The USD/JPY currency pair
Technical indicators of the currency pair:
Prev Open: 111.488
Open: 110.598
% chg. over the last day: -0.37
Day's range: 110.284 – 110.844
52 wk range: 104.97 – 114.56
USD/JPY is in the bearish mood. The trading instrument opened with a gap down by 50 points and updated the local minimums. The demand for the safe currencies has grown due to the escalation of the US/China conflict. Keep an eye on this issue and open positions from the 110.600-110.850 levels. The currency pair can descend further.
Japanese financial markets are closed due to the holidays.
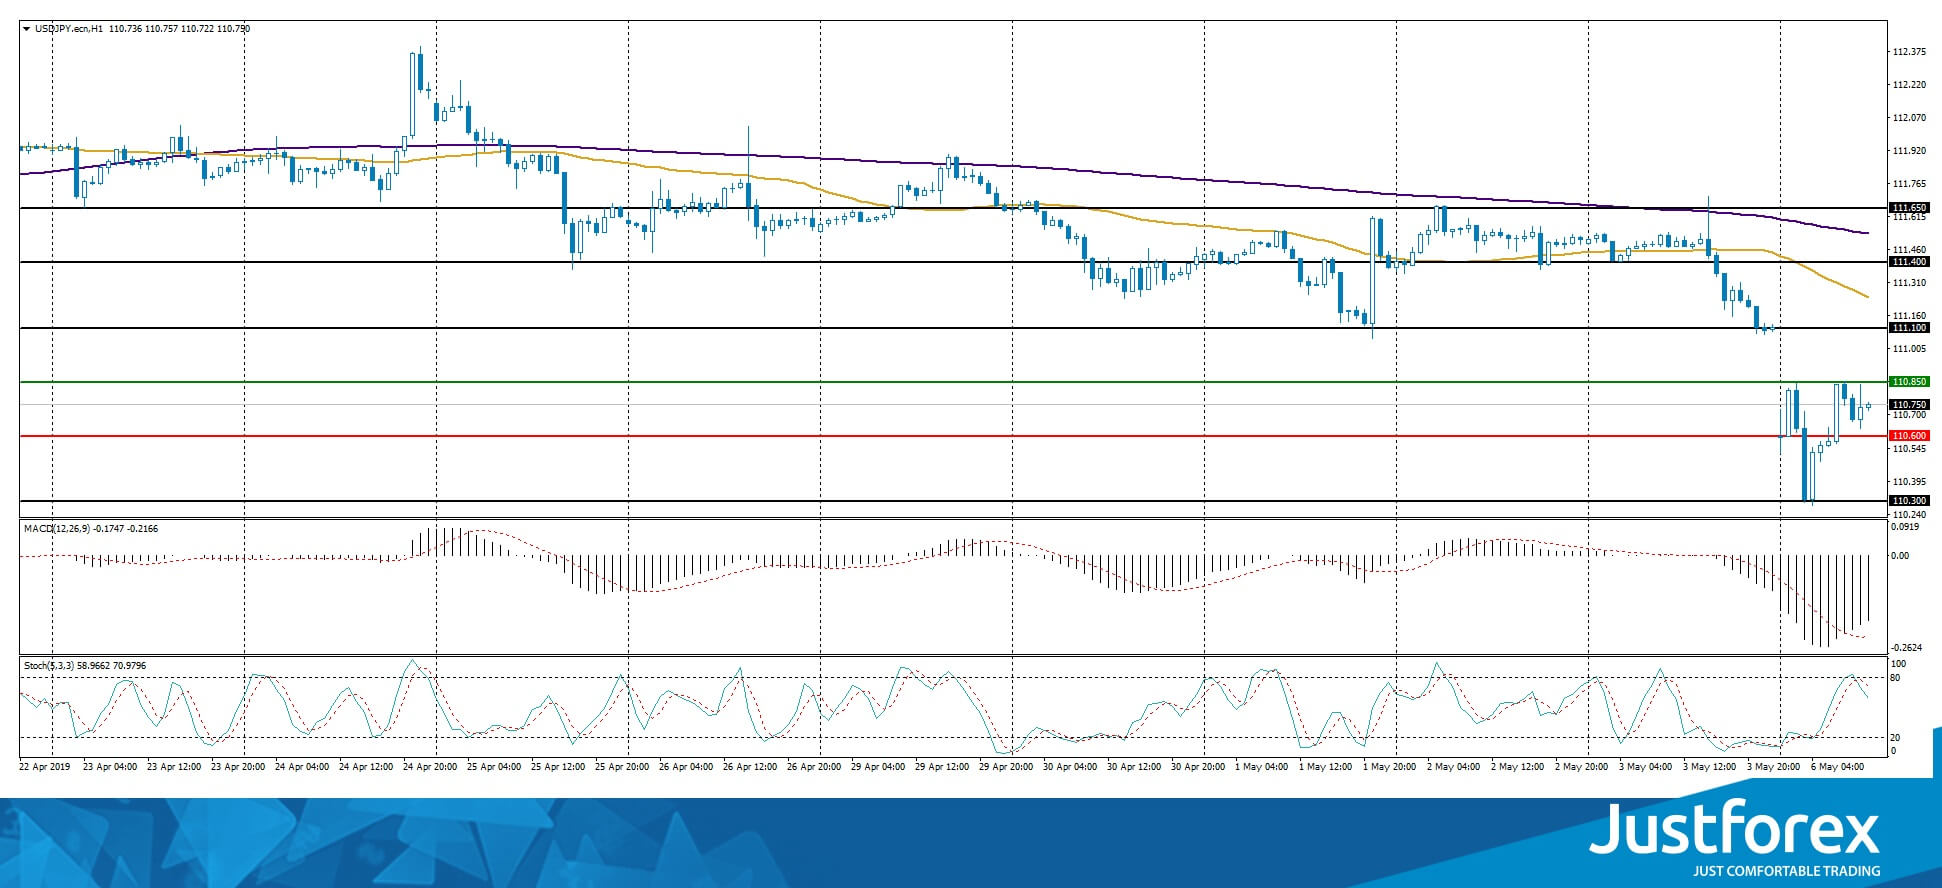
The price fixed below 50 MA and 200 MA which points to the power of the sellers..
The MACD histogram is in the negative zone which gives a weak signal to sell USD/JPY.
The Stochastic Oscillator is in the neutral zone, the %K line is below the %D line which points to the bearish mood.
Trading recommendations
Support levels: 110.600, 110.300, 110.000
Resistance levels: 110.850, 111.100, 111.400
If the price fixes below 110.600, expect it to descend toward 110.300-110.000.
Alternatively, the quotes can recover toward 111.100-111.300.
Investors Are Focused On The Escalation In The US-China Trade Conflict
On Friday, the US dollar weakened against a basket of major currencies due to mixed economic statistics. Thus, the number of people employed in the nonfarm sector increased by 263K in April, while investors expected growth by only 181K. Also, the unemployment rate fell to its lowest level within 49 years – 3.6%. However, experts were upset that the average hourly earnings rose by 0.2% in April instead of the expected increase by 0.3%. ISM non-manufacturing PMI counted to 55.5 in April, while experts forecasted 57.2. The dollar index (#DX) closed in the negative zone (-0.40%).
The US currency is under pressure due to the news that US President Donald Trump decided to sharply increase the pressure on China on Sunday. The President said he would raise US tariffs from 10% to 25% for Chinese goods $200 billion worth this week. It worsened relations between the United States and China seriously and dramatically. Beijing considers cancellation of trade talks this week in Washington because of Trump's comments, which caught Chinese officials flatfooted.
Jeremy Corbyn, the leader of the British Labour Party, said on Friday that parliament should "negotiate" and break the impasse over Brexit. These comments have supported the British pound.
The "black gold" prices fell by more than 2% due to Donald Trump's claims. At the moment, futures for the WTI crude oil are testing the mark of $60.60 per barrel.
Market Indicators
On Friday, the bullish sentiment was observed in the US stock market: #SPY (+0.98%), #DIA (+0.80%), #QQQ (+1.59%).
The 10-year US government bonds yield fell. Currently, the indicator is at the level of 2.51-2.52%.
The news feed on 2019.05.06:
At 11:00 (GMT+3:00) we expect important statistics on economic activity in the Eurozone.
We also recommend following up-to-date information regarding trade negotiations between the US and China, as well as paying attention to the speech by the Governor of the Bank of Canada, Poloz.
Risk Slumps After Trump’s Trade Threats
Monday May 6: Five things the markets are talking about
The latest U.S jobs report showed that hiring picked up in April, with the unemployment rate falling to its lowest level in 50-years. It gave a boost to major U.S stock indexes and weighed on the mighty U.S dollar and 10-year Treasury yields.
Nevertheless, a couple of Tweets from Trump over the weekend has managed to put global equities on the back foot, pressured Treasury yields even further and has investors seeking shelter by owning risk averse currencies.
President Trump is threatening to increase tariffs on Chinese imports – he planned to increase taxes on +$200B in Chinese imports to +25% from +10% starting Friday. He also plans +25% tariffs “shortly” on a further +$325B in Chinese goods – his threats are calling into question whether the next round of trade talks this week will be delayed.
Note: Chinese Vice-Premier Liu He is scheduled to arrive in Washington this Wednesday.
On the data front, Eurozone retail sales will start the week followed by German manufacturers' orders and French merchandise trade. In the U.K, first-quarter GDP will be posted Friday. Down-under, Aussie trade and retail sales data will be posted early in the week followed by midweek policy announcement from the RBA amid expectations for no action. The RBNZ will also be issuing a statement this week. Chinese CPI data are also expected midweek.
Stateside, inflation will be the focus, but it will be late in the week, first producer prices on Thursday then a consumer price report on Friday that is not expected to show much acceleration. For Canada, housing starts will be posted on Wednesday, the trade balance on Thursday, and the labour force survey on Friday where a gain is expected.
On tap: JPY & GBP bank holiday, AUD retail sales and NZD (May 6), RBA & RBNZ monetary policy announcement (May 7), Fr. Bank holiday & NZD annual budget (May 8), CAD Trade balance & U.S PPI, RBA monetary policy statement (May 9), GBP GDP & CAD employment change (May 10).
1. Stocks in deep red
Global equities have plunged after the sudden intensification of Sino-U.S trade tensions, sowing fears the conflict could spill over into slower economic growth.
In Asia, both the Nikkei225 and the Kospi index were closed for a bank holiday. In Europe, the U.K was closed for the long weekend.
Down-under, Aussie shares closed atop a three-week low overnight after U.S's threat to raise tariffs on Chinese goods spoiled hopes for an imminent trade deal between the world's largest economies. Broad-based losses pushed the S&P/ASX 200 index -0.8% lower at the close of trade. The benchmark was little changed on Friday.
In China, investors were caught off guard by Trump's tariff threats, but managed to dump equities and sell the yuan currency as a fresh deterioration in Sino-U.S trade tensions began. Regional bourses fell the most in more than three-years. The blue-chip CSI300 index and the Shanghai Composite Index both tumbled more than -5%. In Hong Kong, the Hang Seng index slumped -3.3%.
In Europe, regional indexes trade sharply lower across the board as U.S trade tensions weighs.
In the U.S, stocks are set to open deep in the ‘red' (-1.8%).
Indices: Stoxx600 -1.54% at 384.34, DAX -2.13% at 12,148.00, CAC-40 -2.21% at 5,426.01, IBEX-35 -1.75% at 9,245.00, FTSE MIB -2.38% at 21,249.50, SMI -1.65% at 9,581.60, S&P 500 Futures -1.86%
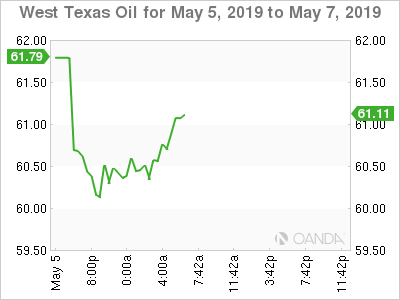
2. Oil prices slump after Trump's tariff threats, gold higher
Oil prices have tumbled overnight after Trump said he would sharply hike tariffs on Chinese goods this week, risking the derailment of trade talks between the world's two biggest economies.
Brent crude oil futures fell below +$70 per barrel, trading at +$69.34 per barrel, down -$1.51, or -2.1% from Friday's close. U.S West Texas Intermediate (WTI) crude futures are at +$60.57 per barrel, down -$1.37 per barrel, or -2.2% from Friday's close.
The prospect of months of trade talks being derailed by Trump has raised market concerns over future demand for oil.
Also providing pressure on prices is U.S data showing an increase in production. U.S crude production has already surged by more than +2M bpd since early 2018, to a record +12.3M bpd. This has made the U.S the world's biggest producer. However, data from Baker Hughes Friday showed that the number of rigs drilling for gas in the U.S fell by -3 to +183 in the week to May 3, while oil-directed drilling rigs rose by +2 to 807.
Ahead of the U.S open, gold rallied overnight after U.S President Trump threatened to impose tariffs on Chinese goods, encouraging a sharp downturn in riskier assets. Spot gold is up +0.3% to +$1,282.96 per ounce, while U.S gold futures are up +0.2% to +$1,283.70 an ounce.
Note: Gold was in demand in India and Singapore last week as a correction in prices ahead of a key gold-buying festival supported purchases even as major centres were closed for most of the week due to holidays.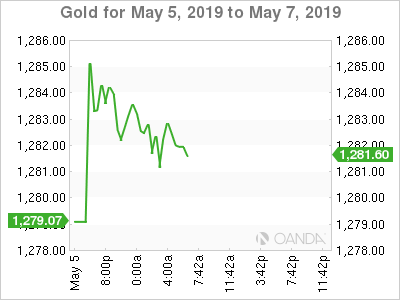
3. Yields plummet on safe haven buying
Core eurozone bonds yields fell after U.S President Trump said he would hike U.S. tariffs on +$200B worth of Chinese goods this week and target billions more soon.
German Bunds have risen sharply as investors buy safe haven assets. The Bund yield has fallen -2.5 bps to +0.004%. In France, the 10-year yield declined -2 bps to +0.348% on the biggest drop in more than a week, while down-under, Australia's 10-year yield declined – 5 bps to +1.7395%.
The outlier this morning is Italian government bonds which have underperformed the rest of the Euro-periphery with renewed concerns about the stability of the Italian government. Italy's anti-establishment 5-Star Movement raised pressure on its government partner to dismiss a junior minister under investigation for corruption.
Italy's short-dated bonds are up +6 bps, while the spread of its 10-year debt over Germany widened to +260 bps.
In China, the PBoC cut the Reserve Requirement Ratio (RRR) for Small and Medium sized banks by up to -350 bps to +8.00% (effective May 15). Funds released would be used for lending to small and private firms.
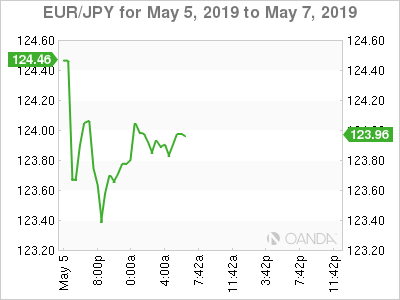 4. Safe haven currency flows dominate
Safe haven flows are dominating trading after Trump's weekend tweets on China trade and planned implementation of tariffs.
EUR/USD is lower by -0.2% for the bulk of the session to trade around €1.1190 area.
GBP/USD is off -0.4% at £1.3120 area with cross party Brexit talks resuming tomorrow. Sterling is finding it difficult to build upon market optimism that a Brexit compromise seems to be taking shape and have the UK move forward with a plan to get a Withdrawal Agreement passed by Parliament.
USD/JPY is off -0.4% with Japan still on holiday. The yen currency (¥110.82) remained a beneficiary of safe-haven flows over trade concerns.
The Swiss franc is also rising, with EUR/CHF down -0.1% at $1.1375. The AUD is amongst the biggest fallers, given Australia's close links to China, with AUD/USD down -0.7%, while emerging market currencies drop.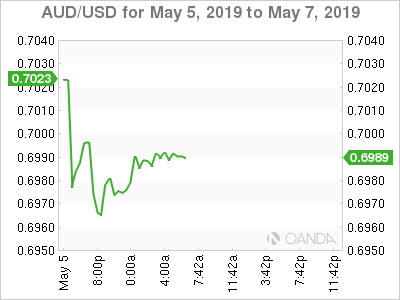
5. Euro moral improves
Data this morning showed that investor morale in the euro zone improved this month for the third month in a row to hit its highest level since last November, helped by a resilient global environment and the danger of a disorderly Brexit being averted until October.
The Sentix research group said that its investor sentiment index for the euro zone rose to +5.3 in May from -0.3 in April – the market was expecting a reading of +1.4.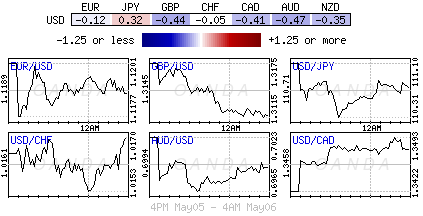
EUR/USD – Euro Ticks Lower, German And Eurozone Services PMI Within Expectations
EUR/USD is showing limited movement in the Monday session. Currently, the pair is trading at 1.1189, down 0.11% on the day. On the release front, the focus is on services PMI reports. German services PMI improved to 55.7, just above the estimate of 55.6. This marked the strongest score since September. The eurozone release dipped to 52.8, but still beat the forecast of 52.5. Eurozone Sentix Investor Confidence jumped to 5.3, well above the estimate of 1.1. As well, retail sales slowed to 0.0%, above the estimate of -0.1%. There are no economic releases in the U.S. On Tuesday, the U.S. releases JOLTS Job Openings.
Eurozone inflation is expected to climb to 1.7% in April, marking a 5-month high. The stronger reading is a reflection of higher oil prices, which has pushed prices higher. Inflation is moving closer to the ECB target of close to 2 percent, and if the upward trend continues, ECB rate-setters will have to give some thought to raising interest rate levels. The bank recently announced that no rate hikes were planned before the spring of 2020, and this dovish stance has made the euro less attractive to investors. The euro is down 2.4% since the start of the year.
In the U.S., the week ended with mixed employment numbers. Wage growth edged up to 0.2%, shy of the estimate of 0.3%. However, nonfarm payrolls sparkled, climbing to 263 thousand, up from 196 thousand a month earlier. The reading easily beat the forecast of 181 thousand. Despite the strong payrolls release, the euro managed to post slight gains on Friday.
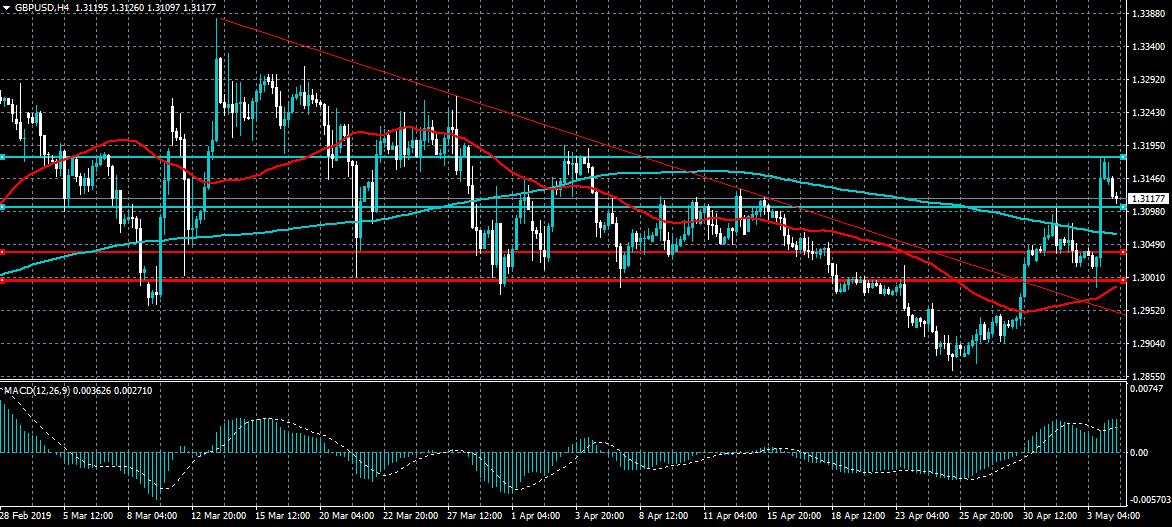
GBPUSD 1.3064 Key Pivot
The British pound is starting to give back Friday’s trading gains against the US dollar as the greenback enjoys strong early week demand. The GBPUSD could fall back towards its key weekly pivot point, at 1.3064, if the 1.3100 support level is breached. If bulls defend the 1.3100 level, the 1.3180 level currently offers the strongest form of intraday technical resistance.
The GBPUSD pair is only bearish while trading below the 1.3100 level, key support is found at the 1.3064 and 1.3040 levels.
If the GBPUSD pair continues to trade above the 1.3100 level, key intraday resistance is found at the 1.3150 and 1.3180 levels.
USDJPY Watching Price Gap
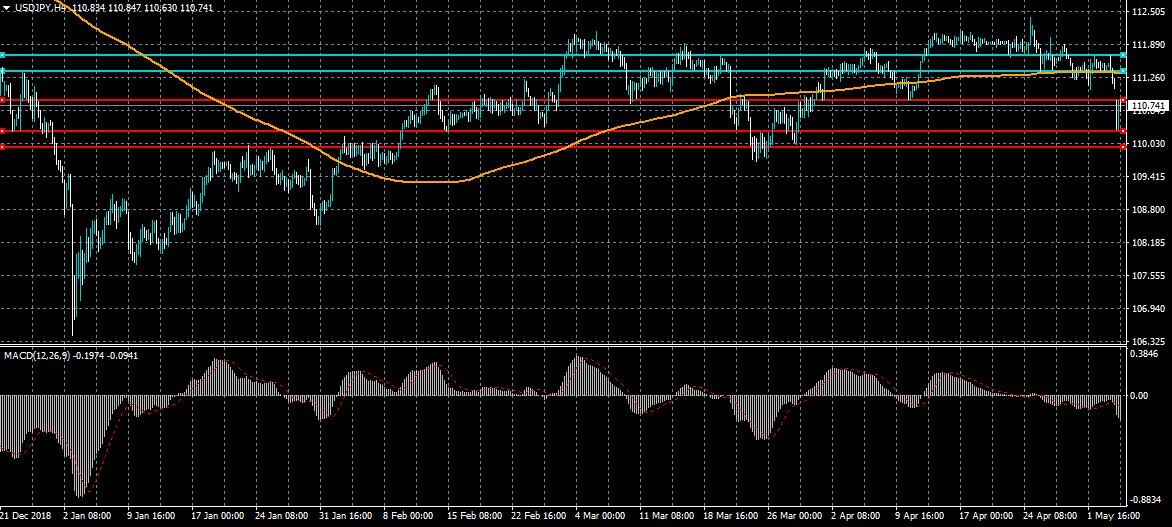
The US dollar is attempting to recover higher against the Japanese yen currency following the earlier heavy sell-off in the risk-sensitive pair. The opening price gap has yet to close on the charts and currently extends towards the 111.24 resistance level. Overall, the USDJPY pair is still at risk of even greater intraday losses while trade below the pivotal 110.90 resistance level.
The USDJPY pair is heavily bearish while trading below the 110.90, key intraday support is found at the 110.40 and 110.00 levels.
If the USDJPY pair trades above the 110.90 level, key intraday resistance remains at the 111.24 and 111.60 levels.
EUR/USD Outlook: Near-Term Action Remains Constructive But Holds Below Pivotal Barrier
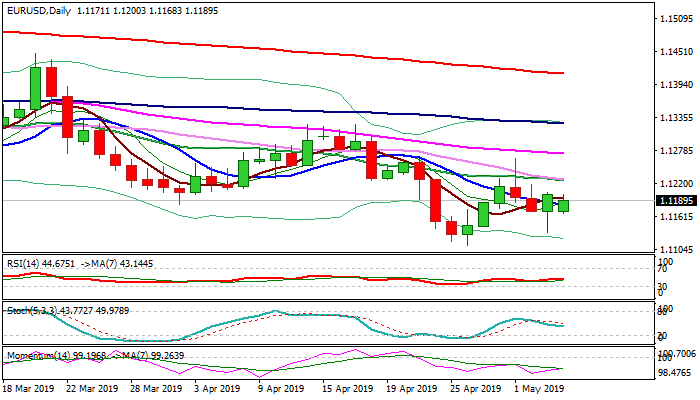
The Euro edged higher and maintains slight positive tone despite overnight's opening with gap-lower after dollar was bought as safe-haven in reaction the most recent comments from President Trump about trade conflict with China.
Near-term action is underpinned by long-tailed bullish candle of Friday, which was left after strong downside rejection post US jobs data.
Fresh recovery attempts eye pivotal barrier at 1.1206 (Friday's high/broken Fibo 38.2% of 1.1111/1.1264), with sustained break higher needed to confirm reversal and shift near-term focus higher.
On the other side, violation of pivotal support at 1.1170 (low of today/last Thu/cracked Fibo 61.8% of 1.1111/1.1264) would generate negative signal and risk attack at key support at 1.1111 (26 Apr low).
Larger picture shows bears still in control, with important barriers at 1.1225/27 (converged falling 20/30SMA) maintaining pressure.
Res: 1.1206, 1.1227, 1.1264, 1.1272
Sup: 1.1170, 1.1134, 1.1111, 1.1075