Sample Category Title
XAU/USD Could Extend Gains
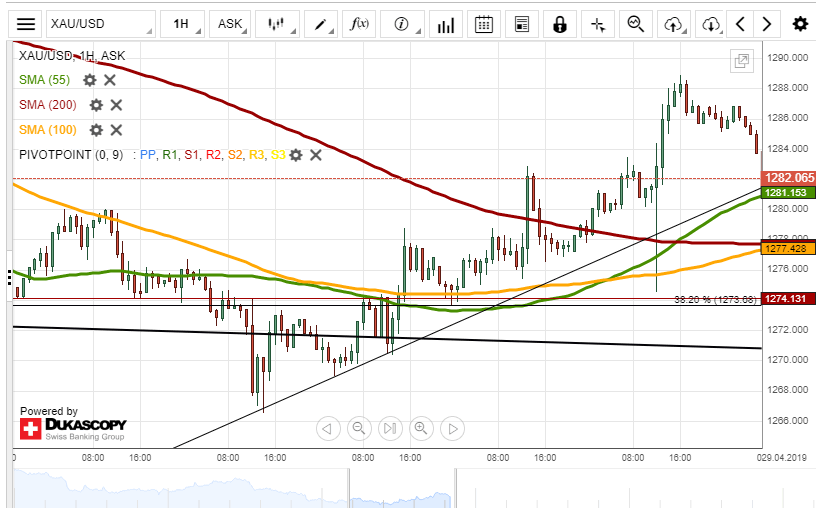
The price for gold reached the psychological level at 1,288.00 and dropped to trend line located at the 1.281.58.
The XAU/USD rate is supported by the 55-hour SMA at 1,281.00, thus, it is likely, that the rate reverses north in the nearest future. It is expected, that gold could try to surpass the given psychological level.
However, if the given support does not hold, it is likely, that the price for gold continues to decline. However, it is unlikely, that the rate could slump lower than 1,278.00 mark due to the support formed by the 100 and 200-hour SMAs.
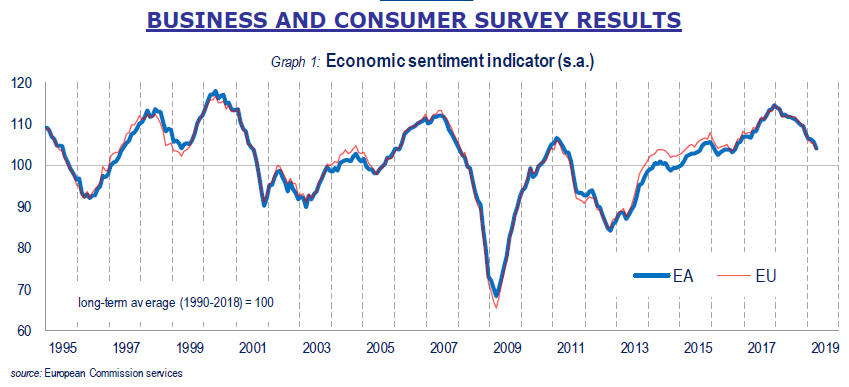
Eurozone economic sentiment dropped to 104.0, decreased in most major countries
Eurozone Economic Sentiment Indicator dropped -1.6 to 104.0 in April, missed expectation of 105.0. Industrial Confidence dropped to -4.1, down from -1.6 and missed expectation of -2.0%. Services Confidence was unchanged at 11.5, matched expectation. Consumer Confidence was finalized at -7.9.
Amongst the largest Eurozone economies, the ESI rose only in the Netherlands (+0.4), while it decreased in France (-1.0) and Italy (-1.0) and, more significantly so, in Germany (-1.5) and Spain (-2.6).
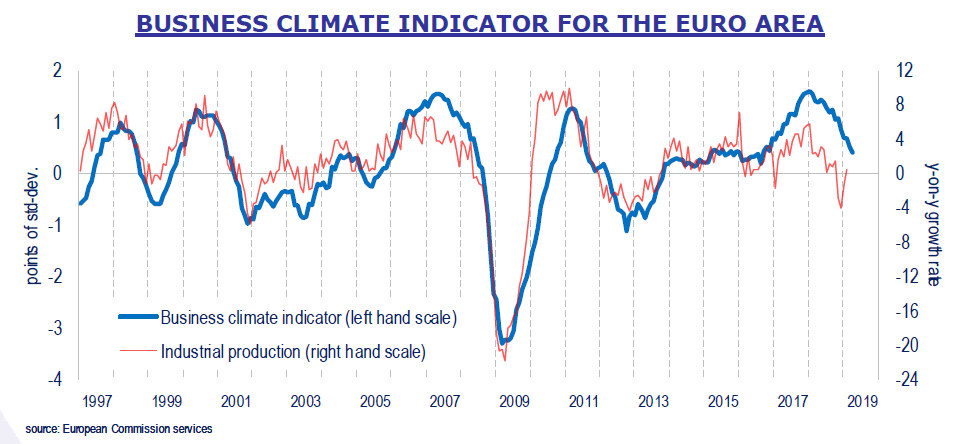
Also released, Eurozone Business Climate Indicator dropped -0.12 to 0.42, below expectation of 0.49. Managers' views of the past production, their production expectations, and their assessments of overall order books and the stocks of finished products declined significantly. Meanwhile, there was some relief in the appraisals of export order books.
US Corporate Earnings To Drive Global Stock Markets Amid Thin Liquidity In Asia
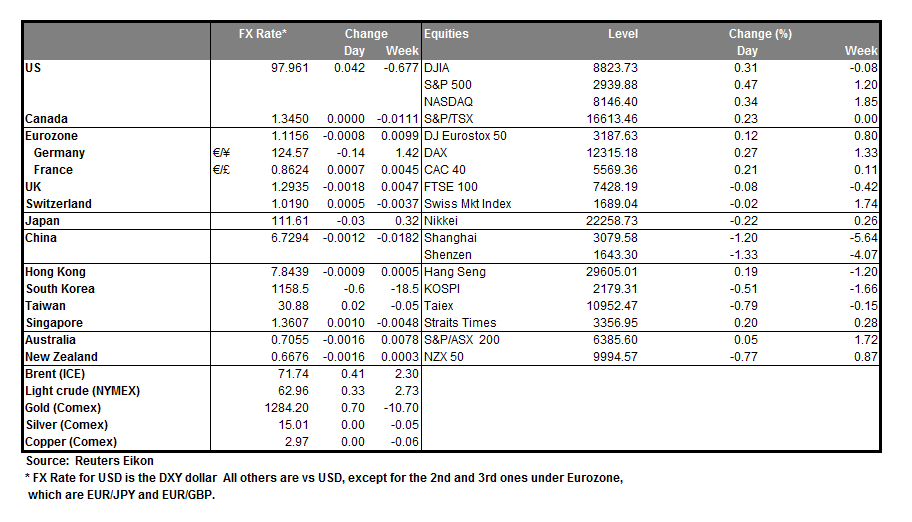
Asian stocks, excluding Japan, are mixed on Monday, even after US stocks posted new record highs following the United States GDP report released at the end of last week. Thin liquidity is expected for Asia this week, as Japanese markets are closed for its Golden Week holidays, while Chinese markets will be closed from Wednesday through to Friday. Still, the ongoing US corporate earnings season is expected to drive sentiment, with tech giants such as Apple and Alphabet kicking off this week's earnings announcements.
Asian currencies gaining against softer Dollar following US Q1 GDP report
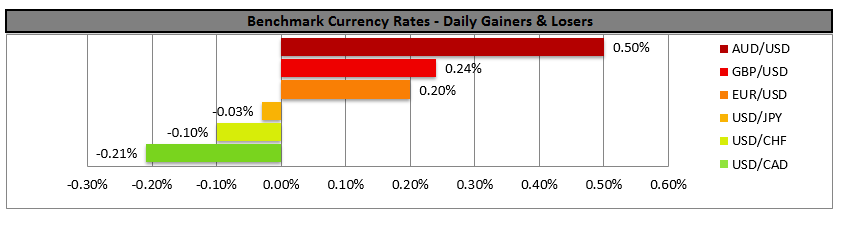
Over in the FX markets, Asian currencies are generally pointing higher in Monday trade, after the US Dollar softened following the release of its Q1 GDP report. The economic print surpassed expectations, with 3.2% annualized growth for the first quarter of 2019, but the impressive headline reading failed to assuage the demands of Dollar buyers, as US consumer spending slowed for a third straight quarter, indicating that underlying domestic demand is waning. More US personal income and spending data will be released later today, which should help investors gain further insights into the primary driver of the US economy, and more softness in consumer expenditure will be seen as a risk for further weakness in the Dollar in the near-term.
Will the Dollar Index resume its climb this week?
A slowdown in US consumer spending might be used as a reason for the Federal Reserve to delay further interest rate increases during its policy meeting scheduled for this week, even as Fed Funds Futures continue to point to more than a 50% chance of a US interest rate cut by October. In the immediate term however, investors could use Monday's release of more inflation numbers to test the central bank's data-dependent stance.
The Dollar Index might have slipped lower from its 2019 high last week, but it could still find reason to climb back above the 98 handle, should April's US non-farm payrolls report due on Friday beat the 185,000 jobs that markets are expecting to be added. Continued job creation in the United States should help allay concerns over the momentum of consumer spending in the world's largest economy.
Gold steady above $1,284 as global investors await key economic data
Concerns over the broader global economic slowdown will be allayed, should Europe's Q1 GDP and China's PMI both show signs of stabilizing when the respective datasets are announced on Tuesday. However, any fresh reminders of soft patches in the global economy following the disappointing data out of both Germany and South Korea last week should encourage some risk to be taken off the table, which should help the appeal of Gold in the near-term.
However, my view is that it might require a string of dismal economic indicators to bring Gold back above the psychological $1,300 mark and reverse the bearish trend seen in Bullion since late-March.
Oil falls away from 2019 high after Trump pressures OPEC to lower prices
Brent futures have dropped below the $72 mark, after tumbling late last week on the back of US President Donald Trump's claim that he personally "spoke to" OPEC to lower Oil prices. The steep decline in prices comes just days after the US administration stated that sanction waivers on Iran's Oil will end later this week, which initially sparked a rally in the value of Oil on the hopes of tighter supplies.
However, uncertainty may prevail over how strictly these waivers will be imposed on Iran and whether other producers, like Saudi Arabia and the United Arab Emirates, will be able to fill the void of a reported 1 million barrels of Oil per day by the time the waivers expire. With the broader narrative of resilient demand and tighter supply in the market encouraging investors to buy Oil, prices can still find the impetus to resume the uptrend seen so far in 2019.
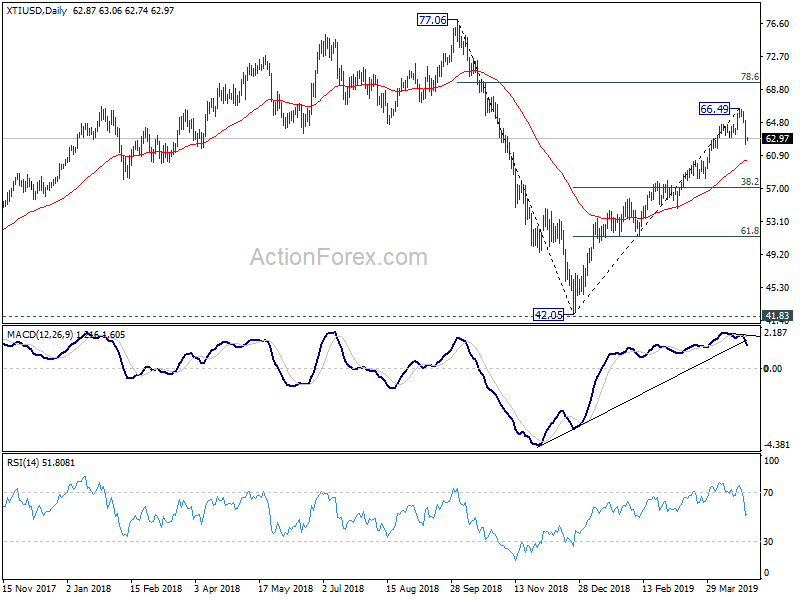
WTI oil in near term consolidation below 66.49, 57.15 fib level to contain downside
WTI crude oil's sharp decline last week suggests short term topping at 66.49, on mild bearish divergence condition in daily MACD. Deeper retreat is in favor towards 55 day EMA (now at 60.41). But we'd expect strong support above 38.2% retracement of 42.05 to 66.49 at 57.15 to contain downside to bring rise resumption.
Rise from 42.05 is seen as a leg inside the sideway pattern from 77.06. Another rally is expected to 78.6% retracement of77.06 to 42.05 at 69.56, which is close to 70 handle, before reversal.
Stocks Hesitating To Move Higher | Gold May See Another Strong Bearish Signal
European markets are trading mixed today. Investors are hesitating to build on the momentum where they left off on Friday due to the record highs on Wall Street. The US benchmarks closed at all time high due to the strong US GDP data. The S&P500 gained 0.47 percent, the Dow Jones index 0.31 percent and the Nasdaq 0.34 percent. The VIX is still down 49% year to date and this clearly shows that the momentum is in favor of riskier assets.
The performance of the Athens Stock Exchange index is the most remarkable and it is under the spotlight. It has outperformed other major indices with a gain of over 25%. Remember this index was the worst performer of 2018, however, the optimism about the economic expansion and political reform have drawn investors.
Socialist Pedro Sanchez has secured victory in Spain. He will remain the prime minister of the country. The prime minister has secured 38 more seats during this election and this means more political stability for the country. This has also saved the Euro from dropping further against the dollar because the last thing that you want to see is geopolitical uncertainty in Spain about Catalan Independence.
As for Brexit, Theresa May is still pursuing some sort of Brexit deal with the lawmakers in order to avoid European elections. If she can reach a deal before the 23rd of May, the UK will not have to participate in the European elections. However, looking at the Labour party's stance and the current negotiation tactics, it doesn't appear to me that any resolution is insight. This is the major reason that the sterling-dollar pair is trading below the critical level of 1.30. As long as we continue to trade below this critical level, the bulls have little to no hope of any sort of recovery.
This particular week is really important for sterling because the Bank of England will make its monetary policy decision and also released its inflation report. The current governor of the Bank of England will no longer be in charge from next year. Mark Carney has already served two terms and his job is advertised by the bank. This creates uncertainty because there is no clue how the new governor will shape up the monetary policy at the bank, and most importantly, his view about Brexit.
As for the trade war between the US and China, the negotiations will resume this week once again. According to the Trump administration, significant issues are still unresolved. I am not sure if this is just another tactic by the administration to pump up the market. This is because we already now that both countries are in the final stages of writing the last chapter of this war. Create pessimism by downplaying the possibility of a deal now will create more optimism when the deal will be done. Perhaps, this is the strategy Trump wants to adopt.
As for the gold market, it appears to me that another strong bearish signal is on the card. The reason is that the 50-day moving average is about to cross the 100-day moving average from the top and if that happens, it is likely for the gold prices to move below the level of $1250. Basically, the strong US GDP number on Friday has taken blood out of the bulls. The situation would only become worse if the US economic data continues to improve at this pace. The possibility of a rate cut has become faded somewhat and if the upcoming US NFP number also shows a strong reading, it would only improve the odds of this scenario becoming a reality.
USD Steadies Ahead Of Fed’s Interest Rate Decision
The USD steadied against its counterparts on Friday and during today's Asian session as the markets prepare for the Fed's interest rate decision. The boost provided by the unexpectedly high acceleration of the US GDP, proved to be short-lived and could puzzle analysts in the coming days. The US-Japanese trade talks, seem to be on a good way as US president Trump stated that he sees the possibility for a deal by May. Also hopes seem to be running high for the next round of the US-Sino negotiations which are to restart on the 30th of April. We could see the USD maintain a sideways movement unless there are surprises in the greenback's fundamentals. Also some volatility could be expected from today's financial releases. EUR/USD maintained mainly a sideways movement on Friday and during today's Asian session, as it remained between the 1.1175 (R1) resistance line and the 1.1125 (S1) support line. We could see the pair maintaining that movement, yet it should be noted that the pair could prove sensitive to today's financial releases which could affect both sides of the pair. Should the pair come under the selling interest of the market we could see it breaking the 1.1125 (S1) support line and aim for the 1.1075 (S2) support level. Should the pair find extensive buying orders along its path, we could see it breaking the 1.1175 (R1) resistance line and aim for the 1.1220 (R2) resistance level.
Oil fell after Trump urged OPEC for greater output
Oil prices tumbled on Friday as US president Trump demanded that OPEC raises its output levels, in order to counterbalance the impact of US sanctions on Iran. The US president told reporters on Friday that he called OPEC and told them that they've got to bring oil prices down. Analysts point out that it may very well be in the interests of OPEC as well as Russia, to actually raise production levels. In the meantime it seems to be the case that Russia, hopes to restore oil supplies in central and Western Europe after the supply was suspended for quality issues. Should we see a confirmation by OPEC or Russia, of increasing their production levels, we could see oil prices dropping even further. WTI prices tumbled on Friday, breaking the 63.80 (R1) support line (now turned to resistance) and the upward trendline incepted since the 26th of December 2018, aiming for the 62.00 (S1) support level, yet stabilized above it. As the upward trendline was broken, we switch our bullish view for black gold's prices, for a bias in a sideways movement, yet at the same time suspect that the bears maybe just around the corner. Should the bears actually take over e could see WTI prices breaking the 62.00 (S1) support line and aim for the 60.50 (S2) support level. Should the bulls take over, we could see oil prices breaking the 63.80 (R1) resistance line and aim for the 65.30 (R2) resistance level.
Other economic highlights, today and early tomorrow
Today during the European session, we get a number of finance releases about the Eurozone, yet we tend to single out April's industrial sentiment for April. In the American session from the US we get the core PCE prices and personal spending growth rates for February. In tomorrow's Asian session, we get China's NBS manufacturing PMI for April.
As for the rest of the week
On Tuesday, we get from Germany April's unemployment data, the GFK Consumer climate for May and HICP preliminary rate for April, Eurozone's preliminary GDP for Q1 and unemployment rate for March, Canada's GDP for February, the US CB Consumer Sentiment for April and New Zealand's employment data for Q1. On Wednesday, we get the UK Mfg PMI for April, the US ISM Mfg PMI for April, the Fed's interest rate decision and China's Caixin Mfg PMI for April. On Thursday, we get the UK construction PMI for April and BoE's interest rate decision, and later we get the US factory orders growth rate for March. On Friday, we get the UK services PMI for April, Eurozone's preliminary CPI for April, and the US employment report for April and the ISM Non-Mfg PMI for April.
EUR/USD H4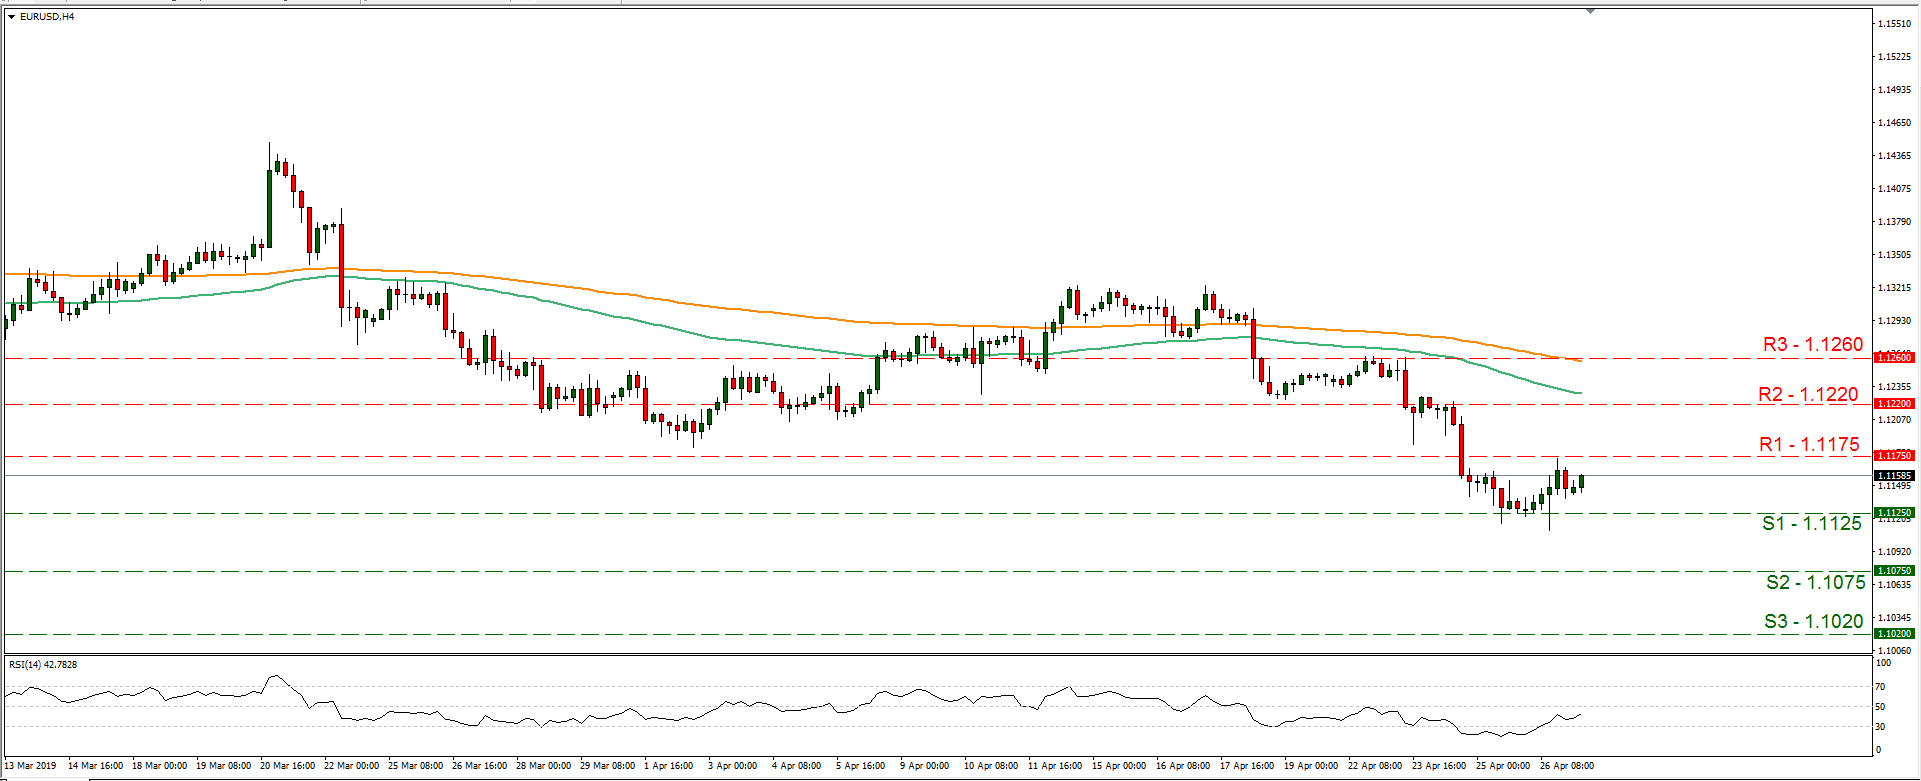
Support: 1.1125 (S1), 1.1075 (S2), 1.1020 (S3)
Resistance: 1.1175 (R1), 1.1220 (R2), 1.1260 (R3)
WTI H4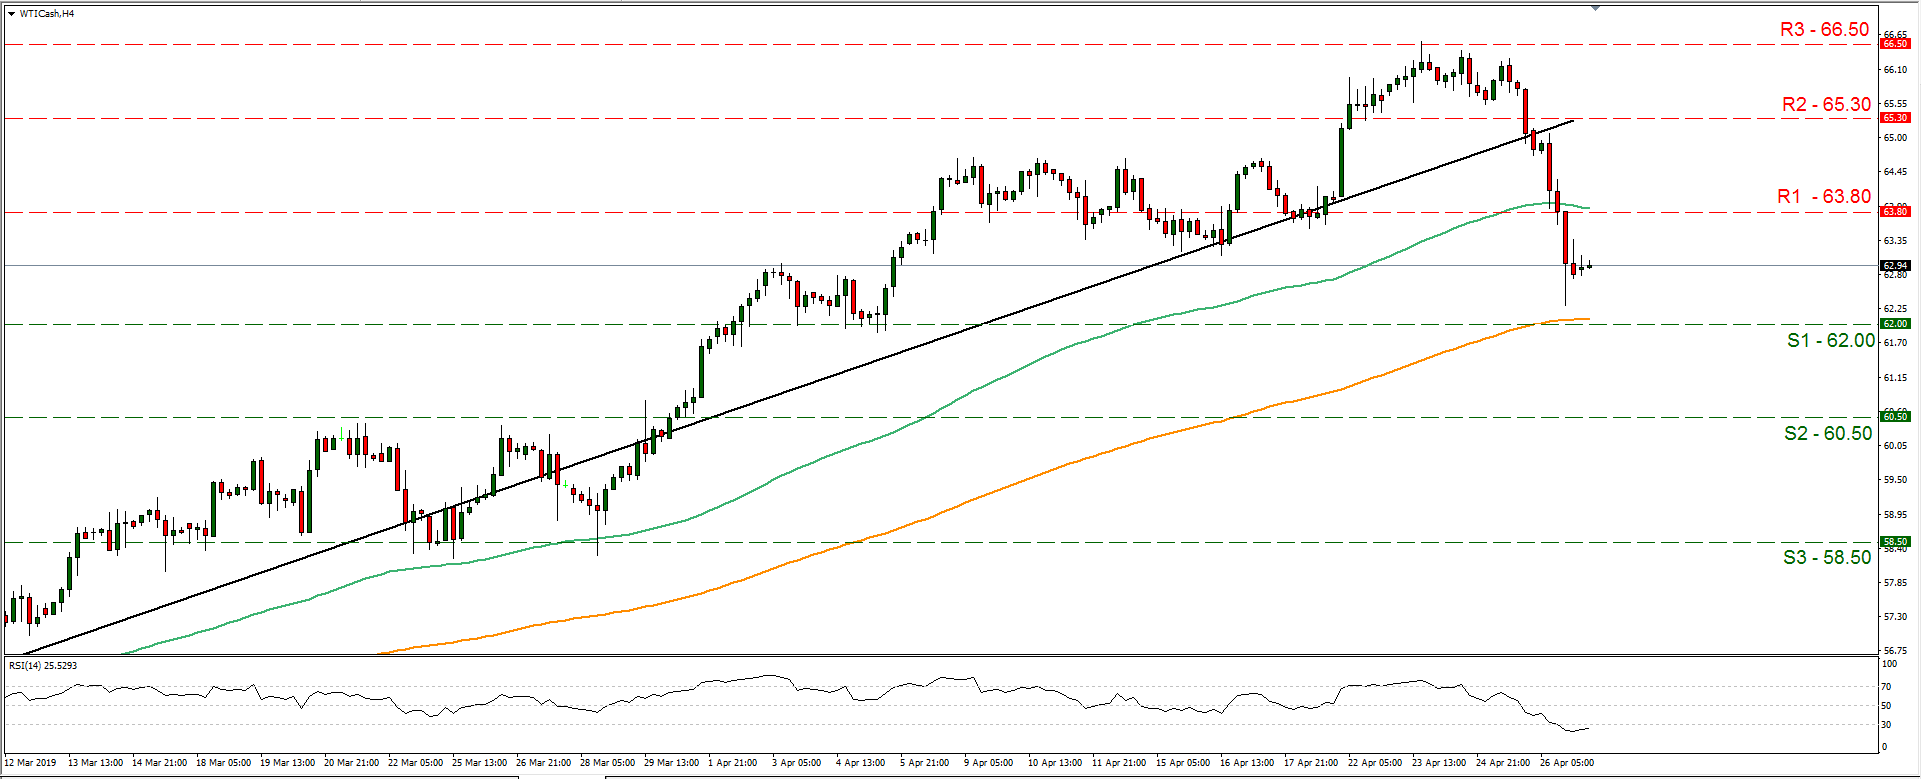
Support: 62.00 (S1), 60.50 (S2), 58.50 (S3)
Resistance: 63.80 (R1), 65.30 (R2), 66.50 (R3)
Case for RBA Rate Cut Strengthens But We Still Favour August Over May for the First Move
On February 21, Westpac Economics indicated that we believe that there is a case for two RBA rate cuts in 2019 – with the likely timing to be in August and November.
The recent March quarter CPI data reinforced our view that there is a case for rate cuts.
The debate is around when the RBA will come to this view as well.
The Reserve Bank Board meets next week on May 7.
As we stated on February 21, we anticipate that the RBA Board will adopt a clear easing bias at the May meeting, prior to cutting rates by 25bps in August and in November.
That view was predicated on the Reserve Bank lowering its growth forecasts at the meeting, to trend in 2019 (2.75% from 3%) and below trend (2.5%) in 2020.
The "below trend" forecast for growth in 2020 follows from the consistent view from the Bank that the growth rate in 2020 will be below growth in 2019 by 0.25% due to "resource exports after 2019 will be at historically high levels contributing little to GDP growth," (SOMP, February 2019).
"At trend growth" in 2019 is not sufficient to trigger a rate cut immediately but we expected that by August, when the next set of growth revisions would be made, the growth forecasts would need to be lowered further (to 2.5% in 2019 and 2.25% in 2020).
With underlying inflation persistently below the bottom of the 2–3% target band; growth forecast below trend and in conjunction with an existing explicit easing bias the case for a rate cut would be indisputable.
The emphasis in our analysis was around growth but we also confirmed an outlook of a gradual lift in the unemployment rate and underlying inflation persistently below the 2–3% band.
In research recently released we have also cast light on the so called "labour market/ growth puzzle," pointing out that employment growth in cyclical industries (60% of the labour market) is already negative, although, being offset, for now, by the noncyclical sectors – government; health; education; utilities; and parts of professional services, which rely heavily on government spending.
We believe this process is largely playing out although acknowledge that the labour market (due to the cyclical/noncyclical imbalance) is somewhat stronger than expected.
However, once the Bank accepts that growth is likely to under shoot trend it should revise back its expected unemployment profile.
On the other hand, the recent March quarter inflation print was lower than we had anticipated.
Nevertheless, we expect that the Board will proceed along the lines we forecast in February with rates being on hold at the May meeting but adopting a clear easing bias.
Markets are priced 50/50 for a cut next week largely in response to the March quarter inflation report so we should consider this issue.
We expect that the revised inflation forecasts that will be released in the Statement on Monetary Policy on May 10 will show a "trimmed mean" forecast (note that the Bank is now forecasting "trimmed mean" in the tables rather than underlying inflation, which is the average of trimmed mean and weighted median) of 1.50% for 2019 and 2.00% for 2020.
It is important to note that the "trimmed mean" printed 0.3% in March above the 0.1% of the weighted median so the "shock" to the forecast will not be as great as the "average" measure.
That will be a down grade in the forecast from the February SOMP in the "trimmed mean" to 1.50% from 2.0% in 2019; 2.0% from 2.25% in 2020 and 2.25% (steady) in 2021 (to June).
This decision on the trimmed mean forecasts for 2019 and 2020 will be important for the timing of the rate cuts and the decision on the policy bias.
Note that the February SOMP adopted a 2% forecast for trimmed mean in 2019 (down from 2.25% in November 2018, when growth in 2019 was forecast at an extravagant 3.5%).
With the March quarter trimmed mean printing 0.3% the RBA could forecast either 1.5% or 1.75% for 2019. That would be on the basis of a 0.4% in the June quarter to be followed by a couple of 0.4's/0.5's in September and December. It is a line ball situation but the 2020 forecast is still likely to be 2.0% consistent with the gradually increasing theme.
Westpac assesses that a credible "trimmed mean "forecast would be 1.5% and consistent with the Bank adopting an easing bias.
The core rhetoric that the labour market will continue to tighten; pressuring wages; and eventually inflation will be emphasised and justify the lift to, say 0.5% in the December quarter, consistent with a 2% pace in 2020.
We are sceptical that such a dynamic can be relied upon in an economy that is growing below trend - we forecast GDP growth in 2019 and 2020 at 2.2%.
2019 is NOT like 2016
The markets are likely to be relying heavily on the precedent of 2016 for their "early" rate cut view. But there are considerable differences.
Recall that in 2016, following the March Inflation Report which printed underlying inflation at 0.2% for the quarter (market and RBA expectations of 0.6%) the RBA cut immediately at its May Board meeting.
Consider the differences:
- The underlying inflation forecast for 2016 was cut from 2.5% to 1.5% – a full 1.0% reduction (compared to the expected 0.5% reduction in 2019).
- The Board had an explicit easing bias going into the meeting: "Continued low inflation would provide scope to ease monetary policy further, should that be appropriate to lend support to demand" (April meeting). The current bias is not an explicit easing bias.
- There is a new Governor. Governor Stevens was clearly uncomfortable forecasting underlying inflation below the bottom of the 2–3% band – he had not been required to do that at any time throughout his tenure. Governor Lowe had been forecasting underlying inflation for 2018 below the 2–3% band for around half the time in 2017 and 2018
- In fact, in June last year he noted: "To try to get it back to 2.5 very quickly, it would be mainly through people borrowing more money, and having higher asset prices – I think that's a much bigger risk to our economy than people having surprisingly low inflation expectations" (ECB Forum on Central Banking, June 2018).
The housing market is much more fragile than in 2016 and we see little risk in any over reaction by housing to rate cuts (as we saw in 2016) but Governor Lowe may remain cautious, for a little longer, given his strong emphasis on asset markets.
Politics
A decision to begin a new rate cut cycle 10 days out from a Federal election will be difficult. The precedents in previous elections are not relevant, although the Bank will be apolitical in its decision process.
There has been some media speculation around the cut announced on August 6, 2013, before the September 7. There was a month of "clear air" before the election and it was the second stage of a cycle that began in May 2013.
Conclusion
The RBA is on track for two rate cuts and we favour August and November.
We think that a move next week will be a little early for the RBA.
In the Statement on Monetary Policy, which will be released on May 10, we expect that the key 2019 forecasts for growth (2.75%) and trimmed mean (1.5%) will have been be revised down (from 3% and 2% in February respectively) while the 4.75% unemployment forecast (by 2020) will be retained.
Those revisions will be sufficient to justify a clear easing bias (which is not currently present).
We expect that by August the growth forecasts for 2019 will be lowered further to 2.5% and the trimmed mean forecast for 2020 will be lowered from 2% to 1.75% while the unemployment rate forecast will also be lifted.
That will be sufficient to trigger the series of rate cuts which we expect for August and November.
EUR/GBP Daily Outlook
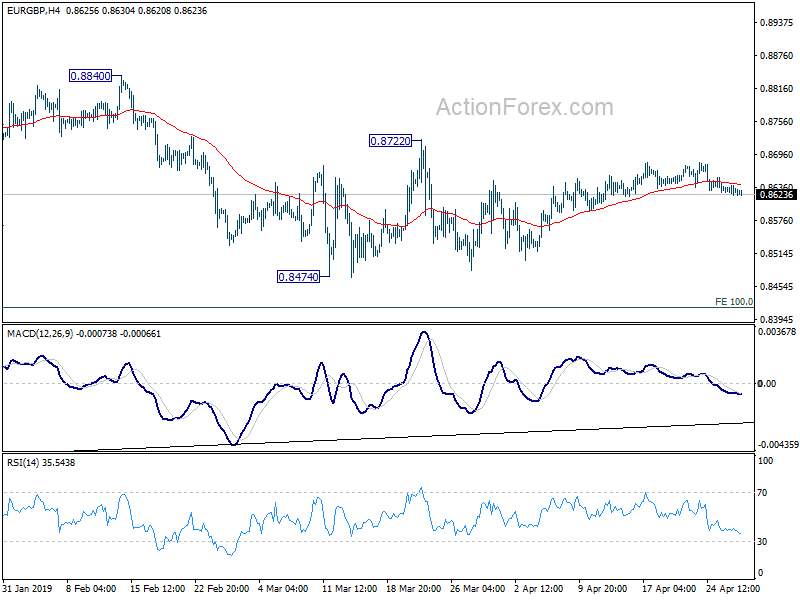
Daily Pivots: (S1) 0.8623; (P) 0.8631; (R1) 0.8641; More...
Intraday bias in EUR/GBP remains neutral and outlook is unchanged. Consolidation from 0.8474 is still in progress and could extend further. In case of another rise, upside should be limited by 0.8722 resistance. On the downside, firm break of 0.8474 will resume larger down trend for 0.8416 long term projection next. On the upside, though, sustained break of 0.8722 will suggest near term reversal and bring stronger rise back to 0.8840 resistance and above.
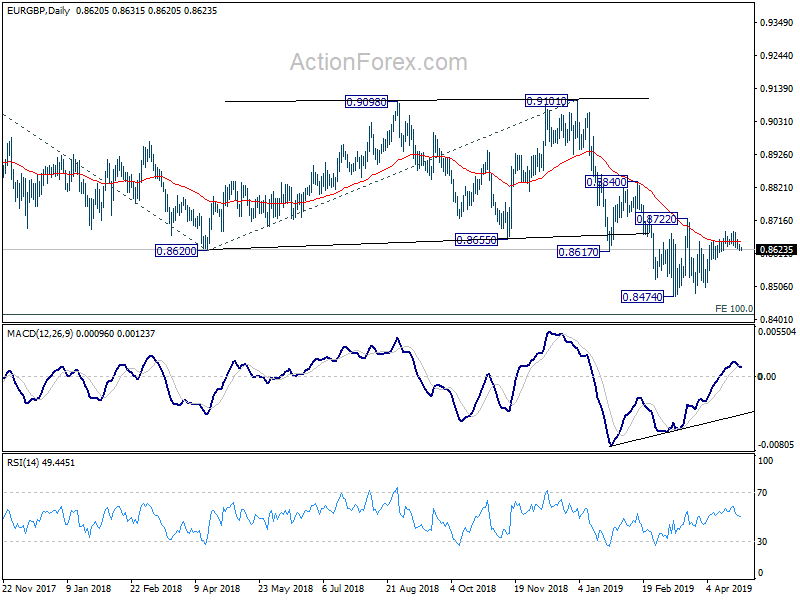
In the bigger picture, EUR/GBP is seen as staying in long term range pattern started at 0.9304 (2016 high). Current fall from 0.9305 (2017 high) is a falling leg inside the pattern. Such decline could extend to 100% projection of 0.9305 to 0.8620 from 0.9101 at 0.8416 and possibly below. But for now, we'd expect strong support around 0.8312 support to contain downside and bring rebound.
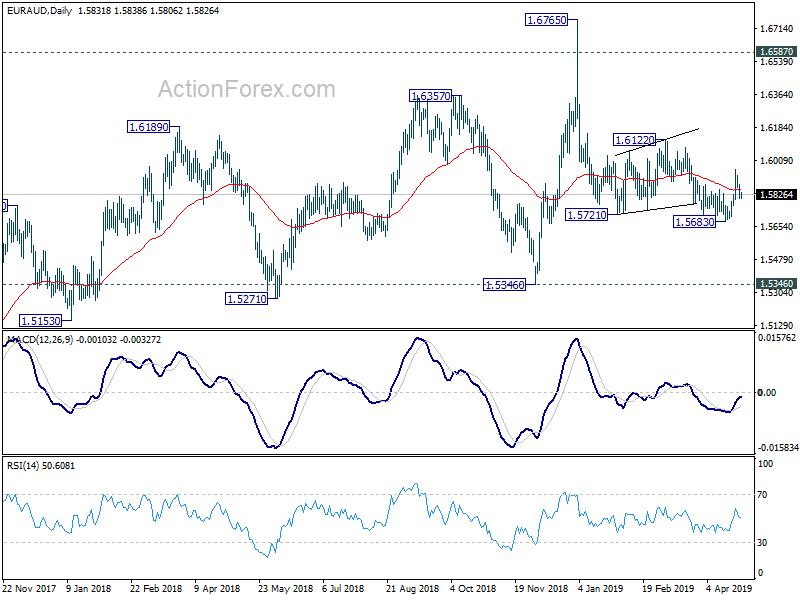
EUR/AUD Daily Outlook
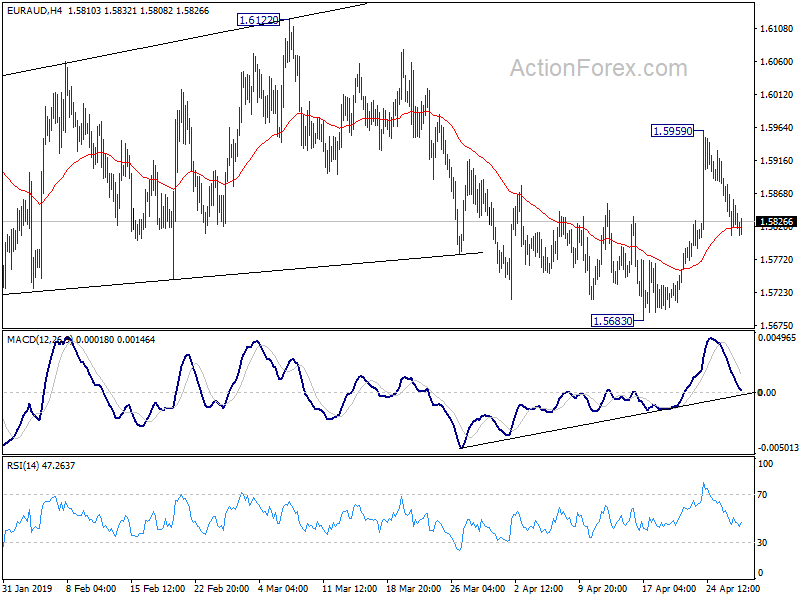
Daily Pivots: (S1) 1.5799; (P) 1.5842; (R1) 1.5882; More...
Intraday bias in EUR/AUD remains mildly on the downside for retesting 1.5683 low. At this point, we're still slightly favoring the bullish case that correction from 1.6765 has completed with three waves down to 1.5683. Thus, downside of current retreat should be contained above 1.5683 to bring rise resumption. On the upside, above 1.5959 will target 1.6122 resistance to confirm our bullish view.
In the bigger picture, as long as 1.5346 support holds, outlook will still remain bullish. Uptrend from 1.1602 (2012 low) is expected to resume sooner or later. Break of 1.6765 will target 61.8% retracement of 2.1127 (2008 high) to 1.1602 at 1.7488 next. However, firm break of 1.5346 key support will indicate trend reversal, with bearish divergence condition in weekly MACD, and turn outlook bearish.
BTCUSD $4,900 Critical Support
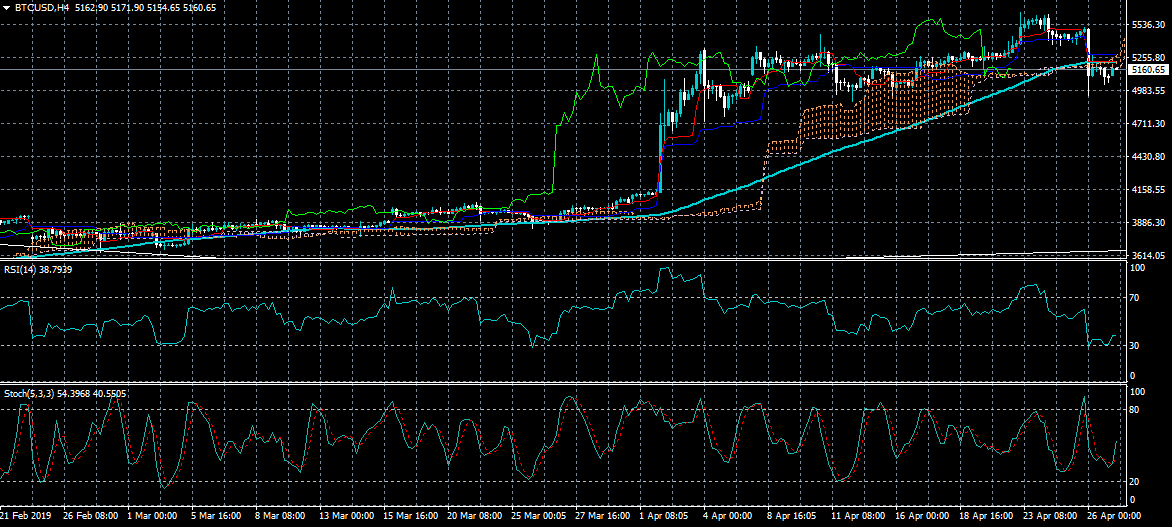
Bitcoin is attempting to correct higher in early week trade after the BTCUSD pair found strong support from the $4,930 level last week. Buyers need to move the BTCUSD pair above the $5,200 level in order to regain bullish short-term trading momentum. Daily price closes above the $5,260 level should also encourage further gains, while daily price closes below the $4,930 level should be taken as bearish.
The BTCUSD pair is only bullish while trading above the $5,200 level, key intraday resistance is found at the $5,400 and $5,620 levels.
If the BTCUSD pair trades under the $5,200 level, sellers may test towards the $4,900 and $4,750 support levels.