

Sample Category Title
GER30 Index Rallies To 6-Month High, Some Fragility Expected In Short Term
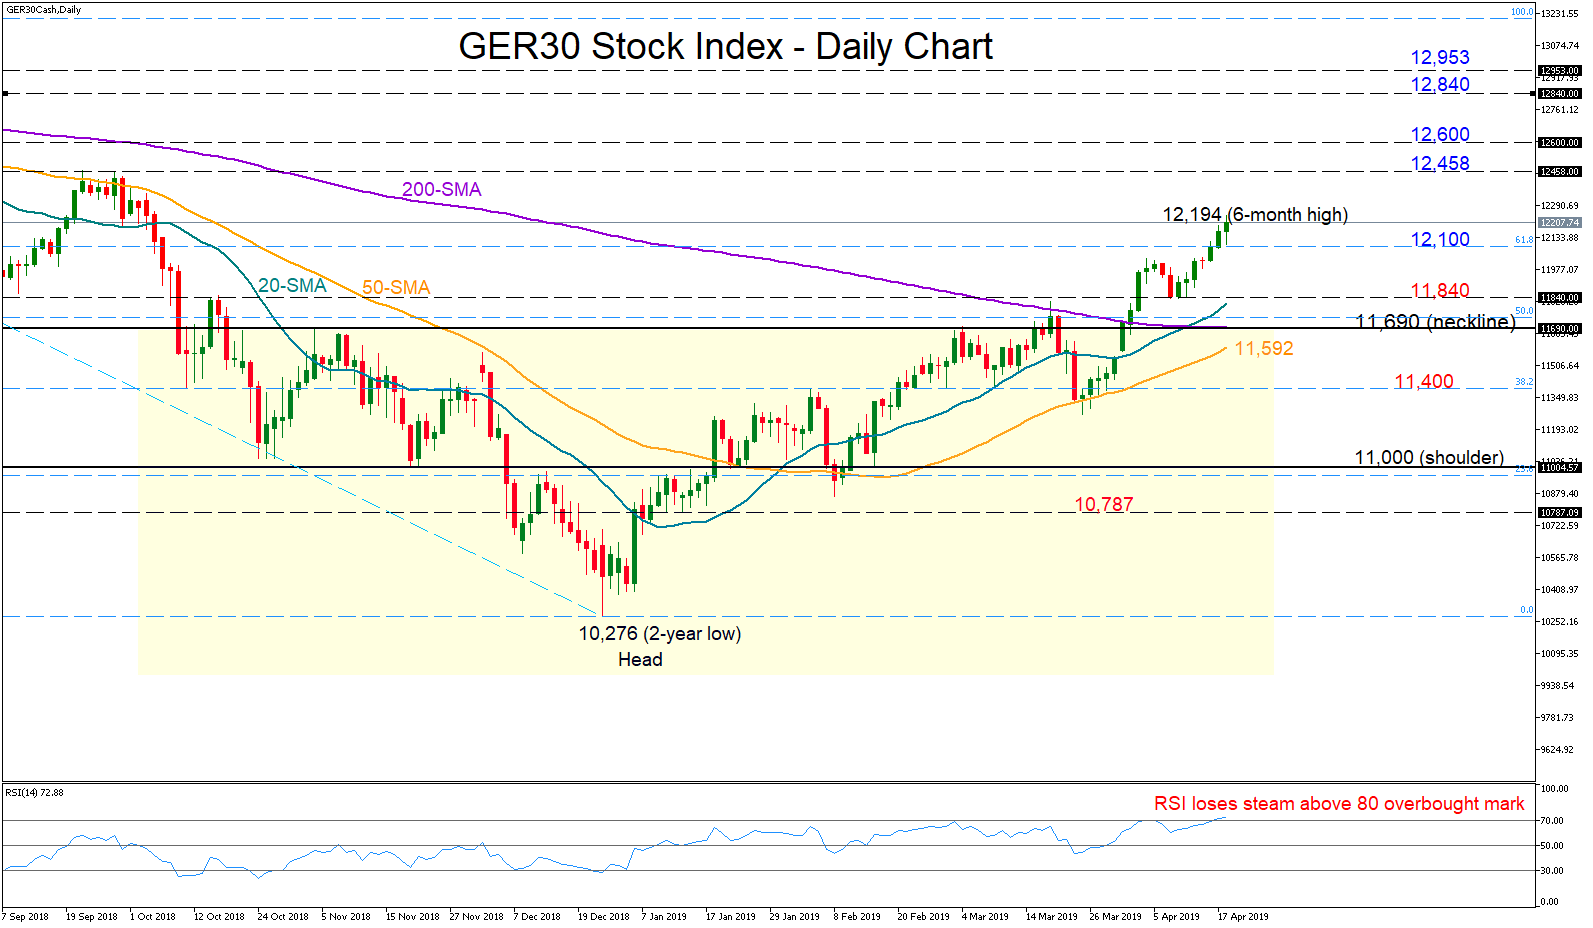
Germany 30 cash index (GER30) gained considerable traction after breaking the neckline (11,690) of the inverted head and shoulders pattern earlier this month, topping the rally at a six-month high of 12,194 on Wednesday. While, the RSI warns of an overbought market that could pressure the price lower in the short term, the uptrend off the 10,276 bottom may stay in place as long as the price continues to trade well above its simple moving averages (SMA).
The bulls would aim for the 12,458-12,600 resistance area if the market keeps upside momentum above 12,100. Moving higher, a crucial barrier is standing between 12,840 and 12,953, identified by the highs in 2017.
On the downside and below 12,000, immediate support could be detected near 11,840, while another leg lower would open the door for the 200-day SMA currently attached to the neckline of 11,690 and close to a former strong restrictive zone in 2018. Should the bears beat that wall, which is also slightly below the 50% Fibonacci of the long downleg from 13,205 to 10,275, sharper declines may emerge probably towards 11,400 (38.2% Fibonacci).
In the medium-term picture, the outlook is bullish as well given the higher highs and the higher lows from the 10,276 bottom. All eyes, however, are on the 50- and the 200-day SMAs since those seem to be planning for a bearish crossover.
The Analytical Overview Of The Main Currency Pairs
The EUR/USD currency pair
Technical indicators of the currency pair:
Prev Open: 1.12812
Open: 1.12931
% chg. over the last day: +0.17
Day's range: 1.12924 – 1.13040
52 wk range: 1.1214 – 1.2557
Trading actiivity and volatility lowered on all major currency pairs due to upcoming holidays. EUR remains in a flat. The key support and resistance levels are 1.12800-1.13200. The investors are waiting for important economic releases which acan affect the majors' short-term dynamic. You should open positions from these levels.
The Economic News Feed for 18.04.2019:
Business Activity Index in the Industrial Sector (GER) – 10:30 (GMT+3:00);
An Array of Business Activity Indices (EU) – 11:00 (GMT+3:00);
Industrial Activity Index by FR of Philadelphia (US) – 15:30 (GMT+3:00);
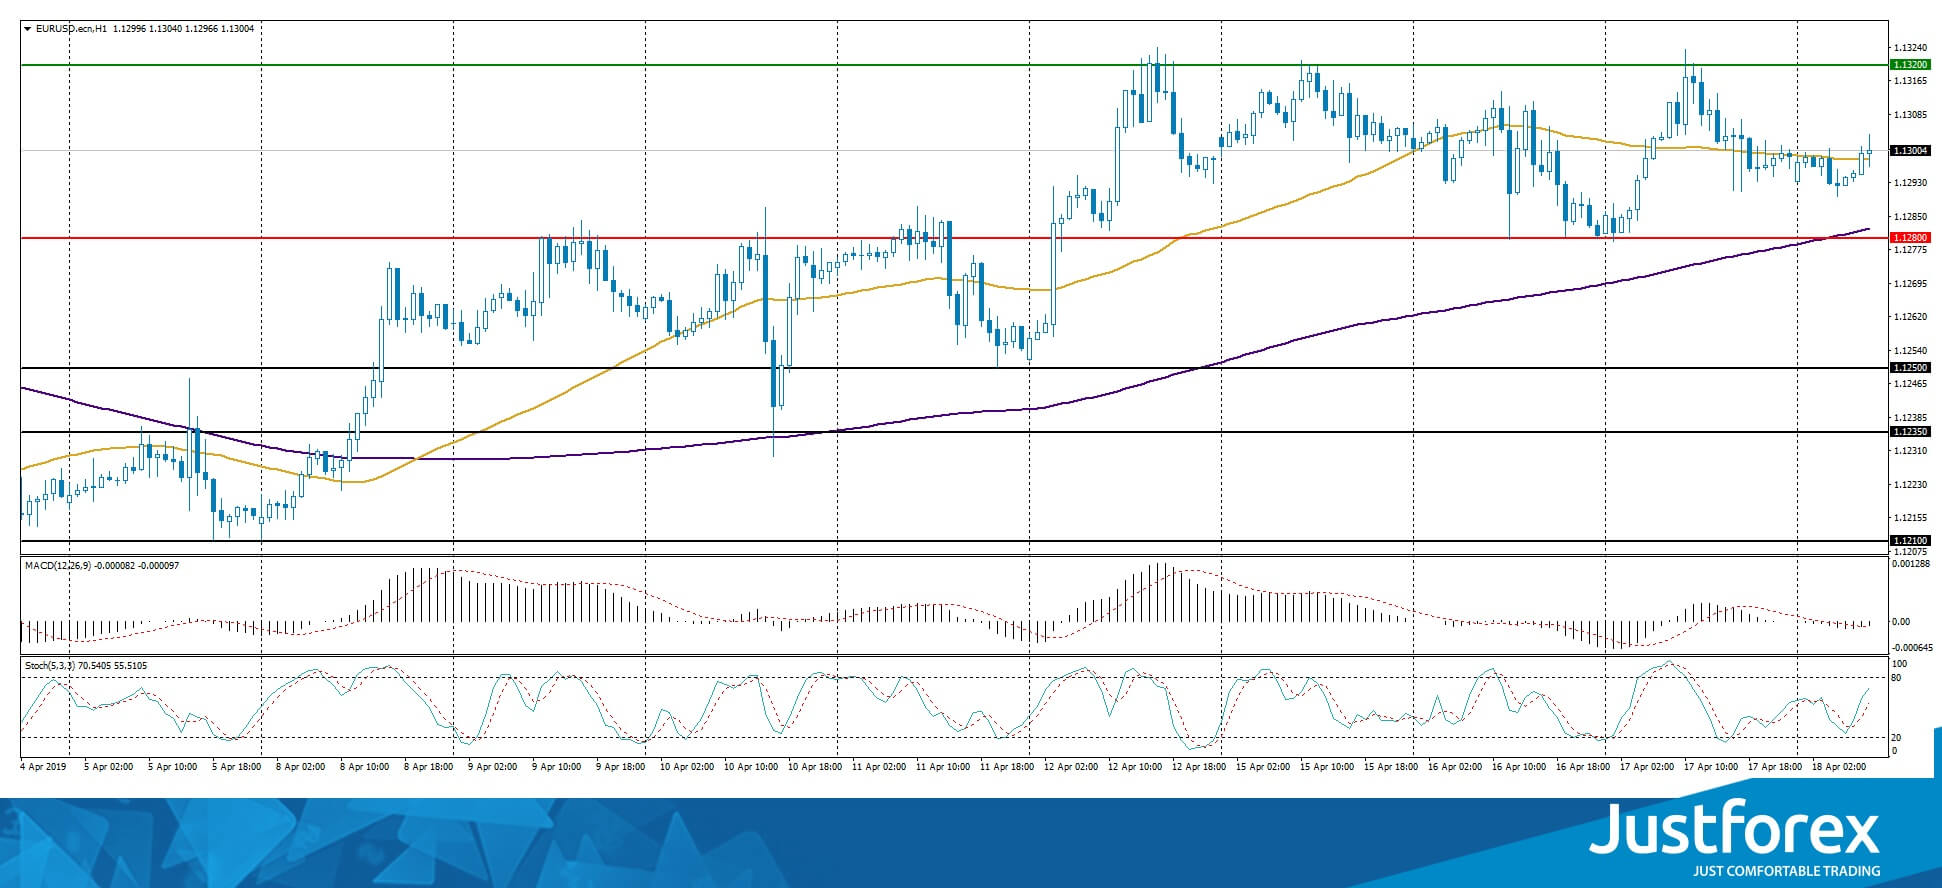
The indicators do not provide precise signals, the price has crossed 50 MA.
The MACD histogram is close to 0.
The Stochastic Oscillator is close to the neutral zone, the %K line is above the %D line which points to the bullish mood.
Trading recommendations
Support levels: 1.12800, 1.12500, 1.12350
Resistance levels: 1.13200, 1.13500, 1.14000
If the price fixes above 1.13200, expect further growth toward 1.13500-1.13800.
Alternatively, EUR/USD can fall toward 1.12600-1.12400.
The GBP/USD currency pair
Technical indicators of the currency pair:
Prev Open: 1.30483
Open: 1.30360
% chg. over the last day: -0.08
Day's range: 1.30196 – 1.30525
52 wk range: 1.2438 – 1.4378
GBP/USD remains ambiguous. The UK National Statistic Service reported that in March the Consumer Price Index reached 1.9% (annually) which is lower than the 2% target value set by the Bank of England. Right now the market participants are waiting for additional drivers with the key support levels being 1.30150 and 1.30500. Keep an eye on important statistic reports from the UK and the US and open positions from the key levels.
At 11:30 (GMT+3) the UK will publish reports on the retail sales for March.
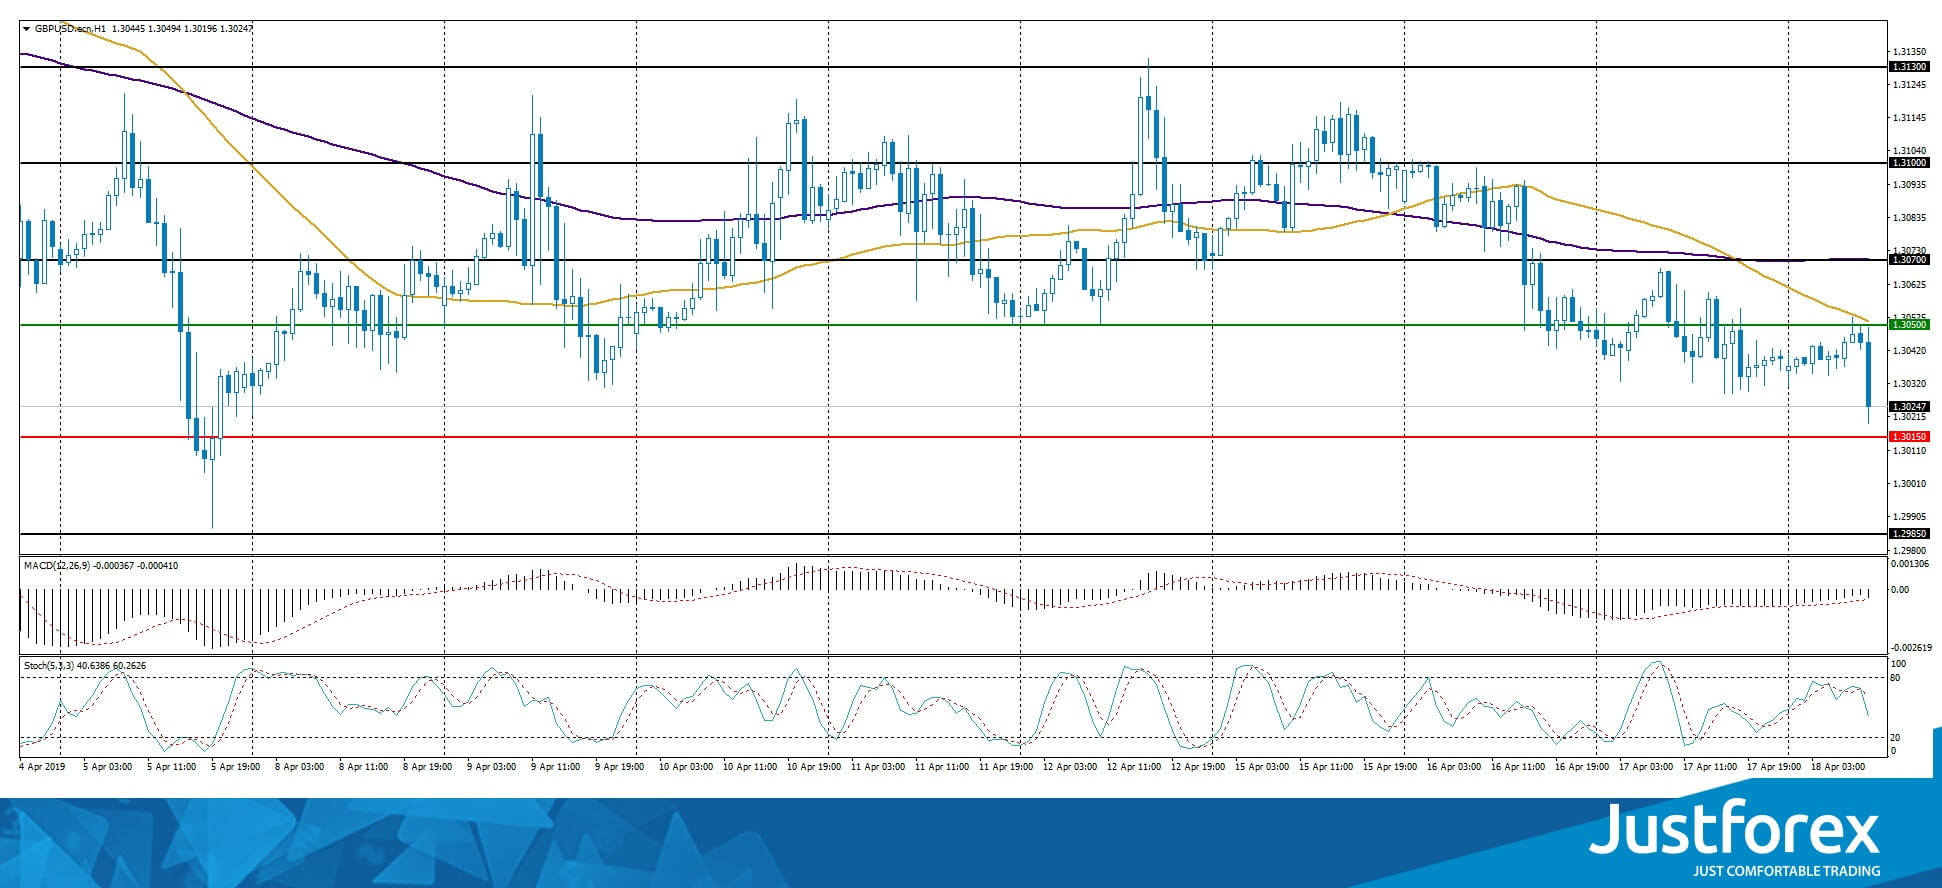
The price fixed below 50 MA and 200 MA which points to the power of the sellers.
The MACD histogram is in the negative zone and keeps falling which gives a strong signal to sell GBP/USD.
The Stochastic Oscillator is in the neutral zone, the %K line is below the %D line which points towards a bearish mood.
Trading recommendations
Support levels: 1.30150, 1.29850
Resistance levels: 1.30500, 1.30700, 1.31000
If the price fixes below 1.30150, expect further descend towards 1.29850-1.29700.
Alternatively, the quotes can recover towards 1.30700-1.31000.
The USD/CAD currency pair
Technical indicators of the currency pair:
Prev Open: 1.33492
Open: 1.33410
% chg. over the last day: -0.02
Day's range: 1.33326 – 1.33712
52 wk range: 1.2248 – 1.3664
The last sessions on USD/CAD have been very active but didn't have a defined trend. Right now the technical picture is ambiguous. The local support and resistance levels are 1.33400-1.33700. The investors are waiting for important economic reports. Keep an eye on the oil quotes dynamics and open positions from the key levels.
At 15:30 (GMT+3:00) Canada will publish a report on the retail sales.
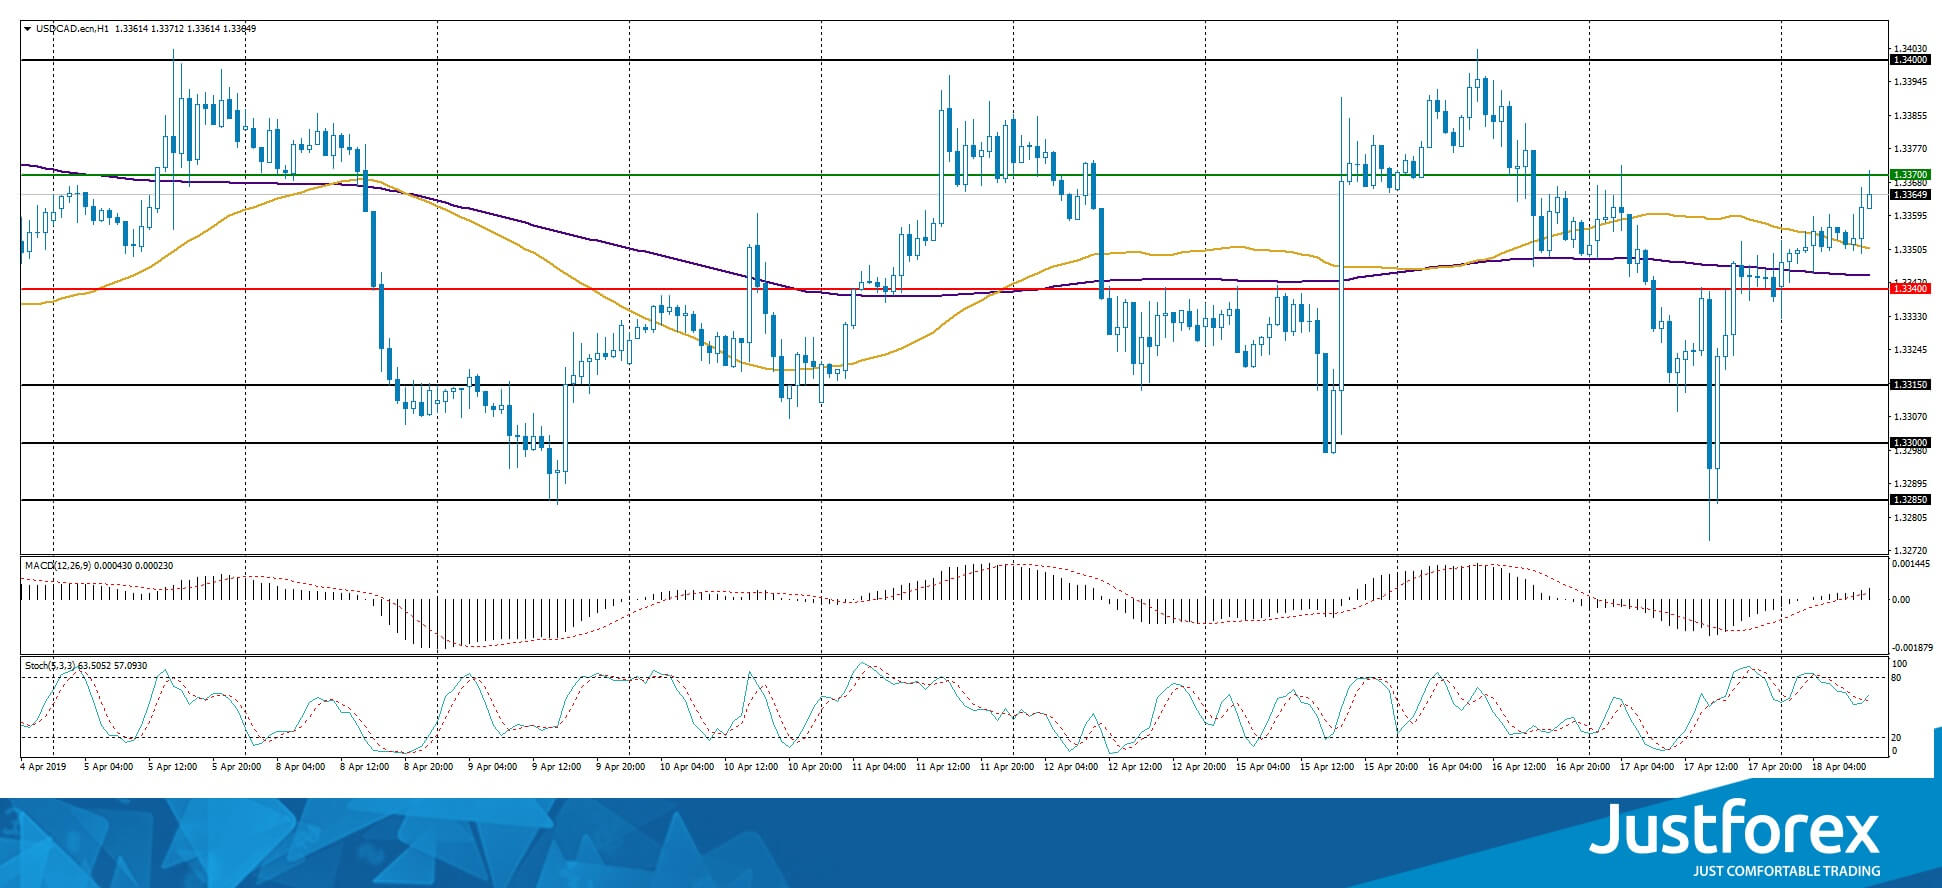
The indicators do not provide precise signals: 50 MA started to cross 200 MA.
The MACD histogram is in the positive zone and keeps rising which points toward a bullish mood.
The Stochastic Oscillator is in the neutral zone, the %K line is crossing the %D line. There are no signals at the moment.
Trading recommendations
Support levels: 1.33400, 1.33150, 1.33000
Resistance levels: 1.33700, 1.34000
If the price fixes above 1.33700, expect the quotes to rise toward 1.34000.
Alternatively, the quotes can fall toward 1.33200-1.33000.
The USD/JPY currency pair
Technical indicators of the currency pair:
Prev Open: 111.995
Open: 112.053
% chg. over the last day: +0.03
Day's range: 111.766 – 112.062
52 wk range: 104.56 – 114.56
The safe haven currency remains in a flat. There is no defined trend. The investors are waiting for additional drivers. The USD/JPY quotes are testing the key levels at 111.800-112.100. You should keep an eye on the dynamics of the US Treasury bonds` yield and open positions from the key levels.
The Economic News Feed for 18.04.2019:
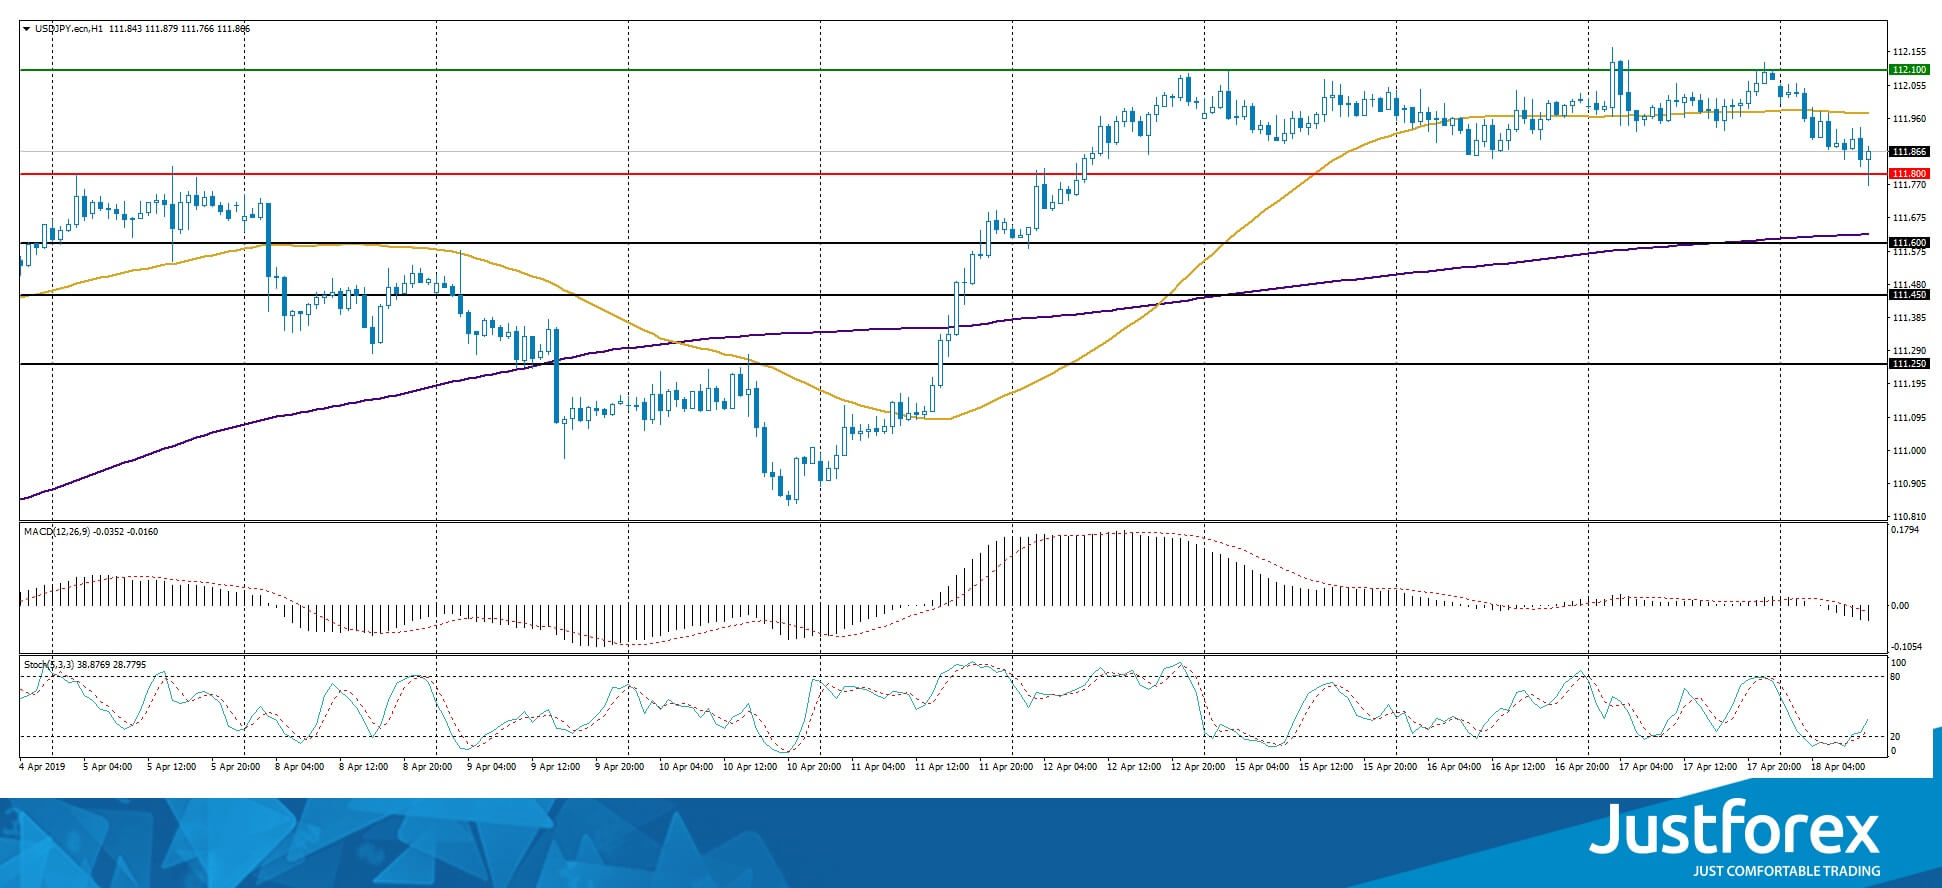
The indicators do not provide precise signals, the price fixed between 50 MA and 200 MA.
The MACD histogram is in the negative zone which points towards a beginning of the correction move.
The Stochastic Oscillator started to leave the oversold zone, the %K line is above the %D line which points towards buying USD/JPY.
Trading recommendations
Support levels: 111.800, 111.600, 111.450
Resistance levels: 112.100, 112.500, 112.750
If the price fixes below 111.800, expect a correction towards 111.600-111.400.
Alternatively, the quotes can grow toward 112.300-112.500.
NZD/USD Decline Continues
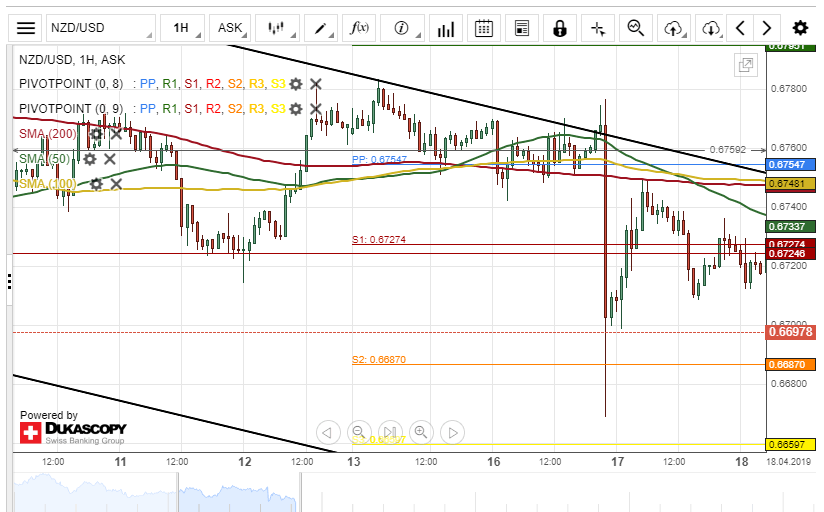
The New Zealand Dollar tested a resistance cluster formed by the combination of the weekly and the monthly pivot points at 0.6724 during the first part of Thursday's trading session.
If the given resistance cluster holds, the exchange rate will aim for a level at 0.6668 within this session.
However, if bulls surpass the resistance cluster as mentioned earlier, the next targets for bullish traders will be near the 100– and 200-hour SMAs at 0.6748.
Meanwhile, technical indicators demonstrate that the decline of the NZD/USD pair will continue today.
EUR/JPY Tests 50– And 100-Hour SMAs
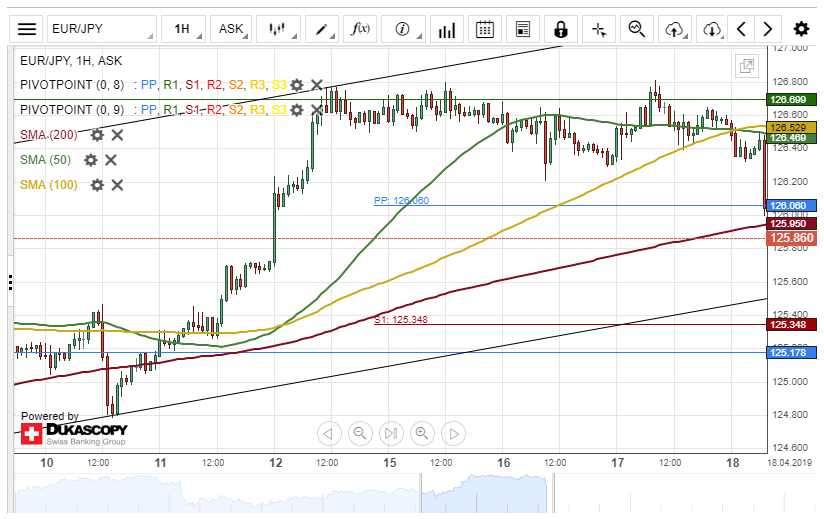
As apparent on the 1(H) chart, the common European currency versus the Japanese Yen tried to surpass a resistance level at 126.69 during Wednesday's trading session.
Given that the 50– and 100-hour simple moving averages are providing resistance for the exchange rate near the 126.53 area, it is expected that the pair decline within this session.
If the currency exchange rate passes the resistance cluster, t is likely some upside potential prevails in the market today.
Meanwhile, technical indicators flash bullish signals on both the 4(H) and daily time frames chart.
AUD/USD Strong Bearish Momentum Today
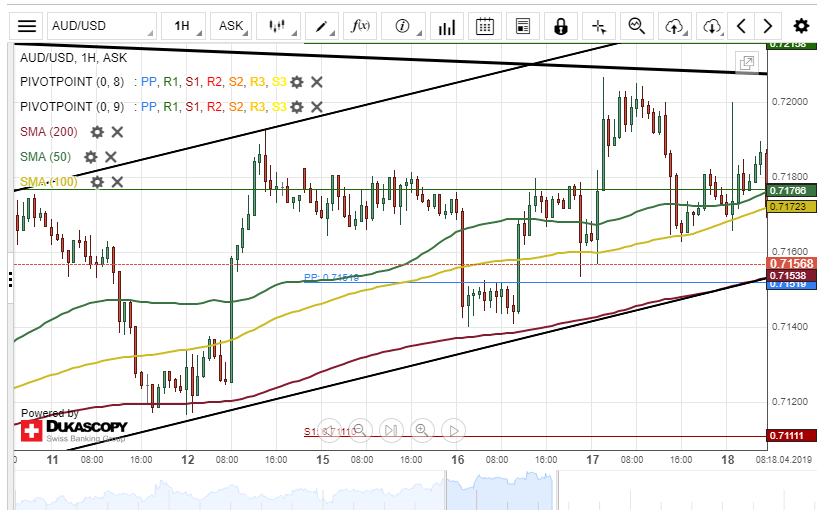
During Wednesday's trading session, the 100-hour simple moving average provided support for Australian Dollar versus the US Dollar. The currency pair re-tested the moving average during the first half of today's session.
However, strong bearish momentum broke the support level set by the 100-hour SMA on Thursday.
By and large, it is likely that bearish traders could push the exchange rate towards the lower line of an ascending channel pattern at 0.7153.
If the ascending channel pattern holds, a reversal north could be expected within this trading session
USD/CAD Supported By Three SMAs
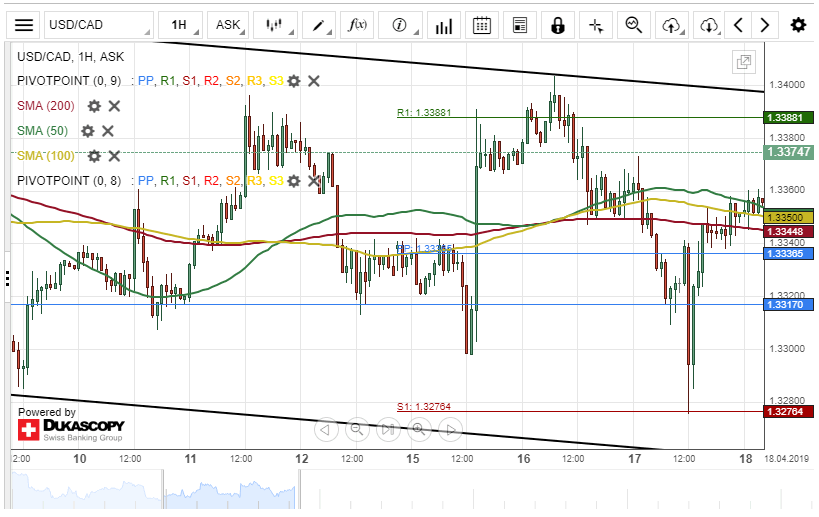
The weekly support level at 1.3276 has propelled the US Dollar by 0.70% increase in value against the Canadian Dollar on Wednesday. The surge was stopped by a resistance cluster formed by the three simple moving averages at 1.3350.
Most likely, the upside momentum could continue during the following trading session. The potential targets for bullish traders will be at the upper boundary of a descending channel pattern at 1.3400.
On the other hand, the USD/CAD currency exchange rate might reverse from the current price level at 1.3360 and aim for a re-tests of the weekly S1 at 1.3276.
GBPUSD Targeting 1.2985
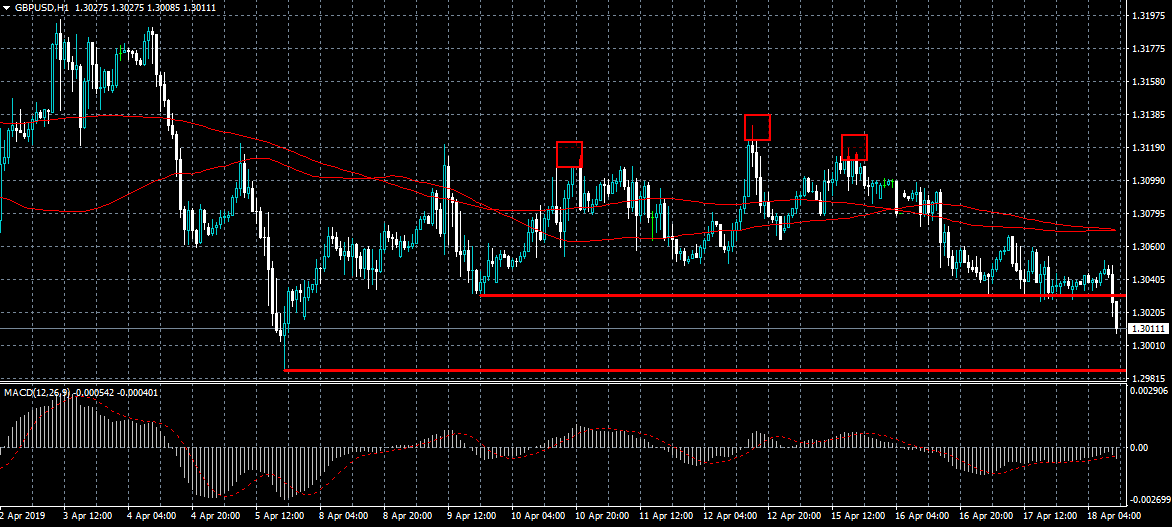
The British pound has come under further downside pressure against the US dollar during the European trading session despite better than expected United Kingdom Retail Sales data. The GBPUSD pair has now moved below the neckline of the head and shoulders pattern. GBPUSD sellers are now likely to target a technical breakout below the important 1.2985 support level.
The GBPUSD pair is bearish while trading below the 1.3030 level, key support is found at the 1.2985 and 1.2940 levels.
If the GBPUSD pair trades above 1.3030 level, key intraday resistance is found at the 1.3065 and 1.3100 levels.
EURUSD Turns Bearish
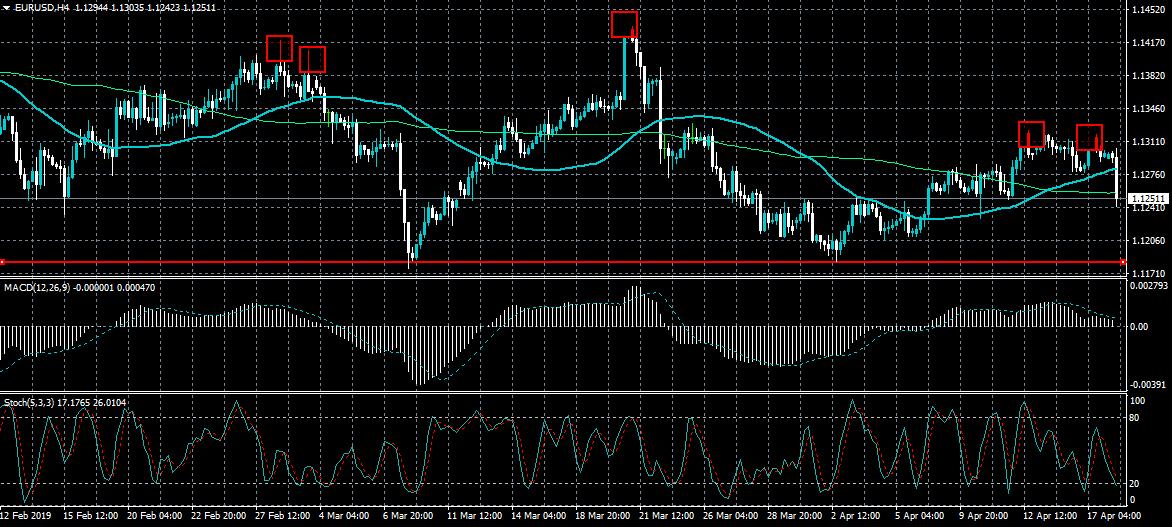
The euro has moved sharply lower against the US dollar during the European session after EU PMI Manufacturing data came in much weaker than expected. The EURUSD pair is now testing the key 1.1250 support level after failing through the pivotal 1.1290 level. The four-hour time frame is showing a head and shoulders pattern with neckline support around the 1.1175 level.
The EURUSD pair is bearish while trading below the 1.1290 level, key technical support is found at the 1.1216 and 1.1175 levels.
If the EURUSD pair trades above 1.1290 level, key intraday resistance is found at the 1.1315 and 1.1330 resistance levels.
USDCHF Moves Towards Upper Level Of Ascending Triangle
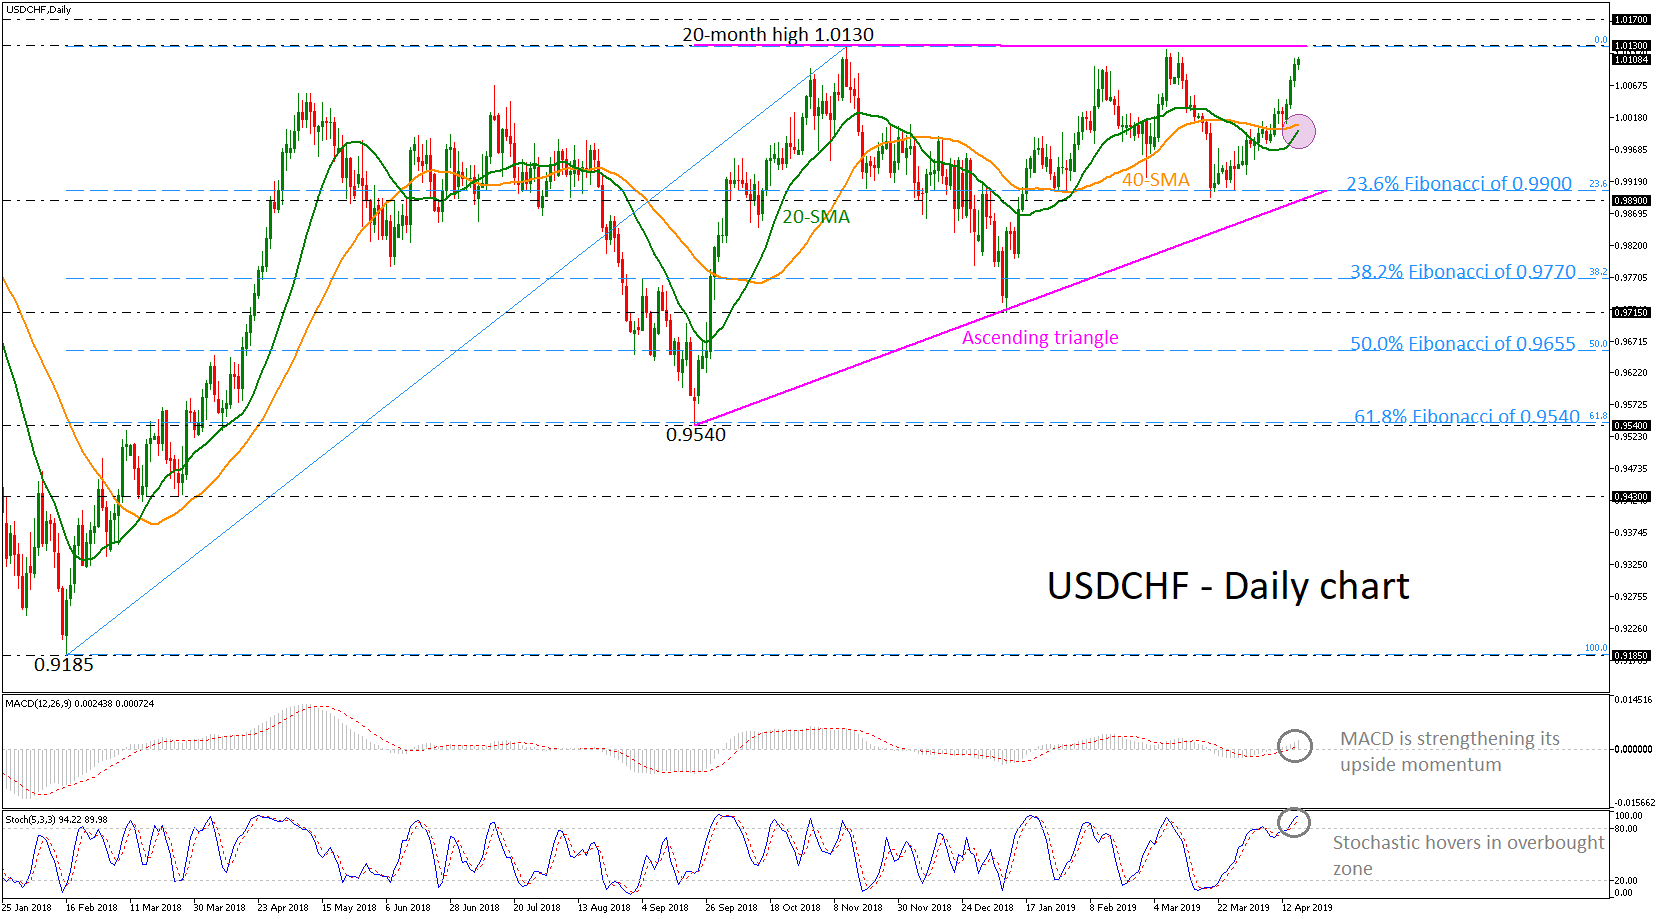
USDCHF is edging higher after the rebound on the 0.9890 support and the 23.6% Fibonacci retracement level of the upleg from 0.9185 to 1.0130, around 0.9900 and is moving towards the strong resistance obstacle of the ascending triangle, which has been holding since September 2018. The 20- and 40-day simple moving averages (SMAs) are ready for a bullish crossover, confirming the recent upward movement.
Technically, the MACD oscillator is strengthening its momentum above the trigger and zero lines, however, the stochastic oscillator is holding in the overbought territory, signaling possible downside retracement.
Immediate resistance could be faced near the 20-month high of 1.0130, which is acting as a significant barrier and only a close above this level could endorse further bullish actions, taking the price to 1.0170. More gains could lead the pair until the 1.0340 barrier, identified by the peak on December 2016.
On the other hand, a downside reversal would likely retest the 40- and then the 20-SMA around 1.0000, while even lower the 23.6% Fibonacci region of 0.9900 and the 0.9890 support level would come into focus. A drop below this area could confirm a bearish rally until the 38.2% Fibonacci of 0.9770.
In the long-term outlook retains a bullish structure, while in the medium-term, USDCHF has been stuck in an ascending triangle formation, which is a continuation pattern of the upward movement.
German Data Misses, AUD Unemployment Stable
Is this the end of the rally?
The day started out quietly with limited trading action during the Asian session. The last employment report from Australia didn’t rock the boat as it came in line with market expectations. In March, the unemployment rate stabilised at 5% as the employment change increased by 25.7k, beating expectations of 15k, while previous month’s figure was upwardly revised to 10.7k. AUD/USD appreciated temporarily and tumbled on the $0.72 threshold before easing to around 0.7170.
However, it didn’t take long before the party begins. The publication of weak manufacturing data sent the market in full risk-off mode. The single currency took a hit of 60pips and it slid to 1.1250 as Germany manufacturing PMI missed expectations of 45 and printed at 44.5. Services PMI was better than expected though as it came in at 55.6 versus 55 expected. Finally, the composite measure rose to 52.1 from 51.4 in the previous month. Over the last few weeks, the euro was struggling to climb its way back from 1.1184 (low from April 2nd) to 1.1324 (high from April 17th) as investors started to discount arguments for faster growth in the US and anticipated further dovish decision from the Fed.
Nevertheless, the European Central Bank has also decided to perform a dovish turn and has therefore started to discard any rate rise in the near term. At its latest meeting, the ECB launched fresh round of TLTROs (cheap financing for banks) and downgraded its growth forecast. Lately, the Governing Council is assessing the eventuality of expanding the current stimulus. Against such a backdrop, we estimate that the single currency would struggle to move higher. Indeed, over the last couple of weeks the risk sentiment was excellent and investors rushed to buy risky assets such as equities; however, the euro was barely able to consolidate over that period. We believe that the equity bull-run is about to take a break as investors take profit. This would inevitably trigger a risk-off switch, which would most likely impact the FX market.