Sample Category Title
Turkey is Slowly Becoming Argentina
The Turkish lira fell under immense pressure after the Financial Times reported the Turkish central bank (CBRT) used billions of dollars in short-term borrowing to bulk out its reserves. At one point, the lira was down 2% to the dollar, the lowest levels since October 2018. Concerns remain high on government’s management of their finances and comparisons are being drawn that Turkey could become Argentina.
Turkey may be too sure that they can fight off any future lira crisis, but if the reserve data continues to remain low, Turkey could in trouble. The net reserves stood at $28.7 billion last week, but when you pull out the short-term swaps, it ended up being only $16 billion.
Turkey is in a recession and if we see further weakness from the eurozone, we could see further strains on Turkey’s economic data in the next couple months. Turkey can still finance their internal position, but we could see this go in to panic mode if their situation continues to deteriorate.
EURUSD Tumbles On Price Sell Off
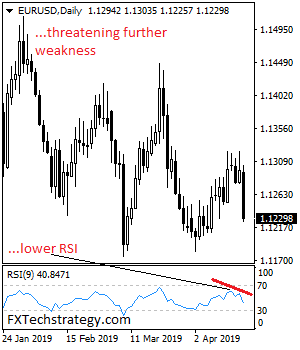
EURUSD tumbles on price sell off as it look to extend more weakness. Support comes in at the 1.1200 where a violation will turn risk to the 1.1150 level. A break below here will target the 1.1100 level. Further down, support sits at the 1.1050. Its daily RSI is bearish and pointing lower suggesting further weakness. Conversely, on the upside, resistance resides at 1.1300 level with a break through there opening the door for further upside towards the 1.1.1350 level. Further up, resistance comes in at the 1.1400 level where a violation will expose the 1.1450 level. All in all, EURUSD continues to threaten further downside pressure on price sell off.
Eco Data 4/19/19
[php_everywhere instance="1"]
Forward Guidance: Bank of Canada Will Officially Shift to a Neutral Bias Next Week
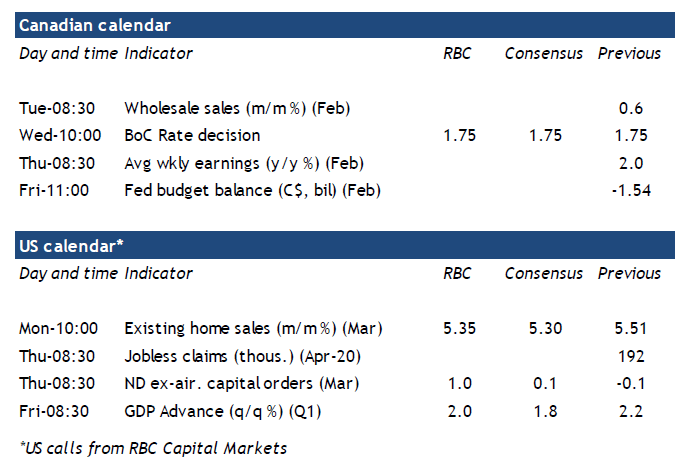
Next week is all about the Bank of Canada. While no one expects a change in interest rates, hopes are Wednesday's policy statement and Monetary Policy Report will provide clues into just how long the central bank might remain on the sidelines. A run of soft economic data—including this week's Business Outlook Survey—have given Governor Poloz and Co. plenty of cover to take a more dovish stance. The BoC barely clung to a tightening bias in its March statement, noting that accommodative policy was still warranted and that the timing of future rate hikes was increasingly uncertain. Recent comments from Governing Council have emphasized the first part of that guidance—that conditions call for the BoC's policy rate to stay below its longer-run neutral range, currently pegged at 2.5-3.5%. We expect the BoC will make its shift to a neutral policy bias official by dropping any reference to future rate hikes. And to end the policy statement by again emphasizing its dependence on data, with a particular focus on oil markets, household spending, and global trade policy. Given recent disappointing home sales, we wouldn't be surprised if developments in the Canadian housing market were added to that list. The shift to a neutral bias shouldn't come as a surprise to investors who are already pricing in some chance of a rate cut by the end of the year.
April's MPR will include fresh economic projections. The BoC was slightly ahead of other forecasters in predicting slower global growth this year, so its global GDP forecast likely won't change significantly. Its US projection looks about right even with more moderate growth to start the year (Q1 GDP to be released next Friday); only its euro-area forecast stands out as overly optimistic. Domestically, a greater-than-expected slowdown over the winter should see the central bank cut its 2019 Canadian GDP forecast from 1.7%, likely closer to our 1.5% call. We think its forecast will continue to show a return to above-trend growth later this year as the drag from the energy and housing sectors eases. An eventual closing of the output gap may well be consistent with more neutral monetary policy over time. However, the combination of slower credit growth, limited inflationary pressure, and a dovish shift from other central banks leaves little urgency to raise interest rates further. Our forecast assumes the BoC will be on hold through 2020.
Australia & New Zealand Weekly
Week beginning 22 April 2019
- Some insights into RBA's employment puzzle. Cyclical jobs are slowing; supporting rate cut.
- Australia: Q1 CPI, trade prices. Easter Monday and ANZAC Day public holiday.
- NZ: trade balance.
- US: Q1 GDP, consumer sentiment.
- Central banks: BoJ and BoC policy decisions.
- Key economic & financial forecasts.
Information contained in this report current as at 17 April 2019.
Some insights into RBA's employment puzzle Cyclical jobs are slowing; supporting rate cut
The minutes of the April monetary policy meeting of the Reserve Bank Board have provided the clearest signal yet that the Bank would be prepared to cut the cash rate.
Firstly, the final section "Considerations for Monetary Policy" states "a lower level of interest rates could still be expected to support the economy through a depreciation of the exchange rate and via reducing required interest payments on borrowing, freeing up cash for other expenditure".
The Board even sets out the conditions for a rate cut, "members also discussed the scenario where inflation did not move any higher and unemployment trended up, noting that a decrease in the cash rate would likely be appropriate in these circumstances".
Recently the latest quarterly breakdown of employment by industry printed for the year to February.
We have considered this industry breakdown to try to find some insights into the RBA's "tension" between the GDP and Employment Reports.
For a start it is reasonable to separate out the employment data into "cyclical" and "non-cyclical" sectors.
We have looked at "non-cyclical" covering: public administration; education and training; health care; and utilities.
Cyclical sectors are considered to be the other thirteen including: construction; manufacturing; retail and wholesale trade; accommodation; transport; finance; mining; real estate; recreation; and media.
The "non-cyclical "group has increased as a proportion of total employment from 27.9% in February 2008 to 31.9% in February 2019. That 4% increase in share represents 510,000 jobs in today's workforce.
The cyclical group has fallen as a proportion of the workforce from 64.6% in February 2008 to 59.4% in February 2019.
It is important to note that "public administration" has increased by 18% over the last year but we assess that a considerable part of that increase has been due to reclassification of health and education workers from "private" to "public".
Because we are including public; education; and health in the noncyclical category the reclassification does not distort the results.
Finally we have one remaining category – "professional services". This group represents 8.7% of total employment covering: management consulting; computer system design; accounting services; legal services; and engineers. This category represents 8.7% of total employment having increased from 7.4% in February 2008.
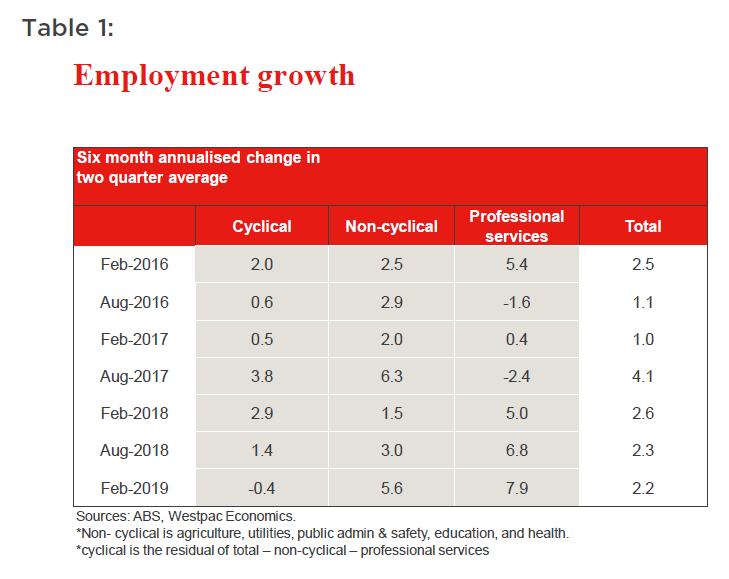
Consider Table 1 to assess whether there has been any evidence of the impact of the slowdown in growth in the economy on employment. The table uses the six month annualised growth rate for jobs in the three categories (using a two quarter average to smooth the series).
The following observations are relevant:
- As noted by the RBA, overall momentum in the jobs market has held fairly steady over the last 18 months despite the slowdown in economic growth (2.6% in the six months to February 2018 to 2.2% in the last six months).
- However, momentum in the "cyclical" sectors has slowed markedly from 2.9% in the six months to February 2018 to –0.4% in the six months to February 2019.
- Momentum in the "non-cyclical" sectors has lifted considerably from 1.5% to 5.6% over the same period.
- The professional services sector has been booming.
So the "puzzle" about the labour market is not as opaque as might be expected. Non-cyclical jobs (dominated by government) have been strong and this sector is increasing as a proportion of total employment. Cyclical sectors are slowing markedly and are falling as a proportion of total employment. Given the lags and the cautious outlook for growth, employment in these sectors is likely to continue to slow.
It is not clear whether the "professional services" sector best fits in the cyclical or the non-cyclical categories. Certainly, strong government spending in the infrastructure space is likely to explain a considerable part of the success of this category; the sharp lift in government regulations is also supporting this sector. Furthermore, there is also likely to be a structural element to the success of this sector as companies embrace technology to boost productivity and substitute labour.
Conclusion
The Board of the RBA has nominated the labour market as the key for the policy outlook. We are disappointed that ongoing low inflation and the persistent need to lower growth forecasts seems to be out-weighed by the employment "story".
Our analysis points to a marked slowdown in jobs growth already being well underway in the cyclical sectors of the economy.
We expect that eventual recognition of these facts will keep the RBA on track for our expected first rate cut in August.
The week that was
This week, the RBA minutes and labour force data were in focus domestically, while China Q1 GDP indicated policy stimulus is starting to take effect.
The April RBA meeting minutes clearly indicated that the Reserve Bank are willing to cut the cash rate if necessary and have set out the conditions that need to be fulfilled for a cut to occur.
In the final section of the minutes, the Board reaffirmed their belief in the stimulatory effect of lower interest rates on the economy via the cash-flow and exchange rate channels. That discounts arguments that suggest there is little benefit from lowering rates further from the already low starting level. In accordance, the Board set out the conditions for a rate cut, "members also discussed the scenario where inflation did not move any higher and unemployment trended up, noting that a decrease in the cash rate would likely be appropriate in these circumstances".
Given that we have seen conflicting signals from weak GDP growth against strength in the labour market, it would appear that the Board is placing a greater weight on employment from a policy perspective. As we see the labour market as a lagging indicator, we expect slow growth will eventually weigh on employment growth. On this basis, along with inflation remaining low, we continue to forecast cash rate cuts in August and November.
Across the Tasman, NZ Q1 CPI fell slightly short of expectations, up 0.1% against the consensus +0.2%. The surprise came from a weaker read on tradables, down 1.3% in the quarter and 0.4% in annual terms. Indeed, the major driver of the slowing in annual inflation to 1.5% from 1.9% was due to the pullback in fuel. Nevertheless, core inflation remains subdued with the various measures largely in a range of 1.5–1.7%.
After the release, market pricing shifted to a better than even chance of an OCR cut at the May RBNZ Monetary Policy Statement. That concurs with our view for a cut at that meeting. But as RBNZ Governor Adrian Orr has emphasised in recent interviews, the outcome of the May review is far from settled.
Elsewhere, this week was a quiet one in terms of central banks, but China's Q1 GDP release provided some optimism for the global growth outlook.
Consensus expectation before the release was for a slowing in the annual pace to 6.3% from 6.4% after the authorities opted for a growth target range of 6.0–6.5% for 2019 compared to the previous year's target of 6.5%.
Instead, growth printed at 6.4% and the March partial data signalled momentum picked up – in particular, industrial production ytd %yr printed at 6.5% against the expected 5.6%. Early signs that Chinese policy stimulus is starting to take effect is encouraging.
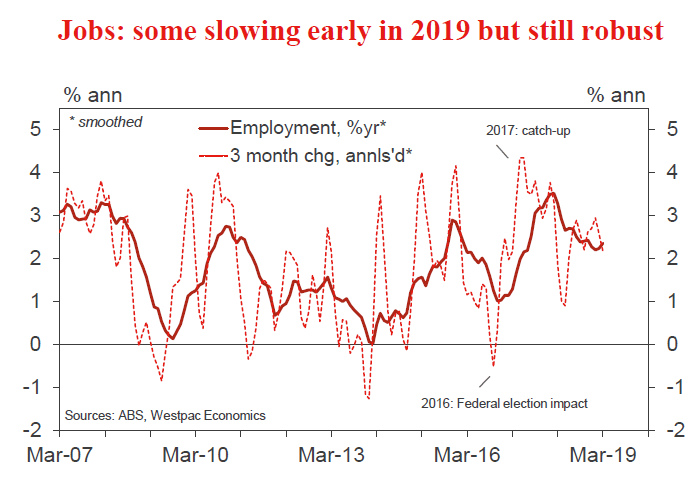
Chart of the week: jobs, a robust print; unemployment lifts
Locally, the ABS March labour force release on Thursday provided a timely update.
Employment rose by a robust 25.7k and the February estimate was upgraded a little, to +10.7k from +4.6k.
The unemployment rate rose to 5.0% (5.048%), up from 4.9% (4.94%) as participation lifted from 65.58% to 65.66%. Broadly, the unemployment rate has stalled at around 5.0% since last September, having trended lower from 5.5% at the start of 2018.
There has been some slowing of jobs growth early in 2019, with monthly gains averaging a still robust 24k, moderating from an average of 30k for the December quarter (albeit, broadly in line with the 2018 average of 23k).
There are still three labour force releases before the August RBA meeting - ample time for a clearer change in trend to materialise.
New Zealand: week ahead & data wrap
Should I stay or should I go?
With the Reserve Bank's May policy decision coming into sight, the next move in the Official Cash Rate remains a close call. We continue to expect a May rate cut. That's supported by the continued low level of inflation and softness in business sector indicators. However, the longer-term outlook for the economy is looking less worrying than it did a few months ago, especially given the recent news that there won't be a capital gains tax. That could have an important bearing on the RBNZ's thinking.
Inflation in New Zealand remains subdued. The March quarter Consumers Price Index revealed that inflation has slowed from 1.9% at the end of 2018 to 1.5% now. That was a little below our own and the RBNZ's forecast for a 1.6% result. Much of the decline in inflation was due to falls in petrol prices. But even smoothing through the normal quarter-to-quarter volatility, measures of the underlying trend in prices point to inflation of 1.5% to 1.7% - still short of the RBNZ's 2% long run target. In fact, inflation has essentially remained below 2% for the past seven years.
This ongoing softness in inflation is obviously of concern to the Reserve Bank. Even with the Official Cash Rate at a record low, domestic demand hasn't been strong enough to generate the pickup in inflation that they've been looking for. On top of that, some near-term indicators of business sector activity, including this week's Performance of Service Index and other recent surveys, are pointing to a cooling in growth through the first half of 2019.
Those concerns, along with nervousness around the global backdrop, saw the Reserve Bank shifting its stance at the time of its March policy decision. In March, the RBNZ noted the next move in the cash rate was more likely to be down. That was a significant dovish lurch from their comments in previous months when they noted that the next move in the OCR could be up or down.
Given the lingering softness in inflation and signs of a cooling in near-term activity, we expect that the RBNZ will cut the cash rate by 25 bps in May. That would take the OCR to a new record low of 1.50%. However, this is a close call. While the near-term picture is soft, the medium-term outlook is starting to look firmer than it did just a few weeks ago.
Looking first at the global front, which was definitely worrying the RBNZ back in March, much of the fear and loathing that rippled through financial markets earlier this year has now eased off. We still expect to see softness in some regions (including Australia). However, downward pressure on interest rates is helping to provide a floor under economic conditions in many economies. And in some of our major trading partners, like China, recent data actually points to a firming in activity.
But while the global backdrop is looking a bit more positive to us, we're not so certain that the Reserve Bank will have come to the same conclusion. There's a natural conservativism among central bankers, including those at the RBNZ, meaning that they are more attuned to downside news on the global front than upside developments. The RBNZ is also mindful of the upside risks for the NZ dollar. With that in mind, they might be happier to adopt a 'wait and see' approach to the global economy.
On the domestic front, it's true that a number of business sector indicators are pointing to a near-term cooling in growth. But bubbling below the surface, there are also signs that domestic demand is firming. As we've noted before, large increases in Government spending are now being rolled out. We've also seen signs that the earlier downshift in net migration and population growth could be less stark than feared. In addition, construction sector indicators are signalling another step higher in building activity this year.
On top of those developments, we've also just seen a major change in the stance of fiscal policy. The past week saw the Government cancelling its plan to introduce a capital gains tax. This was a centre-piece policy for the Labour Party (who head the current coalition government). However, this issue has been highly divisive for New Zealand voters, and Labour wasn't able to convince their coalition partners in the New Zealand First Party to support the policy.
The potential introduction of a capital gains tax has had an important dampening impact on economic confidence in recent months. In our own forecast, we had assumed its introduction would be a significant drag on nationwide house price growth over the next few years (and that was assuming that the policy would be watered down from what was initially proposed). Now, with this policy not proceeding, and with mortgage rates at very low levels, there is a chance of some reacceleration in the housing market over the coming months, along with an associated pickup in household spending.
What the cancellation of capital gains tax means for the Reserve Bank is a little less clear. Their usual practice is not to incorporate policy changes until they have been confirmed. However, potential policy changes can still affect confidence levels and might still shade the RBNZ's thinking about the outlook.
Putting all this together, the RBNZ will be looking at a soft nearterm outlook for growth and inflation, but the outlook for 2020 won't look as worrying as it did when they last reviewed the cash rate. Although we expect a cut, these developments could see them staying pat in May.
The final piece of the puzzle will be the March quarter labour market data (due for release on 1 May). If that reveals a lift in the unemployment rate, the RBNZ is likely to feel more comfortable cutting in May. On that front, there has been a pickup in the number of people on jobseeker benefits in the early part of 2019.
If the RBNZ doesn't cut rates in May, there's a chance that the door will be closed for the remainder of 2019. Through the second half of this year, we expect that the firming in the global economy will be more obvious. We also expect to see an improvement in the domestic data pulse, particularly in the household sector.
Data Previews
Aus Q1 Consumer Price Index
- Apr 24, Last: 0.5%, WBC f/c: 0.1%
- Mkt f/c: 0.2%, Range: 0.0% to 1.0%
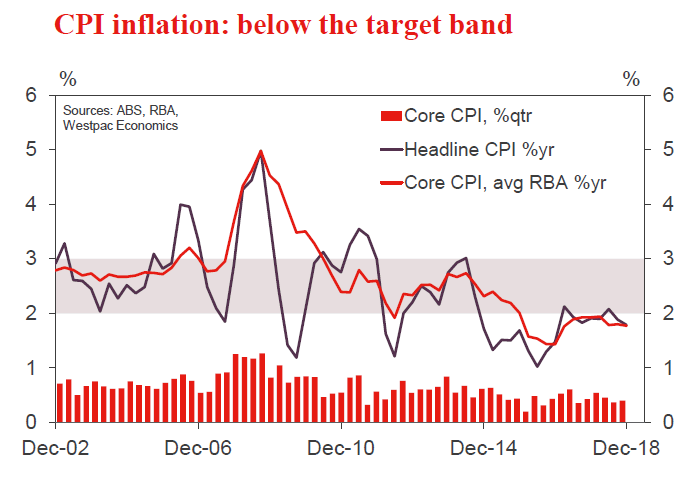
Consumer inflation undershot the RBA's 2-3% target band in 2018. Headline inflation was 1.8%, including a 0.6% rise in Q4. Core inflation for Q4 printed at 0.4%qtr, 1.8%yr.
Key to this lack of price pressure are: weak wages growth; a housing downturn; sluggish consumer spending; and intense retail competition. While the AUD has weakened the pass through of higher import prices to consumers is limited.
For the March quarter, we expect headline inflation of only 0.1%qtr 1.4%yr. Additional forces at work in the period are: retreating fuel prices, subtracting 0.2ppts (after adding 0.1ppt in Q4); and a seasonally soft quarter (-0.2ppts).
Core inflation is expected to be soft, at 0.3%qtr, moderating to 1.6%yr. This follows a couple of quarters at 0.4%.
For additional detail, see our CPI preview bulletin.
Aus Q1 import price index
- Apr 26, Last: 0.5%, WBC f/c: -0.8%
- Mkt f/c: 0.4%, Range: -1.0% to +0.8%
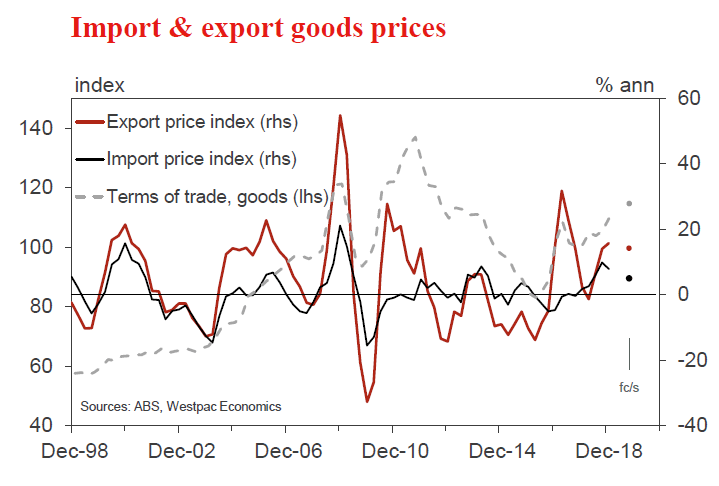
Prices for imported goods rose by 7.8% in 2018, including a 0.5% lift in Q4. This increase in the cost of imports reflected the impact of the lower Australian dollar and higher global energy prices.
For the March quarter, import prices are forecast to decline by 0.8% (with the risk of a more modest decline).
Key to the expected fall for Q1 is the oil price - which corrected sharply lower after a strong run.
The Australian dollar fell in the quarter - thereby placing upward pressure on the cost of imports. On a TWI basis, the Aussie fell by 2.2% in Q1, with a more modest decline against the US dollar, -0.8%.
Aus Q1 export price index
- Apr 26, Last: 4.4%, WBC f/c: 3.5%
- Mkt f/c: 3.5%, Range: 3.1% to 4.0%
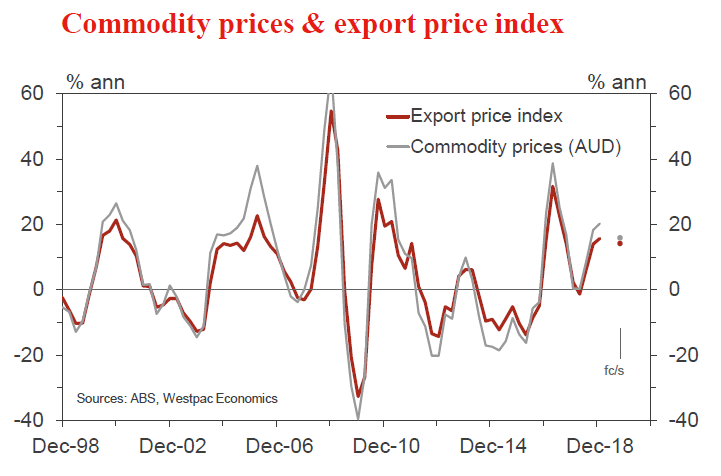
Export prices increased jumped by 15.7% in 2018, including a 4.4% rise in Q4, moving higher on rising commodity prices and a lower Australian dollar.
For Q1, the export price index is forecast to rise by 3.5%.
In the opening quarter of 2019, commodity prices advanced further, up by 4.5% in AUD terms. In addition, the currency fell against the US dollar, placing upward pressure on prices.
The terms of trade for goods, on these estimates, increased by around 4.3% in the March quarter, extending the positive run for Australian national income growth.
As to prices for services, an update will be available with the release of the Balance of Payments on June 4.
US Q1 GDP
- Apr 26, Last 2.2%, WBC f/c: 2.2% annls'd
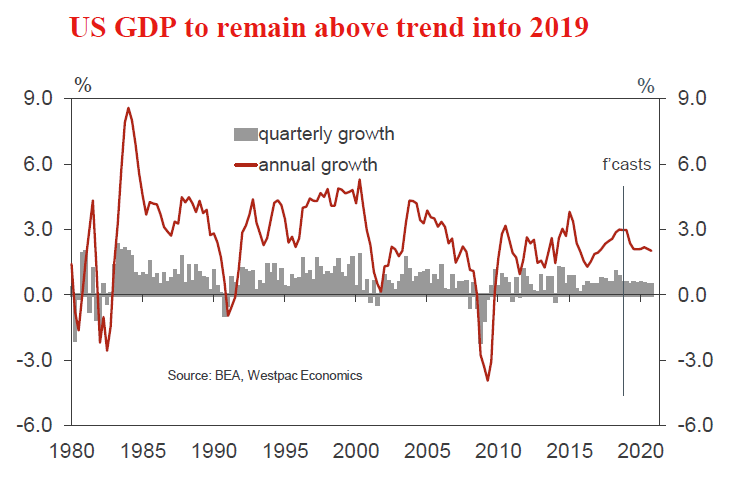
US data at the turn of the year was disappointingly weak. However, as Q1 has rolled on, momentum has stabilised, and in some instances, begun to firm. As a result, we look for a gain in Q1 a touch above potential at 2.2% annualised.
Domestic final demand is likely to be a little weaker than the headline print, circa 2.0% annualised. Supporting this outcome will be subdued gains for the consumer and business investment, but strength in public demand.
As the year rolls on, the consumer pulse is expected to hold around the current level, but business investment will slow further. The recent decline in residential construction should abate, but this will only partly offset the loss of support from the public sector come Q4.
Sunset Market Commentary
Markets
Global core bonds gain ground today with German Bunds outperforming US Treasuries. Risk sentiment turned sour overnight with nearly all Asian equity indices edging down. Core bonds maintained an upward bias overnight ahead of the European trading day. The European PMI’s were key today as investors sought confirmation of the stronger-than-expected Chinese growth data. French PMI’s kicked-off and immediately set the tone: a weak manufacturing subcomponent and a solid services result. However, it took a similar German result to entail a market reaction. German Bunds jumped higher and found more backing after the PMI result for the entire eurozone printed disappointing as well. The German yield curve is bull flattening with changes in the range of -0.7 bps (2-yr) to -5.3 bps (30-yr). US Treasuries behaved similar to German Bunds throughout European dealings and edged higher. However, strong US retail sales beat expectations by a landslide and caused US Treasuries to retreat, though rather limited as the Philly Fed business outlook disappointed at the same time. Despite the strong retail sales, US Treasuries kept an upward bias at the start of the US trading day. The US yield curve is moving lower with changes up to -2.9 bps (10-yr).
EUR/USD suffered from a double setback today, the first occurring this morning. EMU PMI’s missed estimates again. They highlighted the euro zone’s struggle to recover from what is still considered a temporary (but drawn-out) slowdown. Key US data (retail sales, jobless claims) later surprised (strongly) on the upside. The economic straddle caused the US/German interest rate differentials to widen in favour of the dollar. EUR/USD nosedived on the poor PMI’s and extended losses after the US numbers. The couple is hovering near 1.125. The trade weighted dollar jumped to recent highs around 97.4. USD/JPY temporarily spiked above 112 before retreating to around 111.90.
UK retail sales ended the first quarter on a strong note, rising for a third consecutive month in March and overwhelming market estimates (1.1% MoM vs. -0.3% expected). February saw its data revised upwardly. Sterling’s reaction was only lukewarm given the magnitude of the surprise. Markets avoid any directional sterling long exposure as long as Brexit remains as unclear as is the case today. Talks between PM May and Corbyn to strike a cross-party agreement have been going since the EU agreed to postpone Brexit with another 6 months. But the lack of any concrete news during these low-volume holiday trading sessions results in uninspiring sideways water treading. EUR/GBP is changing hands at 0.864, down from 0.866 this morning and at least partially related to euro weakness. Cable is pressured by an overall stronger dollar. The support area at 1.30 is vulnerable.
News Headlines
US eco data were mixed. Weekly jobless claims (192k) remains for a 2nd straight week below 200k which is the lowest level since the late 60’s. The Philly Fed Business outlook fell more than expected, from 13.7 to 8.5, and the index on the outlook for future activity fell to its lowest since 2016. US retail sales were today’s positive surprise with the control group, a proxy for consumption in US GDP, rebounding by 1% M/M after a 0.3% M/M decline in March.
The Swedish unemployment rate unexpectedly surged from 6.3% to 6.7% in March. Figures put the central bank’s resilience to raise the policy rate (-0.25%) to 0% by the end of the year in doubt. The Riksbank meets next week. EUR/SEK rose towards 10.50 despite today’s euro weakness.
Eurozone PMI’s deteriorates further in April (composite 51.3), suggesting the EMU economy continues running at a pace of tops 0.2% Q/Q. The spread between the (external) manufacturing sector, in recession territory, and the (domestic) services sector remains large. On a national level, both Germany (composite 52.1) and France (composite 50) couldn’t convince.
Canadian Retail Sales Pick Up in February
- Retail sales advanced 0.8% (m/m) in February, topping consensus expectations for a 0.4% uptick. This came on the heels of a disappointing January report, which saw sales drop a revised -0.4% (previously reported as -0.3%).
- The picture was slightly less impressive after accounting for price changes, with volumes up a modest 0.2%, not enough to offset January's revised decline (-0.3%, initially reported as 0.0%).
- Sectoral performance was mixed, with 5 of the 11 subsectors recording an increase. The uptick was mostly driven by an increase in sales at general merchandise stores (+3.8%) and motor vehicles and parts dealers (+1.4%). Sales at gasoline stations also rose 1.9%, which was to be expected given increases in gasoline prices.
- Providing some offset were lower sales at building material and garden equipment stores (-1.6%) and electronics and appliance stores (-3.5%).
- Regionally, seven provinces saw retail sales increase. Ontario (+1.5%) and Quebec (+1.6%) accounted for a large chunk of the headline increase. Alberta (+0.9%), Saskatchewan (+1.3%), and Manitoba (+2.2%) also saw retail sales advance. Performance across the Atlantic provinces was mixed. British Columbia provided the most notable offset, with sales falling 1.9% on the month.
Key Implications
- Despite the above-consensus release, we shouldn't get carried away with the positive print. The relatively modest volumes uptick does little to change our GDP tracking for Q1. Retail activity for Q1 as a whole is likely to disappoint, and a large spending uptick would be needed in March to bring retail sales volumes for the overall quarter into positive territory. Looking ahead, the retail activity picture in Canada is likely to echo our expectations of subdued consumer spending, as past increases in borrowing costs continue to work their way into the system and partially offset gains from strong labour markets.
- Today's report joins a range of other indicators this week (manufacturing sales, international trade, Bank of Canada's Business Outlook Survey) reaffirming our view that the Canadian economy likely went through a soft spot in Q1.
USD/JPY Mid-Day Outlook
Daily Pivots: (S1) 111.94; (P) 112.06; (R1) 112.19; More...
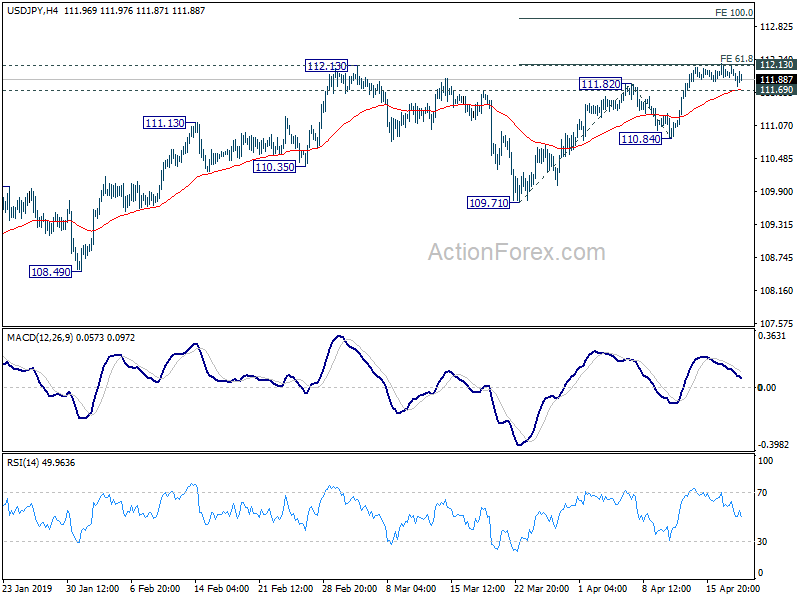
USD/JPY is bounded in tight range for now and intraday bias stays neutral first. On the upside, sustained break of 112.13 will resume whole rise from 104.69 for 100 % projection of 109.71 to 111.82 and 110.84 at 112.95 first. On the downside, below 111.69 minor support will turn bias to the downside for 110.84 support. Break will bring deeper fall back to 109.71 support.
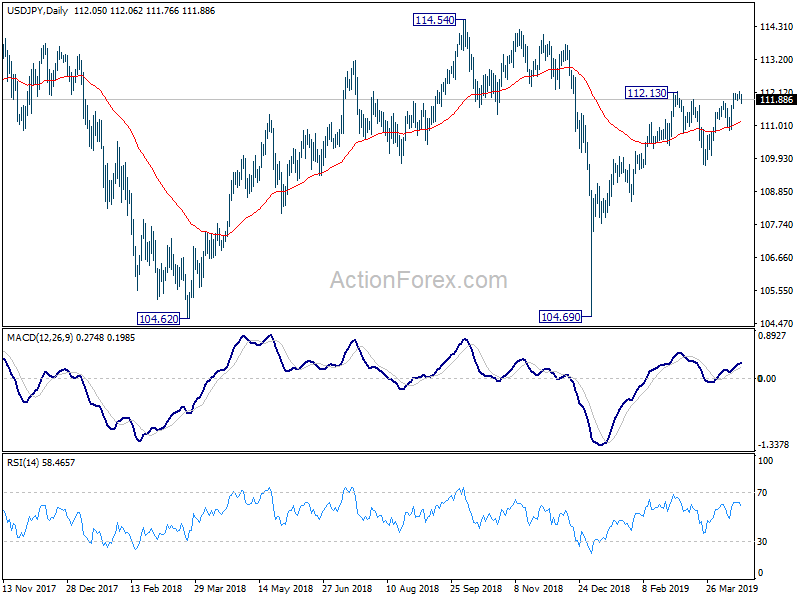
In the bigger picture, medium term outlook in USD/JPY remains a bit mixed as it's staying inside falling channel from 118.65, but there are signs of bullish reversal. On the upside, break of 114.54 resistance will revive the case the corrective fall from 118.65 has completed with three waves down to 104.69. And whole rise from 98.97 (2016 low) is resuming for 118.65 and above. But before that, outlook stays neutral first.
GBP/USD Mid-Day Outlook
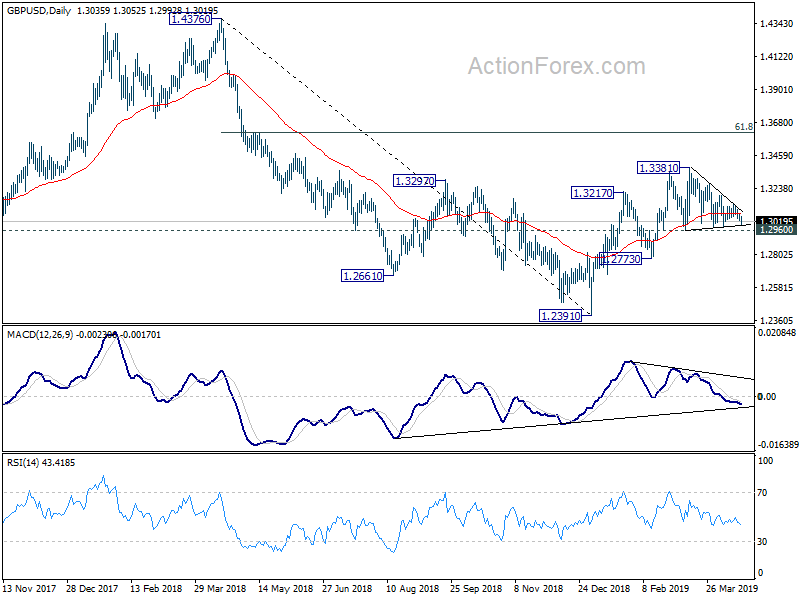
Daily Pivots: (S1) 1.3022; (P) 1.3046; (R1) 1.3063; More....
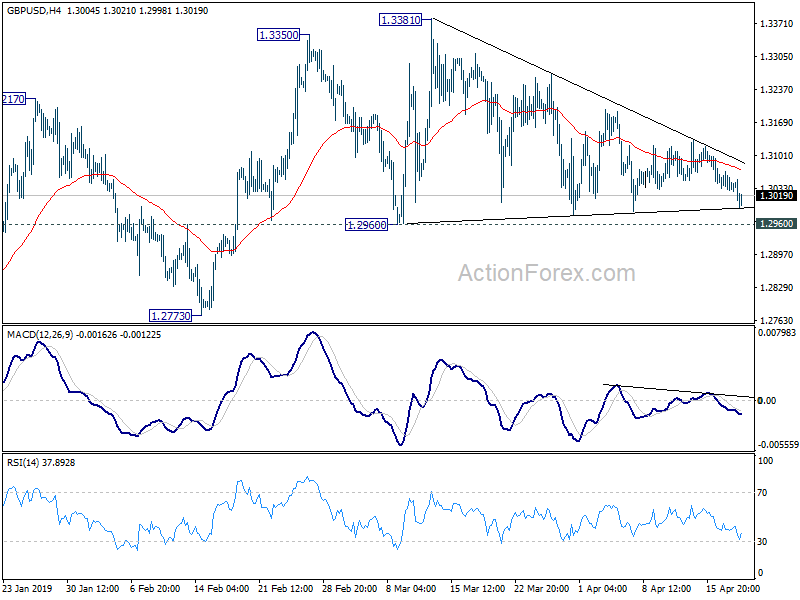
GBP/USD weakens mildly today but stays in consolidation pattern from 1.3381. Intraday bias remains neutral first. For now, further rally is still mildly in favor with 1.2960 support intact. On the upside, decisive break of 1.3381 resistance will resume whole rise from 1.2391. Next target will be 61.8% retracement of 1.4376 to 1.2391 at 1.3618 next. However, on the downside, sustained break of 1.2960 will indicate that rebound from 1.2391 has completed earlier than expected. Deeper fall would then be seen to 1.2773 support for confirmation.
In the bigger picture, medium term decline from 1.4376 (2018 high) should have completed at 1.2391. Rise from 1.2391 is seen as the third leg of the corrective pattern from 1.1946 (2016 low). Further rise could be seen through 1.4376 in medium term. On the downside, though, break of 1.2773 support will dampen this view. Focus will be turned back to 1.2391 low and break will resume the fall from 1.4376 to 1.1946.
EUR/USD Mid-Day Outlook
Daily Pivots: (S1) 1.1277; (P) 1.1301; (R1) 1.1322; More.....
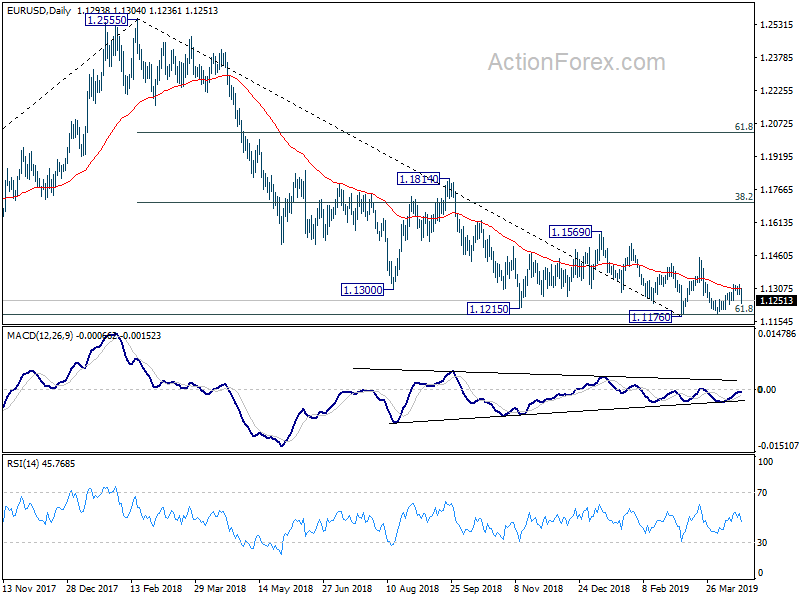
EUR/USD's break of 1.1250 minor support suggests that corrective recovery from 1.1183 has completed at 1.1324 already. Intraday bias is turned back to the downside for 1.1176 key support. Decisive break there will resume whole down trend form 1.2555. On the upside, though, break of 1.1324 will turn bias back to the upside to extend the recovery.
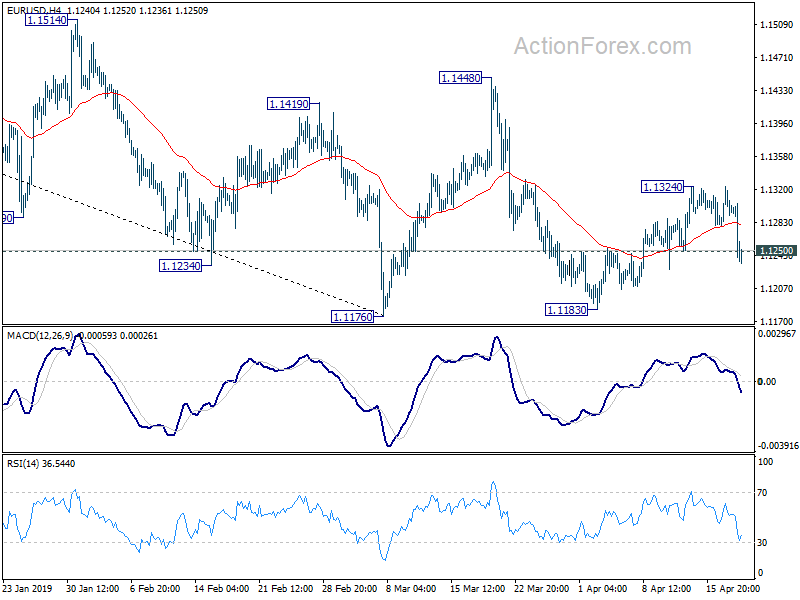
In the bigger picture, EUR/USD has been losing downside momentum around 61.8% retracement of 1.0339 (2016 low) to 1.2555 (2018 high) at 1.1186. But for now, there is no clear sign of medium term reversal yet. Downside from 1.2555 is expected to resume sooner or later as long as 1.1569 structural resistance holds. Decisive break of 1.1186. could pave the way back to 1.0339 low.