Sample Category Title
USDJPY Bulls Face Big Challenge Around 112
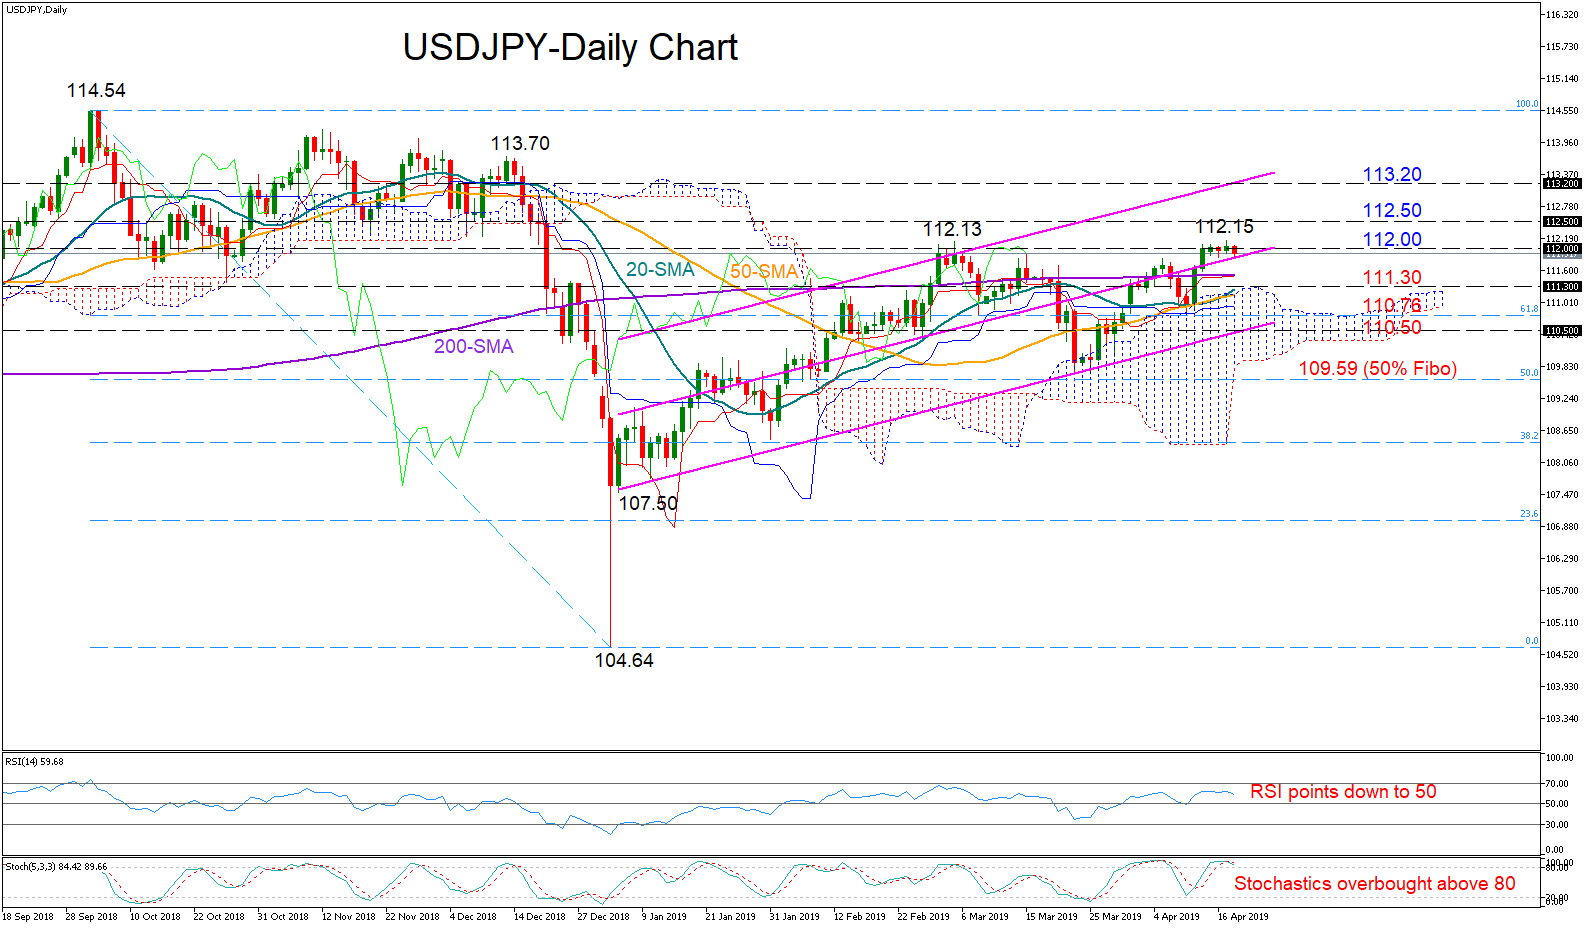
USDJPY has been on the sidelines for the most part of the week as the 112 level seems to be a real struggle for the bulls. Technically, the price could lose some ground in the short-term as the RSI is changing direction to the downside and towards its 50 neutral mark, while the Stochastics are warning over an overbought market, having already created a bearish cross within the %K and %D lines.
A rebound on the 20-day simple moving average (SMA) and near the upper surface of the Ichimoku cloud (111.30), however, could keep the pair on the uptrend started from the 107.50 low in early January. Should the price overcome the 112 mark, resistance could run up to the 112.50 former support area. Higher the top line of the ascending channel seen around 113.20 may also prove a challenge.
Alternatively, a decline under 111.30, could meet a strong barrier between 110.76 and 110.50, where the 61.8% Fibonacci of the downleg from 114.54 to 104.64 and the lower line of the channel are located. Exiting the channel, the 50% Fibonacci of 109.59 could take control.
In the medium-term picture, USDJPY is gently pointing up over the past three months, framing a positive profile. A strong rally above 112.50 would extend the upward pattern off 107.50, making the outlook even more bullish, while a decisive close below 109.59 would confirm the start of a downtrend.
In brief, USDJPY could lose further steam in the short term, while in the medium-term the pair continues to hold a positive outlook.
NZDUSD Faces Strong Support At 0.6720, Completes 3-Month Low
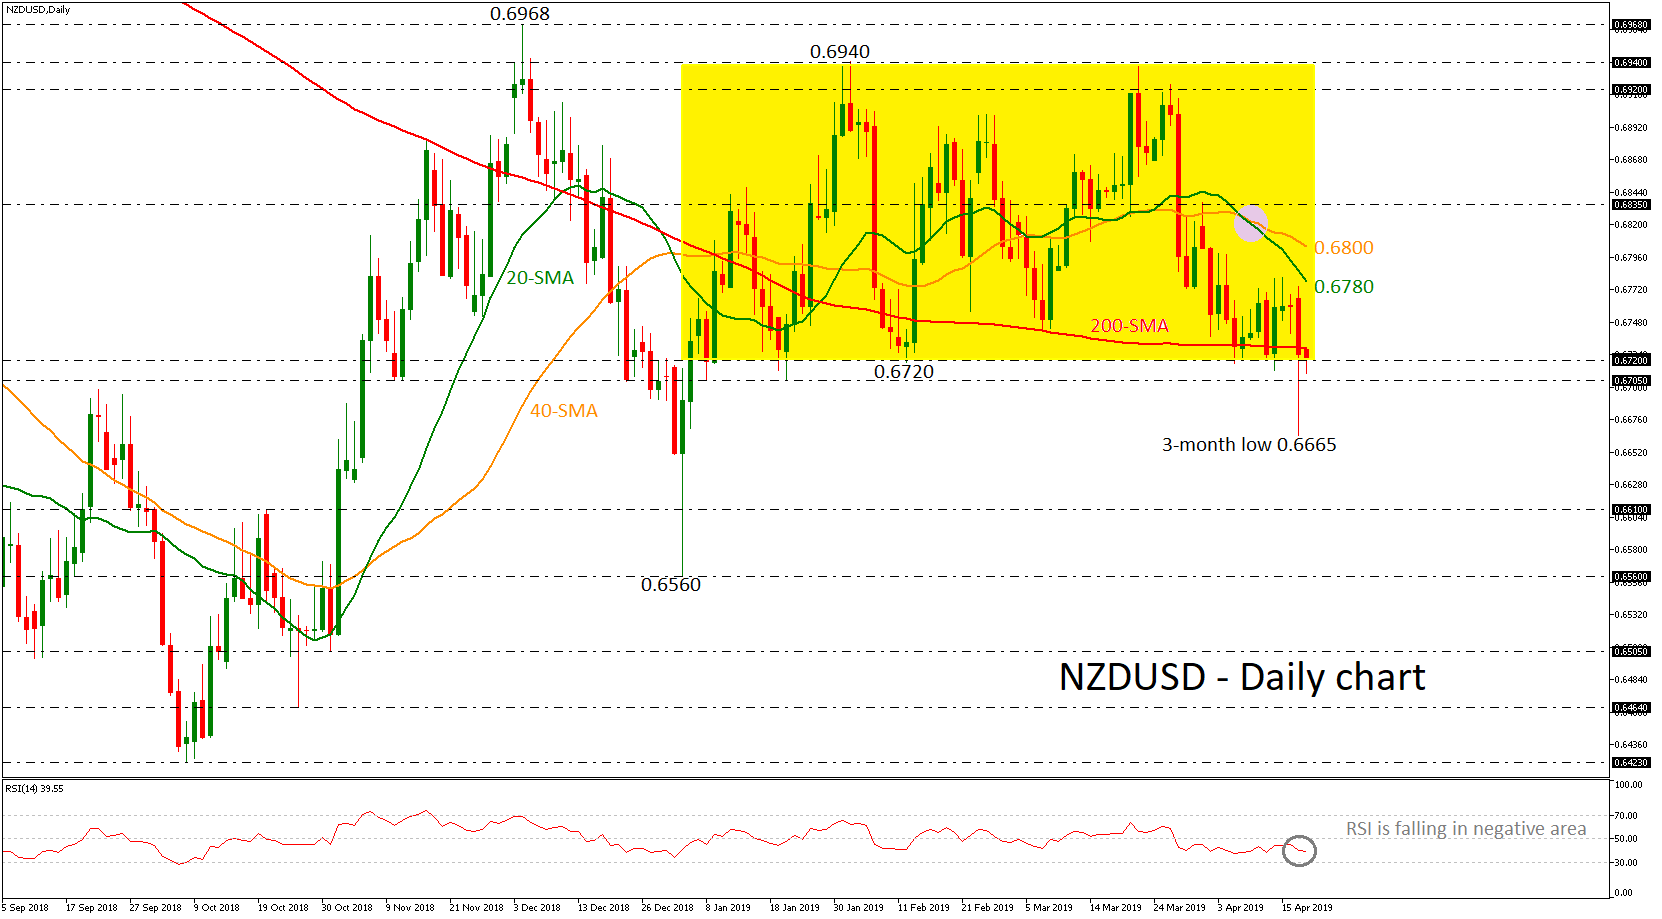
NZDUSD reached a fresh three-month low of 0.6665 on Wednesday but it failed to end the day below the medium-term consolidation area with upper boundary the 0.6940 resistance and lower boundary the 0.6720 support. The pair remains slightly below the 200-day simple moving average (SMA) suggesting more losses, while the RSI indicator is sloping south in the negative territory.
If the bears manage to take control and penetrate the sideways channel, support would likely come from the lower boundary near 0.6705. A close below this level as well, could confirm the forthcoming bearish structure until yesterday’s low of 0.6635 before touching the 0.6610 support.
On the other hand, an extension to the upside could find resistance around the 20- and 40-day SMAs currently at 0.6780 and 0.6800 respectively. Higher still, immediate resistance of 0.6835 could attract traders’ attention.
Concluding, NZDUSD lacks direction and investors should be waiting for an exit of the range before placing orders.
BTCUSD Holds Support
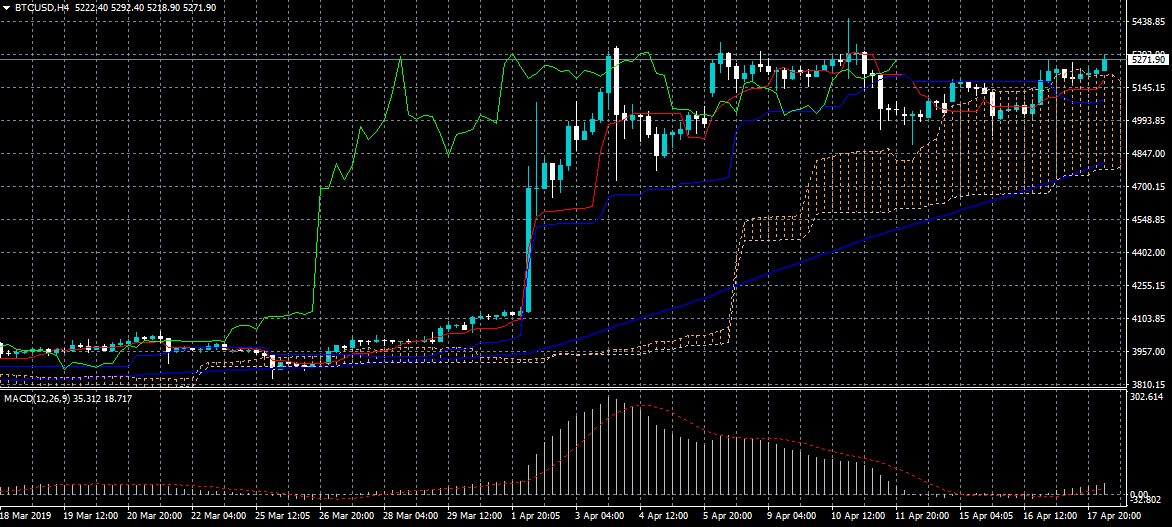
Bitcoin is starting to move higher after the number one cryptocurrency bounced from key weekly support from the $5,200 level. BTCUSD bulls now need to move price above the $5,452 level to negate the head and shoulders pattern on the four-hour time frame. The Ichimoku indicator on the four-hour time frame is showing that the BTCUSD pair will start to fall back inside the Ichimoku cloud below the $5,200 level.
The BTCUSD pair is only bullish while trading above the $5,200 level, key intraday resistance is found at the $5,300 and $5,452 levels.
If the BTCUSD pair trades under the $5,200 level, sellers may test towards the $4,889 and $4,700 support levels.
GBPUSD Awaiting UK Data
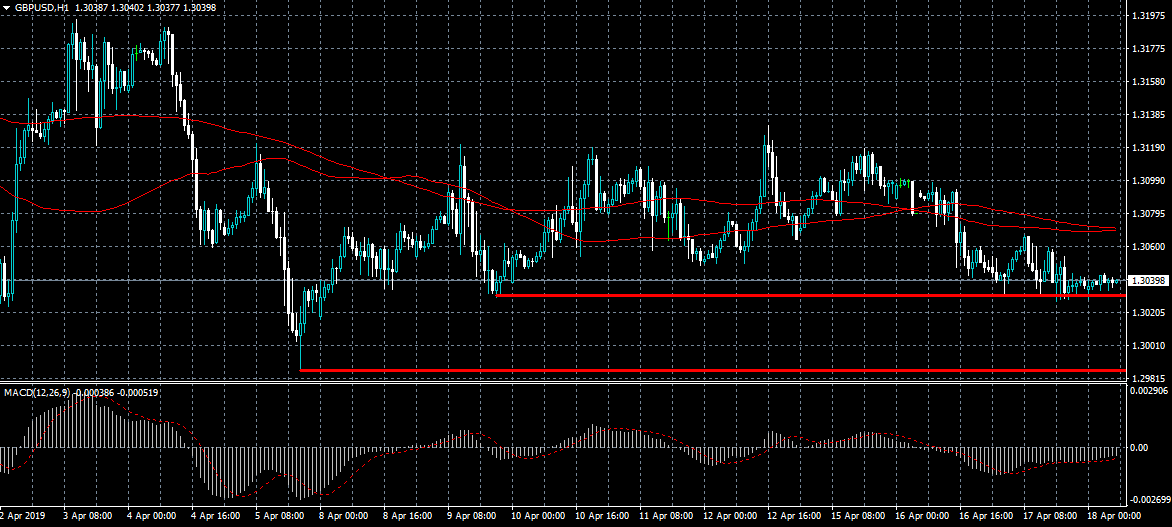
The British pound is trading close to the worst levels of the week against the US dollar as traders await the release of Retail Sales data from the United Kingdom economy. The GBPUSD pair remains technically weak and will decline sharply if the 1.3030 support level is clearly broken. Bulls need to move price above the 1.3080 level to change the intraday sentiment surrounding the GBPUSD pair.
The GBPUSD pair is only bullish while trading above the 1.3080 level, key intraday resistance remains at the 1.3100 and 1.3126 levels.
If the GBPUSD pair trades under the 1.3030 level, key intraday support is found at the 1.2985 and 1.2940 levels.
EURUSD 1.1290 Still In Focus
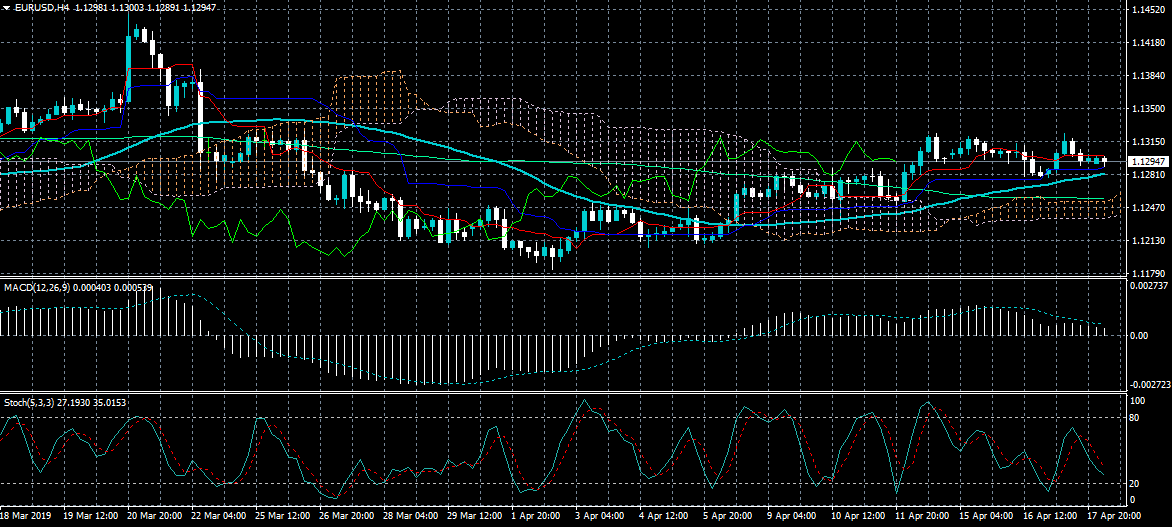
The euro is consolidating around the 1.1290 level against the US dollar as the pair remains trapped within its tightest weekly trading range of 2019 so far. The Ichimoku indicator is showing that buyers need to close price above the 1.1315 level to accelerate technical buying interest. Sellers need multiple four-hour time frame closes below the 1.1290 level to accelerate EURUSD selling.
The EURUSD pair is only bullish while trading above the 1.1290 level, key technical resistance is found at the 1.1315 and 1.1330 levels.
If the EURUSD pair trades below 1.1290 level, key intraday support is found at the 1.1250 and 1.1216 support levels.
EURO Slips Ahead Of EU And German PMI Numbers
The price of crude oil slipped after the EIA released its weekly inventories report. The numbers showed that there was a drawdown of more than 1.396 million barrels per week. This was a higher drawdown than the 1.2 million barrels that traders were expecting. Previously, data from the American Petroleum Institute (API) showed that there was a drawdown of more than 3 million barrels. Still, the price of crude is near the five-month high and there is a possibility that WTI and Brent will test last year’s highs of $73 and $85 respectively.
The Aussie was relatively unchanged after the country released employment numbers for March. During the month, the unemployment rate rose to 5.0% from the previous 4.9%. The participation rate rose to 65.7% from the previous 65.6%. The participation rate is an important number that measures the percentage of working-age people who are either working or looking for work. In March, the economy added 25.7K jobs, which was higher than the expected 12K.
Focus will be on the euro as the region releases PMI numbers for April. In Germany, the manufacturing PMI is expected to gain to 45 from the previous 44.1. The services PMI is expected to decline to 55.1 from 55.4. In the EU, the manufacturing PMI is expected to rise slightly to 47.9 while the services PMI is expected to drop to 53.2 from the previous 53.3. Other than PMIs, traders will receive the Bank of England’s credit conditions survey and retail sales for the month of March. In the United States, the labor department will release the initial jobless claims. Other key data will be the Philadelphia Fed Manufacturing Index and the retail sales.
EUR/USD
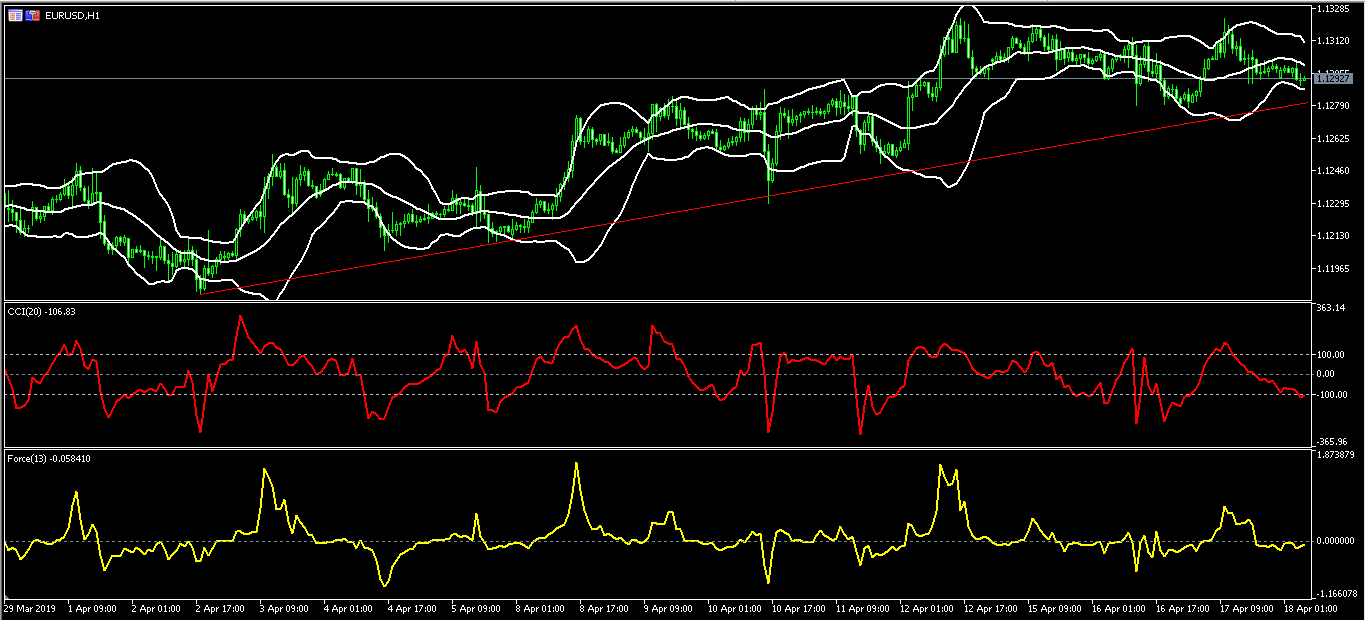
The EUR/USD pair declined ahead of important data from Europe and US. The pair is trading at the 1.1293, which is along the lower band of the Bollinger Bands. This price is above the important support line shown below. On the hourly chart, the commodities channel indicator has moved below the oversold line of 100. The same is true with the Force Index. If the pair continues to drop, it will likely test the important support level of 1.1280.
AUD/NZD
The AUD/NZD cross has been gaining since March 21 when the pair traded at 1.0276. Yesterday, the pair reached a high of 1.0732, which is the highest level since November last year. On the four-hour chart, the pair is along the upper line of the Bollinger Bands and above all the short and medium-term moving averages. The RSI has moved close to the overbought level of 70.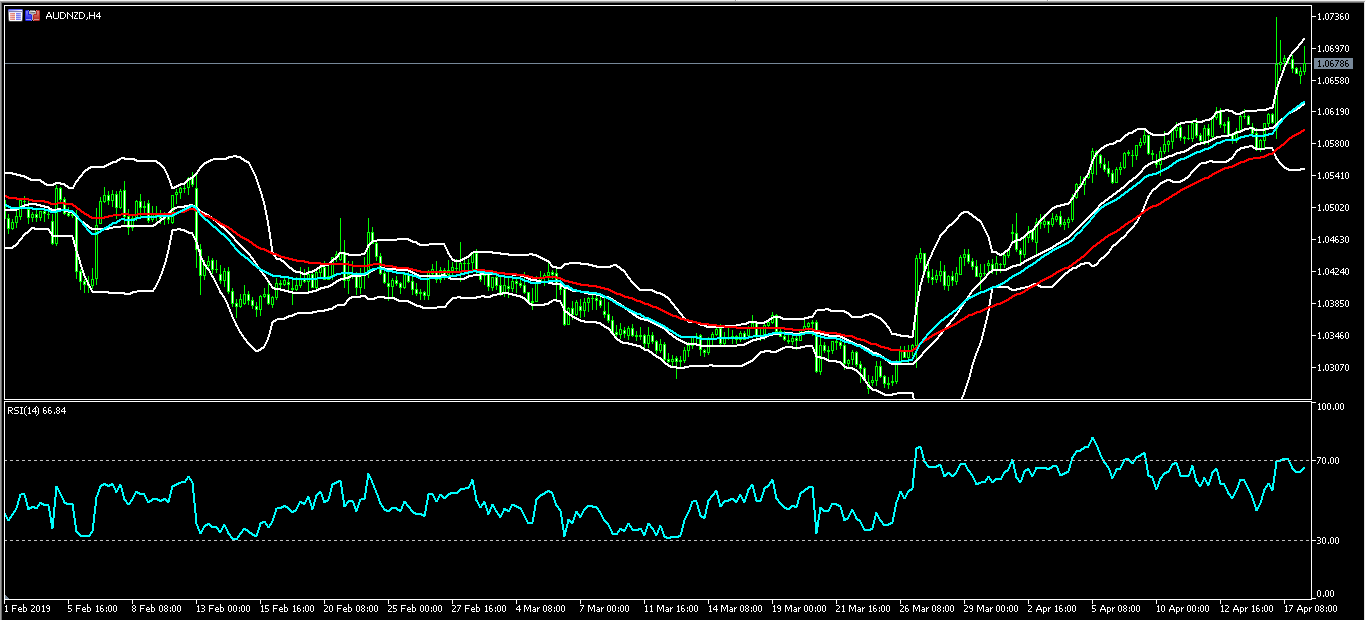
XTI/USD
The XTI/USD pair moved to a low of 63.57. On the hourly chart, this price is along the lower line of the Envelopes indicator and above the important resistance level of 63. The commodities channel index has moved up to above the 100 level while the volumes have shrunken. The pair will likely remain within the current range as investors think of a way forward regarding the oil market. Still, there is a possibility that the upward side will prevail.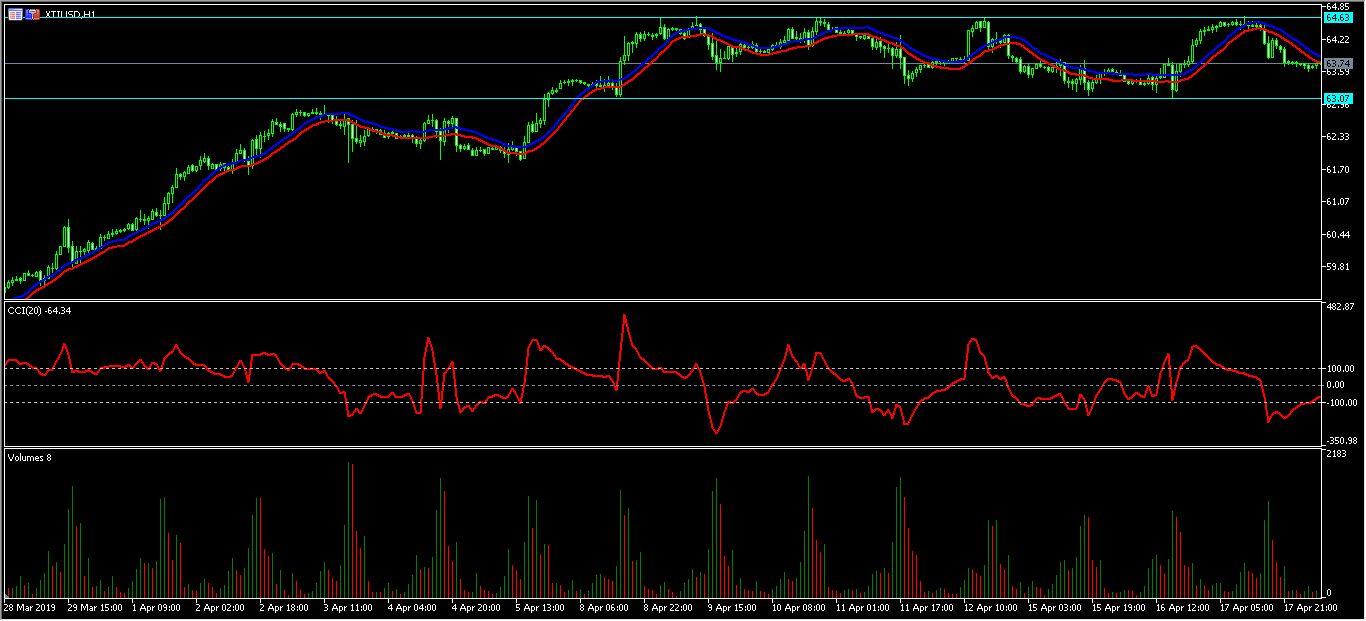
EUR/USD Daily Outlook
Daily Pivots: (S1) 1.1277; (P) 1.1301; (R1) 1.1322; More.....
EUR/USD drops notably today but it's staying above 1.1250 minor support. Intraday bias remains neutral first. On the downside, break of 1.1250 will suggest that corrective recovery from 1.1183 has completed already. Intraday bias will be turned back to the downside. Further break of 1.1176 low will resume the down trend from 1.2555. On the upside, break of 1.1324 will extend the rebound to 1.1448 resistance. In that case, we'd expect strong resistance between 1.1448/1569 to limit upside.
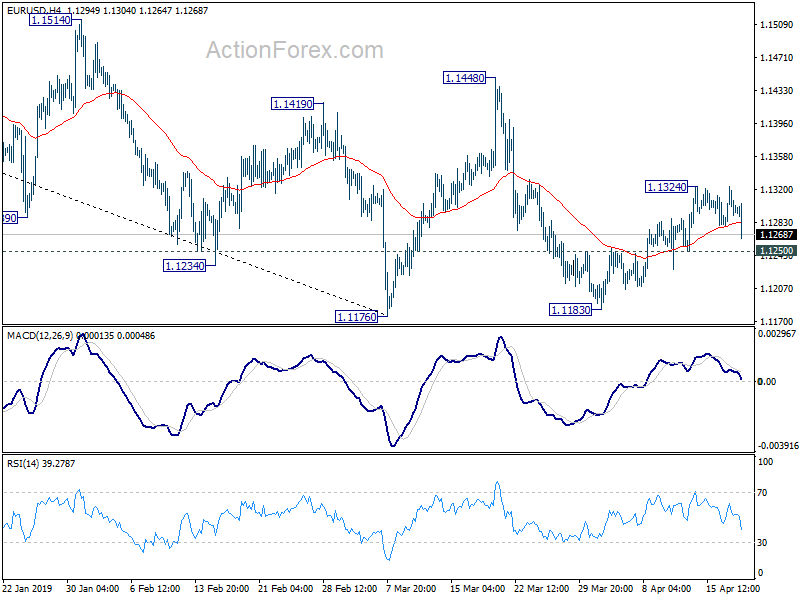
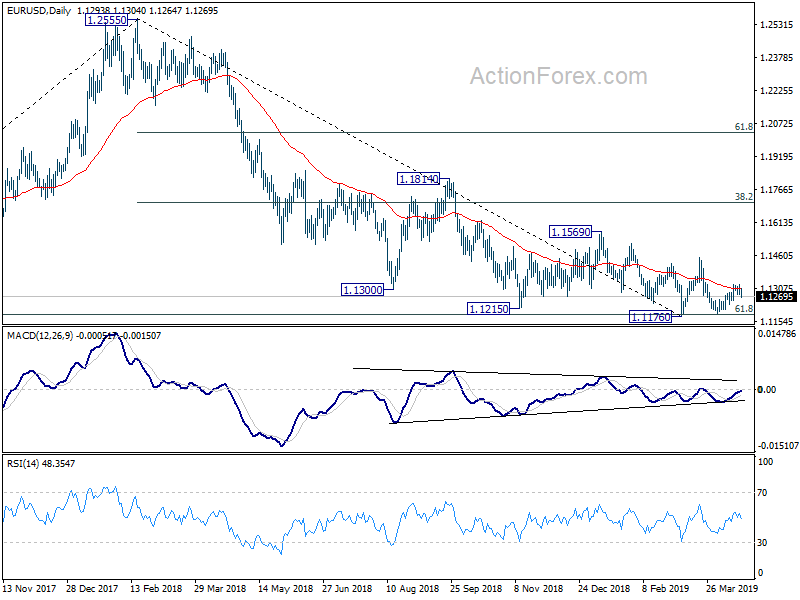
In the bigger picture, EUR/USD has been losing downside momentum around 61.8% retracement of 1.0339 (2016 low) to 1.2555 (2018 high) at 1.1186. But for now, there is no clear sign of medium term reversal yet. Downside from 1.2555 is expected to resume sooner or later as long as 1.1569 structural resistance holds. Decisive break of 1.1186. could pave the way back to 1.0339 low.
GBP/USD Daily Outlook
Daily Pivots: (S1) 1.3022; (P) 1.3046; (R1) 1.3063; More....
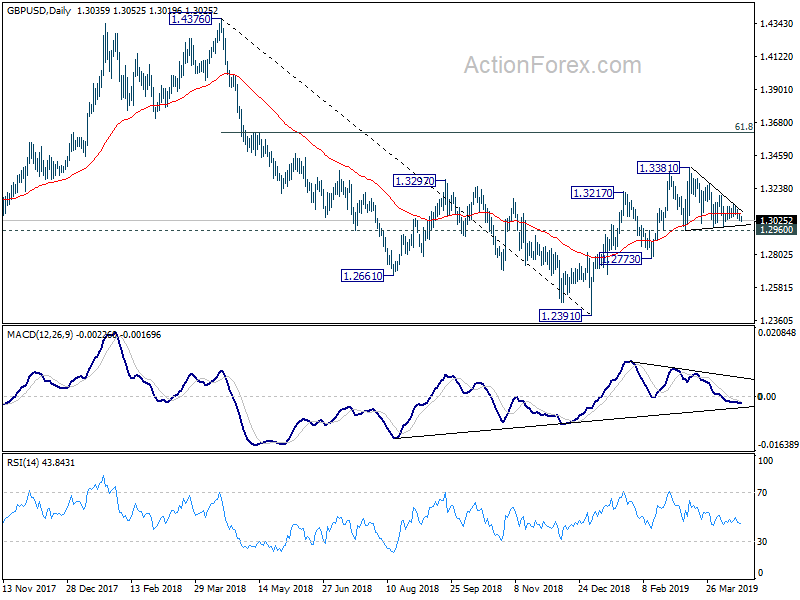
No change in GBP/USD's outlook as it's staying in consolidation from 1.3381. Intraday bias remains neutral for the moment. And further rise remains in favor with 1.2960 support intact. On the upside, decisive break of 1.3381 resistance will resume whole rise from 1.2391. Next target will be 61.8% retracement of 1.4376 to 1.2391 at 1.3618 next. However, on the downside, sustained break of 1.2960 will indicate that rebound from 1.2391 has completed earlier than expected. Deeper fall would then be seen to 1.2773 support for confirmation.
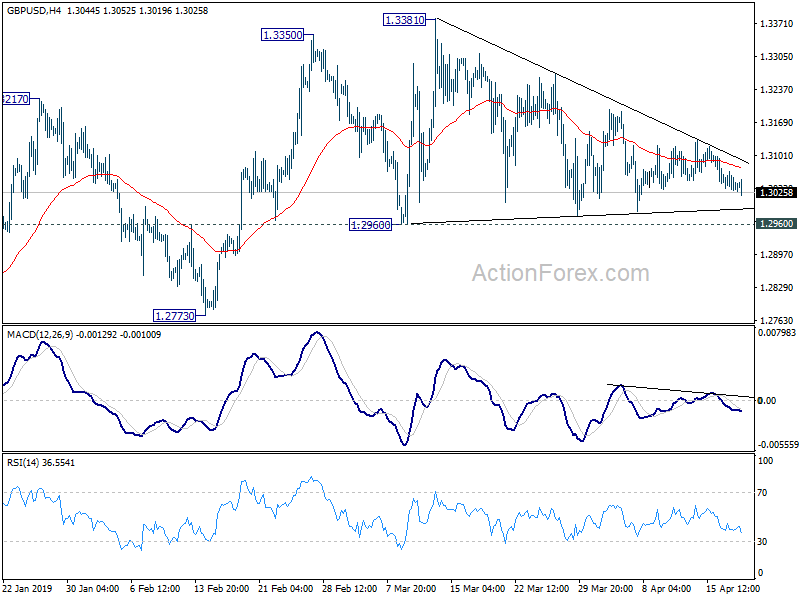
In the bigger picture, medium term decline from 1.4376 (2018 high) should have completed at 1.2391. Rise from 1.2391 is seen as the third leg of the corrective pattern from 1.1946 (2016 low). Further rise could be seen through 1.4376 in medium term. On the downside, though, break of 1.2773 support will dampen this view. Focus will be turned back to 1.2391 low and break will resume the fall from 1.4376 to 1.1946.
USD/CHF Daily Outlook
Daily Pivots: (S1) 1.0076; (P) 1.0094; (R1) 1.0124; More...
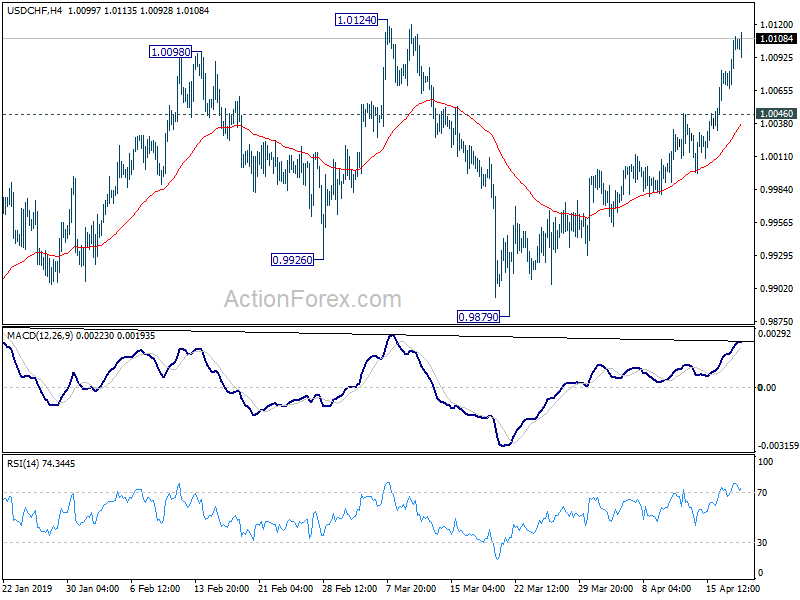
USD/CHF's rally is still in progress and intraday bias remains on the upside for 1.0124/8 resistance. We'd be cautious on strong resistance from there to limit upside. Though, decisive break of 1.0124/8 will confirm larger up trend resumption. USD/CHF should target 1.0342 next. On the downside, break of 1.0046 will turn bias to the downside to extend recent sideway trading instead.
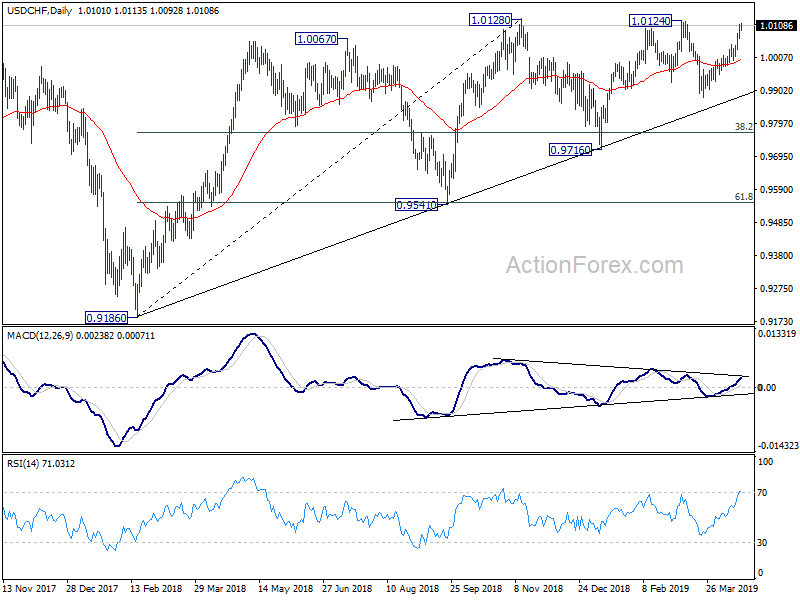
In the bigger picture, loss of upside momentum is seen is bearish divergence in daily MACD. But there is no clear sign of bearish reversal in USD/CHF yet. Rise fro 0.9186 is likely still in progress. Decisive break of 1.0128 resistance will resume this medium term rally to 1.0342 resistance next. This will remain the preferred case now, as long as 0.9716 support holds.
USD/JPY Caution
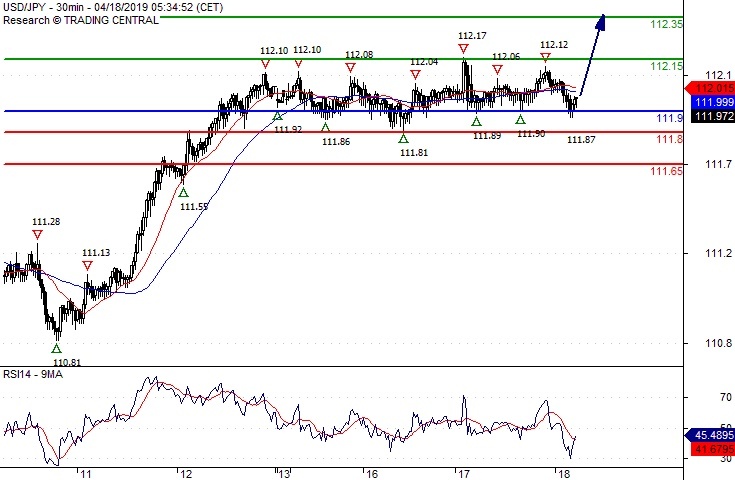
Pivot (invalidation): 111.90
Our preference Long positions above 111.90 with targets at 112.15 & 112.35 in extension.
Alternative scenario Below 111.90 look for further downside with 111.80 & 111.65 as targets.
Comment A support base at 111.90 has formed and has allowed for a temporary stabilisation.