Sample Category Title
EUR/USD Daily Outlook
Daily Pivots: (S1) 1.1269; (P) 1.1292; (R1) 1.1303; More.....
EUR/USD is staying in consolidation from 1.1324 and intraday bias remains neutral. With 1.1250 minor support intact, further rise is in favor to 1.1448 resistance and above. But in that case, we'd expect strong resistance between 1.1448/1569 to limit upside. On the downside, below 1.1250 minor support will turn bias to the downside. Decisive break of 1.1176 will resume the down trend from 1.2555.
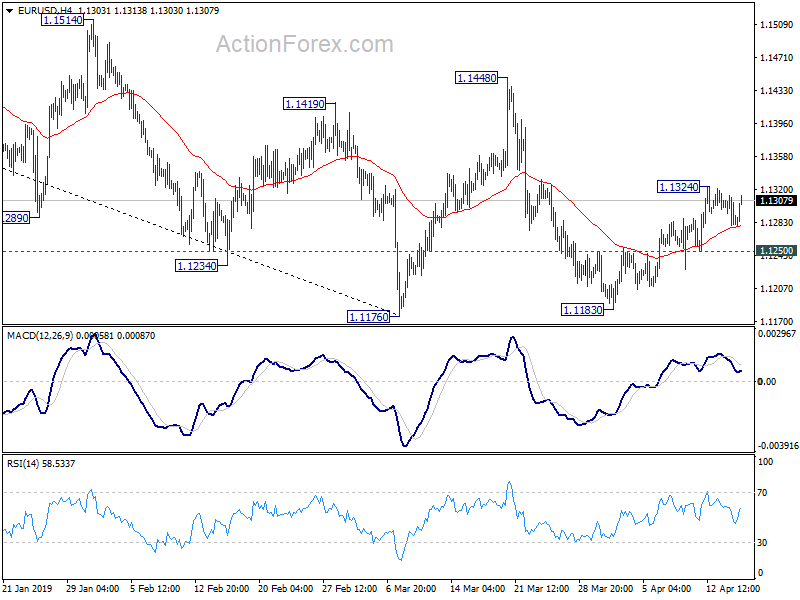
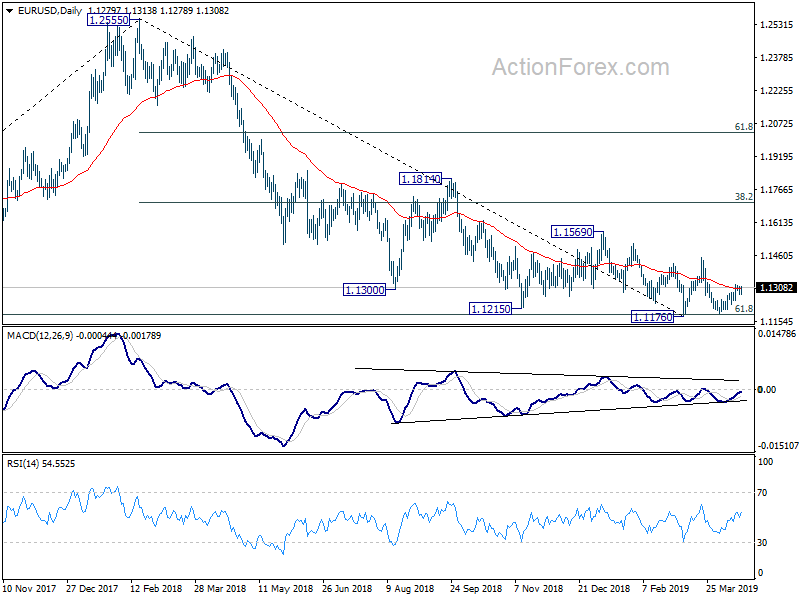
In the bigger picture, EUR/USD has been losing downside momentum around 61.8% retracement of 1.0339 (2016 low) to 1.2555 (2018 high) at 1.1186. But for now, there is no clear sign of medium term reversal yet. Downside from 1.2555 is expected to resume sooner or later as long as 1.1569 structural resistance holds. Decisive break of 1.1186. could pave the way back to 1.0339 low.
GBP/USD Daily Outlook
Daily Pivots: (S1) 1.3024; (P) 1.3068; (R1) 1.3094; More....
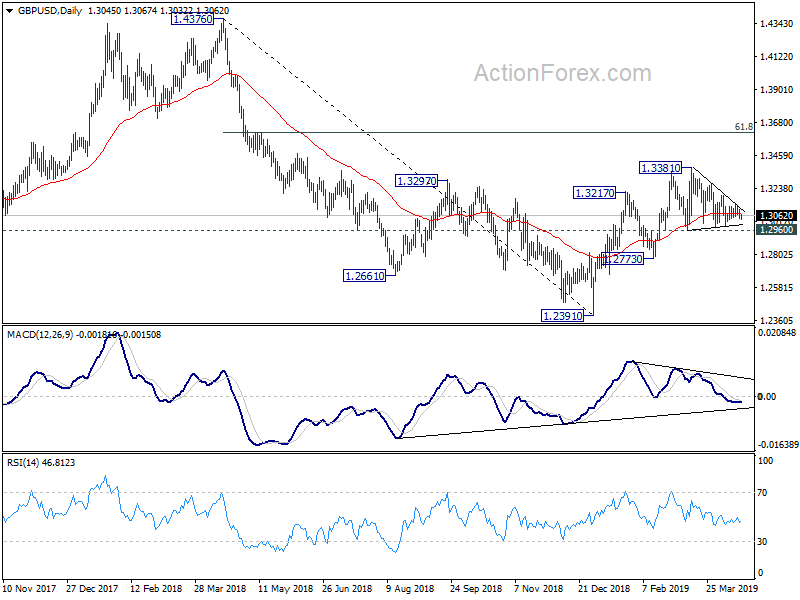
No change in GBP/USD's outlook as consolidation from 1.3381 is still extending. Intraday bias remains neutral and more sideway trading could be seen. Further rise is expected as long as 1.2960 support holds. On the upside, decisive break of 1.3381 resistance ill resume whole rise from 1.2391. Next target will be 61.8% retracement of 1.4376 to 1.2391 at 1.3618 next. However, on the downside, sustained break of 1.2960 will indicate that rebound from 1.2391 has completed earlier than expected. Deeper fall would then be seen to 1.2773 support for confirmation.
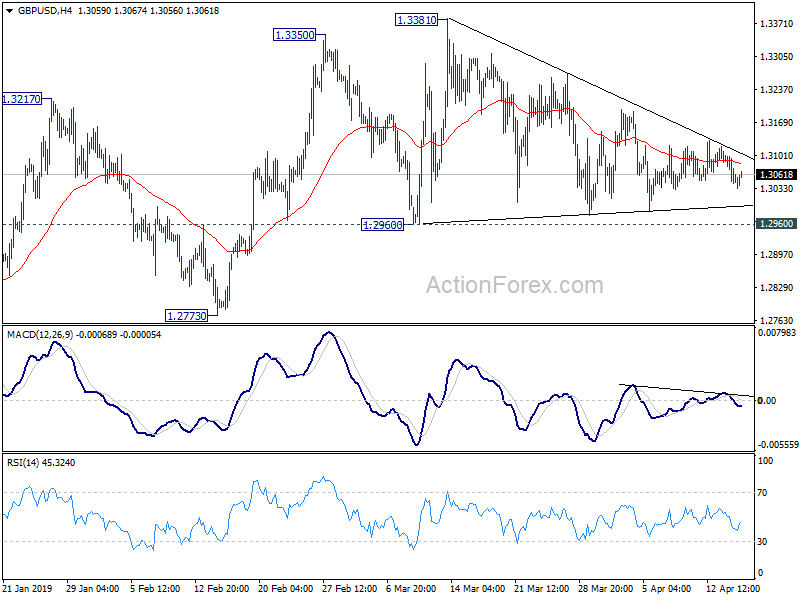
In the bigger picture, medium term decline from 1.4376 (2018 high) should have completed at 1.2391. Rise from 1.2391 is seen as the third leg of the corrective pattern from 1.1946 (2016 low). Further rise could be seen through 1.4376 in medium term. On the downside, though, break of 1.2773 support will dampen this view. Focus will be turned back to 1.2391 low and break will resume the fall from 1.4376 to 1.1946.
USD/CHF Daily Outlook
Daily Pivots: (S1) 1.0045; (P) 1.0064; (R1) 1.0096; More...
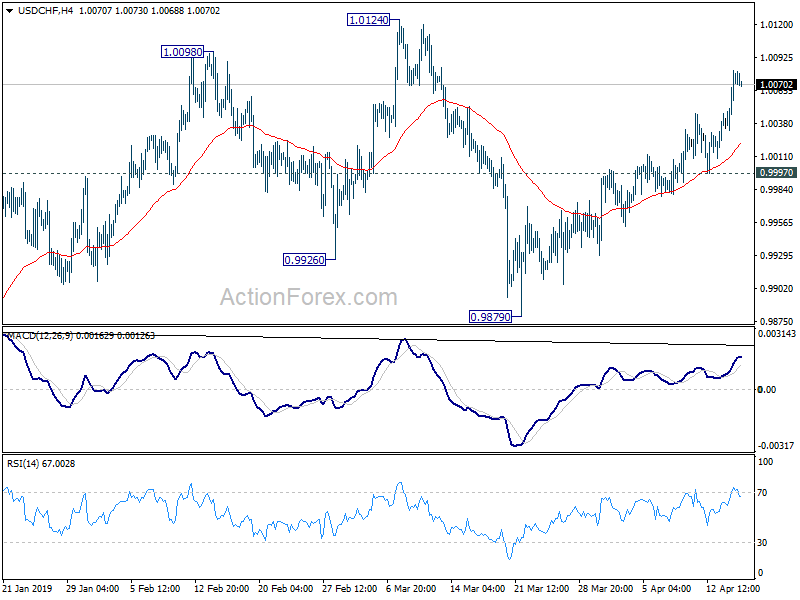
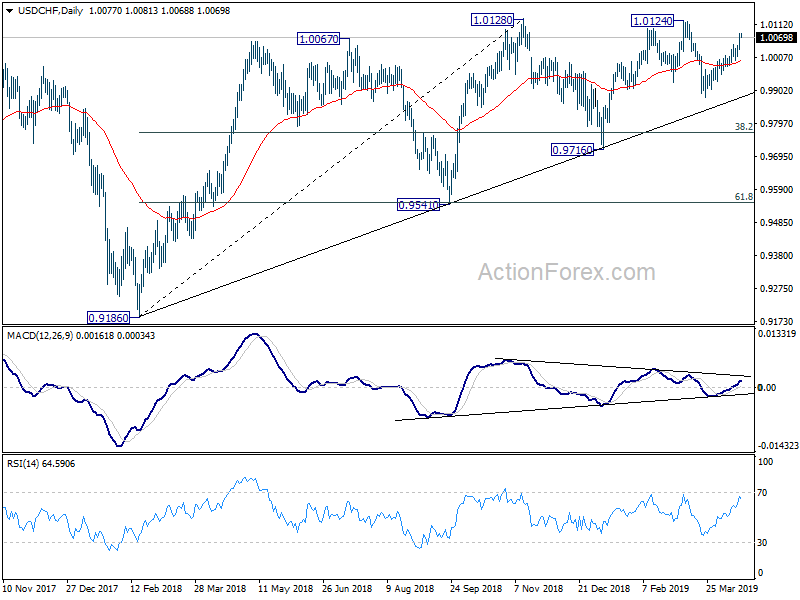
USD/CHF's choppy rise from 0.9879 is still in progress. Intraday bias stays on the upside for 1.0124/8 resistance. . However, as the structure of the rise is corrective looking, we'd expect strong resistance from 1.0124 to limit upside to bring another decline. On the downside, below 0.9997 minor support will turn bias to the downside for 0.9879 support.
In the bigger picture, loss of upside momentum is seen is bearish divergence in daily MACD. But there is no clear sign of bearish reversal in USD/CHF yet. Rise fro 0.9186 is likely still in progress. Decisive break of 1.0128 resistance will resume this medium term rally to 1.0342 resistance next. This will remain the preferred case now, as long as 0.9716 support holds.
USD/JPY Daily Outlook
Daily Pivots: (S1) 111.89; (P) 111.98; (R1) 112.12; More...
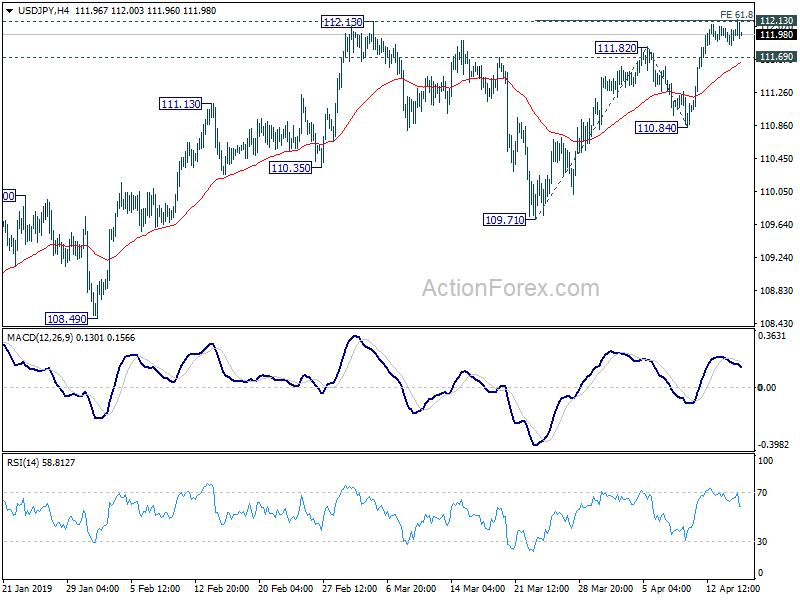
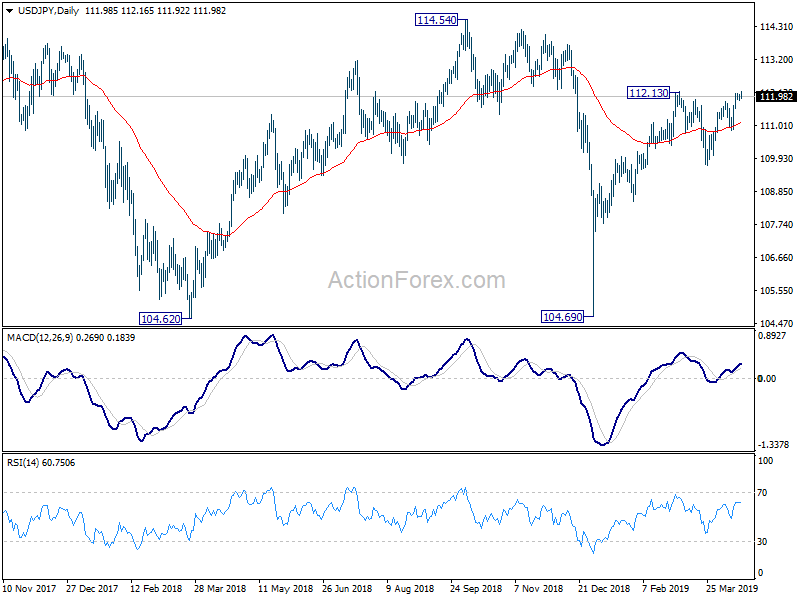
USD/JPY breached 112.13 briefly but cannot sustain above yet. Intraday bias remains neutral first. On the upside, sustained break of 112.13 will resume whole rise from 104.69 for 100 % projection of 109.71 to 111.82 and 110.84 at 112.95 first. On the downside, below 111.69 minor support will turn bias to the downside for 110.84 support. Break will bring deeper fall back to 109.71 support.
In the bigger picture, medium term outlook in USD/JPY remains a bit mixed as it's staying inside falling channel from 118.65, but there are signs of bullish reversal. On the upside, break of 114.54 resistance will revive the case the corrective fall from 118.65 has completed with three waves down to 104.69. And whole rise from 98.97 (2016 low) is resuming for 118.65 and above. But before that, outlook stays neutral first.
USD/CAD Daily Outlook
Daily Pivots: (S1) 1.3329; (P) 1.3366; (R1) 1.3387; More...
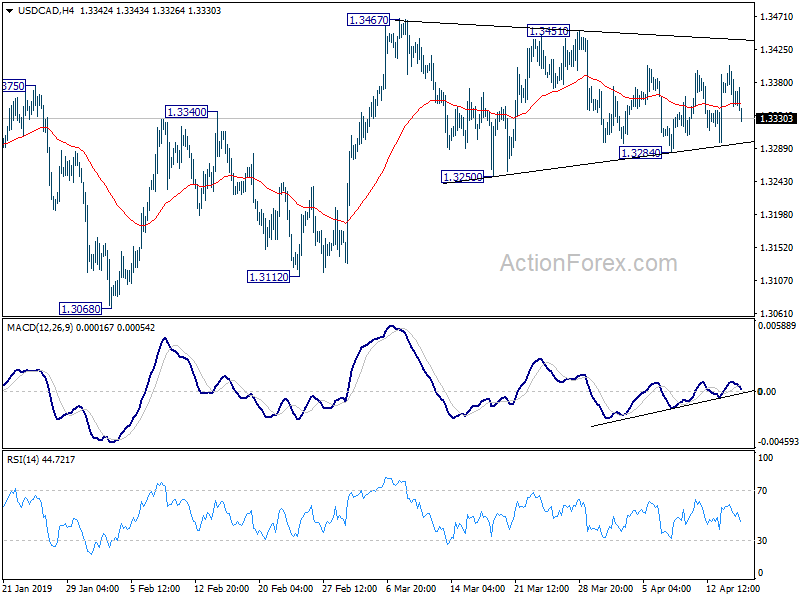
USD/CAD continues to gyrate in range below 1.3467 and intraday bias remains neutral. More sideway consolidation could be seen. Current development suggests that rise from 1.3068 is not finished, and further rise is in favor as long as 1.3250 support holds. On the upside, firm break of 1.3467 will confirm this case and target 1.3664 resistance next. However, decisive break of 1.3250 will turn bias back to the downside for 1.3068/3112 support zone instead.
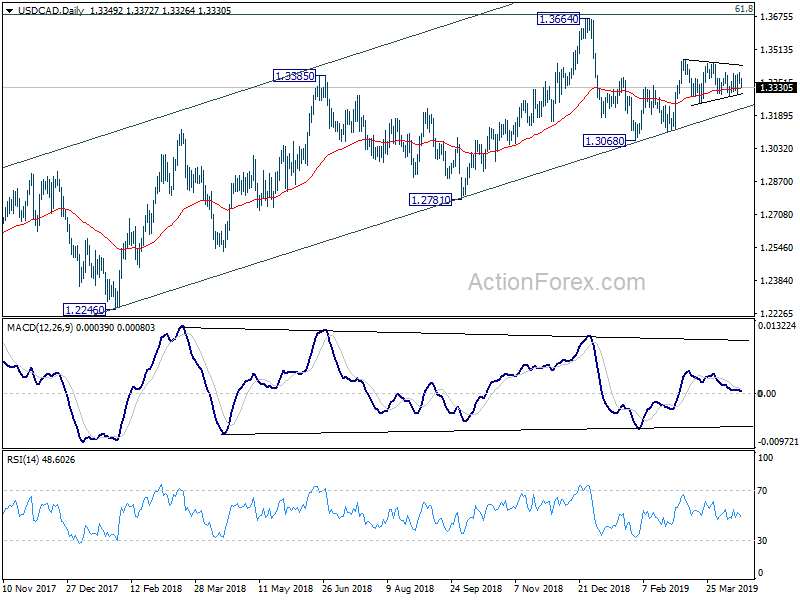
In the bigger picture, USD/CAD is staying well inside medium term rising channel (support at 1.3212). Thus, even though upside momentum and structure are unconvincing, further rise is still in favor. Decisive break of 61.8% retracement of 1.4689 (2016 high) to 1.2061 at 1.3685 and 1.3793 will pave the way to retest 1.4689 (2015 high). However, firm break of the channel support should indicate bearish reversal, after rejection by 1.3793, and bring deeper fall to 1.3068 support for confirmation.
Don’t Expect a Big Jolt to Growth if Trade Tensions Ease
Trade disruptions to date likely haven't had a significant impact, growth challenges are more fundamental
U.S.-initiated global trade spats have caused hand-wringing in policy circles, and significant disruptions for some businesses. Sentiment aside, the actual economic impact of the disputes has been relatively muted. And the spats don't fully explain the recent broad slowdown in global growth. In Canada and most other advanced economies, the overarching problem is that activity is running close to long-run capacity limits. That's a good problem from a worker's perspective, and explains why unemployment rates are around multi-decade lows in many countries, including Canada. It also makes it tougher for economies, including Canada's, to grow significantly above longer-run trend rates even if trade tensions ease in the near term. So don't bet on a dramatic boost to global economic growth if those tensions dissipate.
Putting the economic impact of trade disputes in context
About $340 billion of bilateral US-China trade has been subjected to new tariffs over the last year. That's an eye-popping number. But relatively speaking, it is still not that big compared to total trade flows for the two countries. Total US trade in 2018 was $5.7 trillion. China's was $5 trillion. In all, US import duties increased by about 1 percentage point as a share of total imports last year. That 1-percentagepoint tariff hike, on average, is probably not big enough to be very damaging to the broader macroeconomic backdrop.
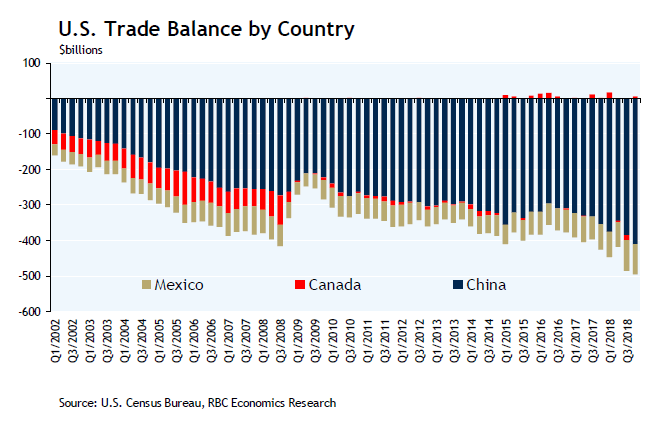
Nor have more aggressive US trade policies done much to reduce its trade 'imbalances.' The U.S. posted its largest trade deficit in history with China in Q4/2018, despite punitive measures put in place throughout the year.
Easing of US-China trade tensions won't mean immediate end of Canada's own trade irritants
It increasingly looks like the US won't ratify NAFTA's replacement. Still, NAFTA remains in the mean-time. So the odds of some form of free trade in North America similar to the status quo staying in place are still significantly higher today than they were a year ago when the new agreement was still being renegotiated.
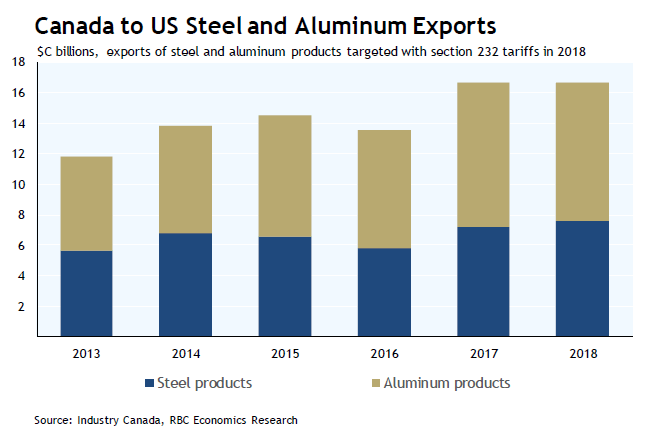
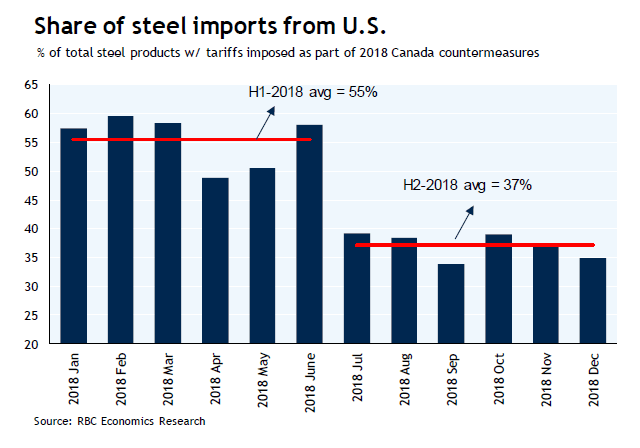
U.S. tariffs on Canadian steel and aluminum also remain in place. But the products targeted account for a relatively small 3% of Canadian merchandise exports. And exports of those products to the U.S. rose last year with U.S. producers and consumers seemingly forced to eat much of the tariff cost. Canada's retaliatory tariffs on U.S.-made products increased costs for Canadian purchasers too – but Canadian buyers seem to have been more successful at finding alternative markets. Imports of steel products targeted in the retaliatory measures increased about 5% in the second half of last year from the prior year, but the share coming from the US fell from about 55% ahead of the tariffs to under 40% after. Imports of all products targeted in Canada's retaliatory measures – the 25% steel tariffs plus 10% tariffs on aluminum and a mix of other products – increased ~2% over that period despite a 12% drop in those sourced from the U.S.
As in the US, new import duties have increased by about a percentage point as a share of total imports in Canada – probably not large enough to be a significant impediment to growth.
Canada has its own trade tensions with China
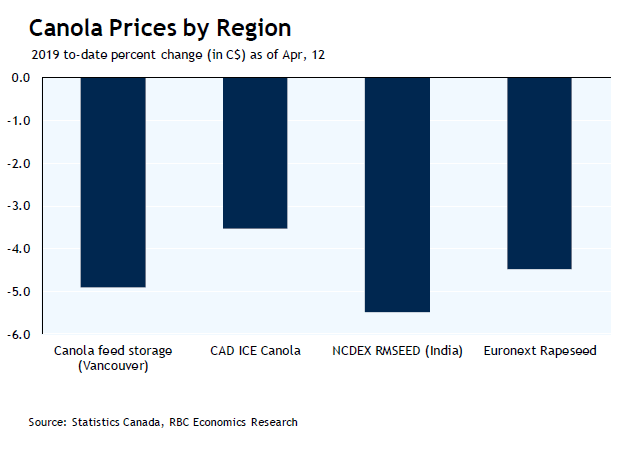
China imposed an effective ban on imports of Canadian canola as of March, ostensibly over pest issues but likely for political reasons. Although there could be some disruption to near-term trade flows, bilateral trading relationships typically matter far less in determining price for products like field crops than global supply and demand conditions. And price is ultimately what matters for domestic producers. Canola prices are down year-to-date, but not just in Canada, and most of the decline came before Chinese import restrictions were announced. From a macroeconomic perspective, the impact is limited. Canola exports accounted for about 10% of merchandise exports to China last year, but were about 0.5% of total Canadian goods exports. Overall, China accounted for about 5% of total Canadian goods exports last year.
Capacity constraints will limit the upside from easing tensions
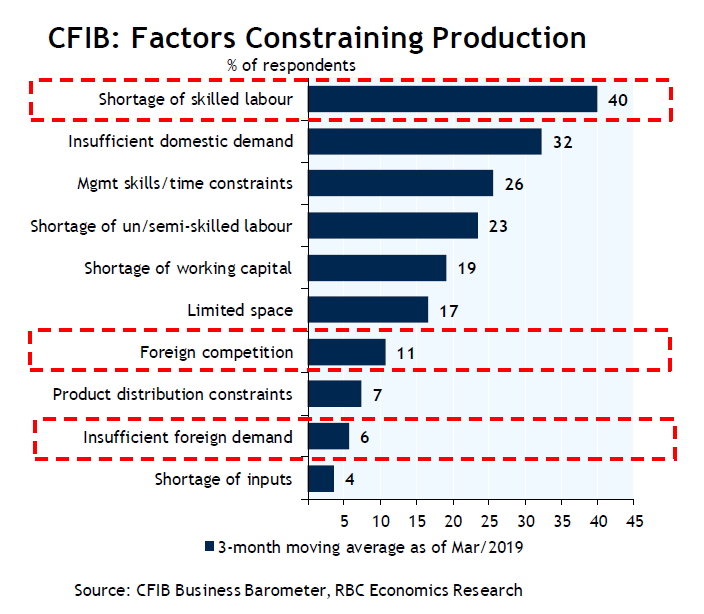
The more fundamental barrier to growth is that in most of Canada the economy is already running pretty close to long-run capacity limits. The number of businesses reporting labour shortages fell sharply in the Bank of Canada's closely watched Business Outlook Survey for Q1. But that wasn't entirely unexpected, given slower GDP growth in Q4 and Q1 due to (likely transitory) disruptions to oil & gas production. The unemployment rate remains right around multi-decade lows, and it is tough to imagine it moving (sustainably) much lower. Businesses continue to report labour shortages as a major obstacle to expansion. Growth in the pool of available labour will continue to be restrained by an aging population. About 250k workers, roughly 1 ¼% of the labour force, are retiring each year. And higher interest rates have increased Canadian workers' debt-servicing costs.
The picture is similar elsewhere. The US is dealing with its own labour shortages. And the economic boost it got last year from government tax cuts and spending increases won't likely be repeated anytime soon. In China, the echoes of the 'onechild' policy mean the working-age population is already declining. Given that demographic headwind, it would not be surprising for China's growth to continue to slow gradually minus a big spike in productivity. Easing trade tensions will do nothing to change that fundamental backdrop.
Where easing of trade tensions could help: restarting investment plans
While actual trade actions to date have impacted a relatively small share of Canadian businesses, a larger number have probably paused investment plans due to uncertainty around the global economic outlook. So resolving trade disputes could pull some business investment off the sidelines. That said, it's important to remember that foreign trade issues are not the only concerns for Canadian businesses. Indeed, "insufficient foreign demand" and "foreign competition" rank near the bottom of the list of business concerns in data from the Canadian Federation of Independent Business.
NZ CPI Review, Q1 2019 – Not Clear Cut
- The Consumer Price Index (CPI) rose by 0.1% in the March quarter, a little less than expected.
- Annual inflation slowed from 1.9% to 1.5%, largely reflecting a pullback in fuel prices over the quarter.
- However, measures of underlying inflation also remain subdued. Imported inflation is soft and domestic inflation is picking up only gradually.
- Market pricing is now leaning towards an OCR cut in May, but we emphasise that this remains a close call.
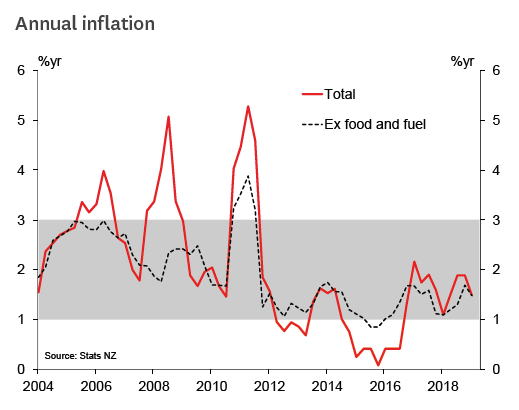
Inflation in New Zealand remains on the subdued side, despite a gradual pickup in domestic price pressures. The CPI rose by 0.1% in the March quarter, taking the annual inflation rate down to 1.5%. The quarterly result was a touch below the 0.2% rise that we and the Reserve Bank expected, and below the median market forecast of a 0.3% rise.
Financial markets reacted swiftly, with the New Zealand dollar falling by around 1% to 0.67 and the two-year swap rate falling by 11 basis points to 1.62%. Market pricing has now shifted to a better than even chance of an OCR cut at the May Monetary Policy Statement.
As it happens, we agree with that pricing – we switched to calling a May OCR cut a couple of weeks ago. But as RBNZ Governor Adrian Orr has emphasised in recent interviews, the outcome of the May review is far from settled. It's not obvious that today's result would tip the scales towards a May OCR cut: inflation is only slightly below where the RBNZ expected it to be at this point, and all of the surprise was on the more volatile tradables side.
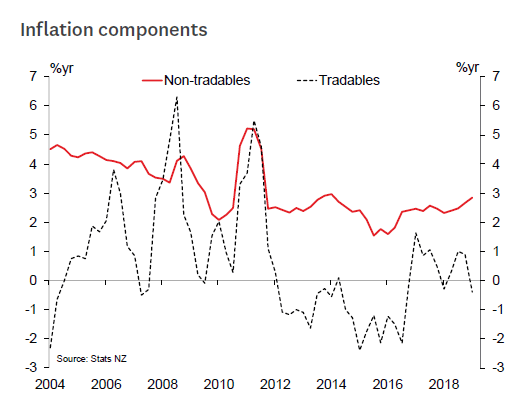
Meanwhile, non-tradables inflation is gradually picking up, as the RBNZ would have hoped. But it needs to rise further to be consistent with a sustained return to 2% overall inflation. The question for the RBNZ will be whether current policy settings are enough to achieve that, in the midst of concerns about slower growth both here and internationally.
Details
The 0.1% increase for the March quarter saw annual inflation slow from 1.9% to 1.5%, matching the pace seen in the June quarter last year. The various measures of 'core' inflation, which exclude large price movements, were largely in a range of 1.5-1.7%.
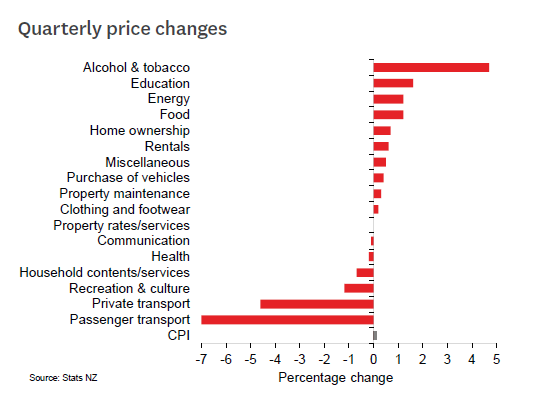
The biggest contributor to the slowdown in annual inflation was petrol prices. The 7% drop in prices for the quarter meant that they went from being up around 11% year-onyear to almost flat. Fuel prices have started to rise again in recent weeks, though it will take some time before this boosts the annual inflation rate again.
Tradables prices fell by 1.3% in the March quarter, and were down 0.4% on a year ago. Aside from fuel prices, the biggest contributor was a 12% seasonal decline in international airfares.
Retailers' pricing power remains subdued in the importheavy tradables categories such as electronics and home furnishings. That said, it's not necessarily weaker than was already believed. There were several overs and unders relative to our forecast, and a single item – a 6.7% plunge in furniture prices, the biggest fall on record – accounted for effectively all of the surprise for us.
In contrast, non-tradables prices rose by 1.1% as expected, with the annual increase lifting slightly to 2.8%. The annual increase in tobacco excise duty was the biggest positive contributor – although by less than expected, with signs that retailers are struggling to maintain cigarette prices at such high levels. Accommodation and car rentals rose by more than we expected during the peak travel season, but domestic airfares were a bit softer.
Housing-related items make up a significant chunk of nontradables, and they continued to make steady contributions in the March quarter. New dwelling prices rose by 0.7%, with some signs of renewed momentum in Auckland and Canterbury – a little surprising given the cooling in house sale prices in those regions. Rents rose by 0.6%, maintaining the pace of recent quarters.
Looking ahead, we expect the June quarter CPI to be stronger than today's result. Fuel prices are heading up again, the minimum wage increase in April is likely to come through in the cost of eating out, and Stats NZ will be adopting a new method of calculating rents that tends to track a bit higher than the old method. But with the persistent headwinds to tradables inflation in particular, we expect annual inflation to remain below 2% through to the end of this year.
AUD/USD Daily Outlook
Daily Pivots: (S1) 0.7149; (P) 0.7165; (R1) 0.7190; More...
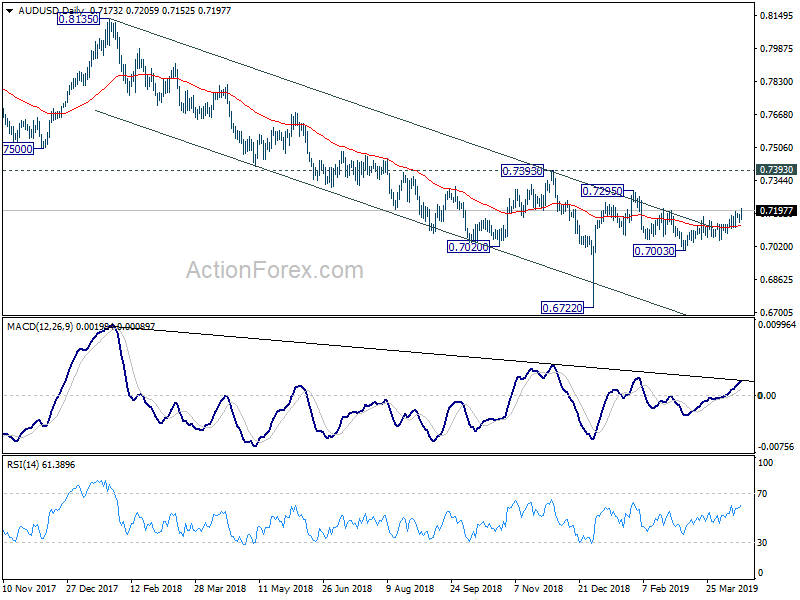
AUD/USD's choppy rise from 0.7003 resumed by taking out 0.7192 and reaches as high as 0.7205 so far. Intraday bias is back on the upside for 0.7295 resistance. Upside momentum is relatively weak and structure of the recovery is corrective looking. Thus, upside could be limited by 0.7295 to bring near term reversal. On the downside, break of 0.7139 minor support will turn intraday bias back to the downside for 0.7003/7052 support zone instead.
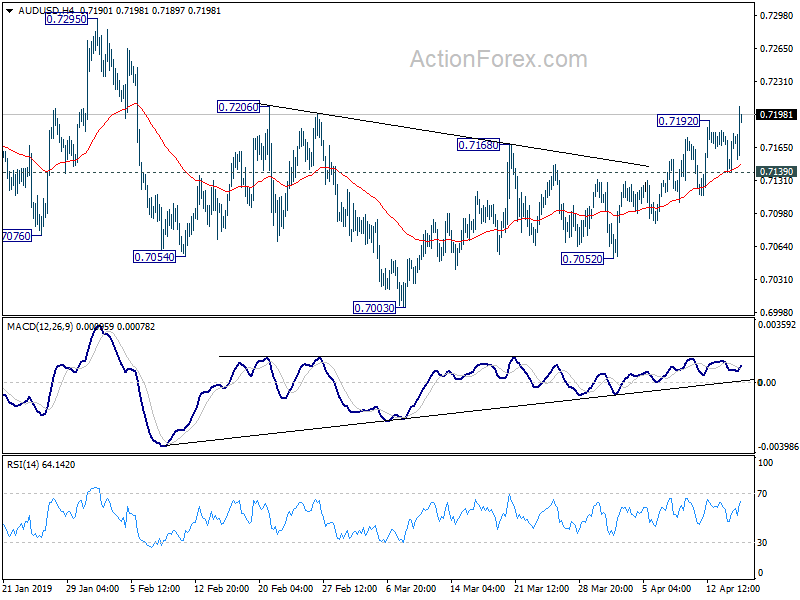
In the bigger picture, break of medium term channel resistance is the first sign of bullish reversal. But there is no confirmation yet. As long as 0.7393 resistance holds, larger fall from 0.8135 is still expected to resume later. Such decline is seen as resuming long term down trend from 1.1079 (2011 high). Decisive break of 0.6826 (2016 low) will confirm this bearish view and resume the down trend to 0.6008 (2008 low). However, firm break of 0.7393 will argue that fall from 0.8135 has completed. And corrective pattern from 0.6826 has started the third leg, targeting 0.8135 again.
Aussie Lifted by Strong China Data, Kiwi Tumbles on CPI and RBNZ Bets
Australian and New Zealand Dollars have very different fortunes today. Aussie was boosted higher by stronger than expected Chinese data. On the other hand, Kiwi dived as weaker than expected CPI raises the chance of RBNZ rate cut at next meeting. In between, Euro is the second strongest so far, followed by Sterling. Dollar is the second weakest, followed by Yen. Focus will turn to more inflation data from UK and Canada today.
Technically, AUD/USD's choppy rise resumed and edged higher to 0.7205. Further rise is mildly in favor towards 0.7295 resistance. EUR/AUD's break of 1.5721 support now suggests resumption of fall form 1.6765. USD/JPY edged higher and breached 112.13 key resistance. But there is no follow through buying to push it through this key resistance yet.
In Asia, Nikkei is currently up 0.30%. Hong Kong HSI is down -0.13%. China Shanghai SSE is up 0.15%. Singapore Strait Times is up 0.44%. Japan 10-year JGB yield is up 0.012 at -0.008. Overnight, DOW rose 0.26%. S&P 500 rose 0.05%. NASDAQ rose 0.30%. 10-year yield rose 0.039 to 2.592. 10-year yield could have a take on 2.6 handle today and firm break could give Dollar a lift.
China Q1 GDP grew 6.4%. Production, sales, investment rebounded
Another batch of data from China released today surprised on the upside. GDP growth came in at 6.4% yoy in Q1, unchanged from prior quarter and beat expectation of 6.3% yoy.
In March, industrial production rose strongly by 8.5% ytd yoy, accelerated from 5.3% and beat expectation of 5.6%. Retail sales rose 8.7% ytd yoy, up fro 8.2% and beat expectation of 8.3%. Fixed asset investment rose 6.3% ytd yoy, up from 6.1% yoy and matched expectation of 6.3%. Jobless rate also improved from 5.3% to 5.2%.
Recent data from China continued to paint the picture of stabilization in slowdown, and raised hope that recovery is on the way. That's an important condition for improvement in global outlook.
New Zealand CPI slowed to 1.5%, solidifies need for imminent RBNZ easing
New Zealand Dollar drops sharply after worse than expected consumer inflation data. CPI rose 0.1% qoq in Q1, below expectation of 0.3% qoq. Annually, CPI slowed to 1.5% yoy, down from 1.9% yoy and missed expectation of 1.7% yoy. Tradeable CPI dropped -0.4% yoy while non-tradeable CPI rose 2.8% yoy.
CPI has been persistently weak and remained below mid-point of RBNZ's 1-3% target range for the eight consecutive quarter. Indeed, CPI has only breached 2% level once in Q1 2017 (2.2%) since 2011. Yesterday, RBNZ Governor Adrian Orr noted that "possibilities of first quarter inflation numbers being undershot have already being factored in the RBNZ's dovish bias". The downside surprise is giving Orr an even worse picture and solidifies the imminent need for policy easing.
From Australia, Westpac leading index rose 0.2% mom in March.
Japan exports slumped in March, raised concerns of Q1 GDP contraction
In March, in trend terms, Japan's exports dropped -2.4% yoy to JPY 7.20T. Imports rose 1.1% yoy to JPY 6.67T. Trade surplus came in at JPY 0.53T, up from prior month's JPY 0.33T. In seasonally adjusted terms, exports dropped -1.0% yoy to JPY 6.61T. Imports rose 2.1% yoy to JPY 6.78T. Trade deficit was at JPY -0.18T.
Exports to China, Japan's largest trading partner, dropped -9.4% yoy, reversing from 5.6% growth in February. Exports to Asia as a whole dropped -5.5% yoy, a fifth straight month of decline. The slump in exports could drag down capital expenditure and private consumption growth . And it raised concerns that the economy contracted again in Q1.
Also from Japan, industrial production was finalized at 0.7% mom in February.
US raised very large trade deficit with Japan during trade talks
The US Trade Representative issued a statement regarding the meeting of USTR Robert Lighthizer and Japan's Economic Revitalization Minister Toshimitsu Motegi on April 15-16 in Washington.
In the statement, it's noted that US and Japan "discussed trade issues involving goods, including agriculture, as well as the need to establish high standards in the area of digital trade". Also, US raised its "very large trade deficit with Japan – $67.6 billion in goods in 2018." Both sides agreed to meet again in the "near future to continue these talks".
Motegi said yesterday that no agreement has been made. But he hoped to reach a "good result" on the talks "at an early stage." There will be further discussions next week before the US-Japan summit. Meanwhile, discussions regarding exchange rate would be left to finance ministers.
Amamiya: BoJ mindful of risks including financial imbalances
BoJ Deputy Governor Masayoshi Amamiya said the central bank is "ready to respond" financial crisis threatens the stability of the banking system.
He pointed to experience in the late 1980s, and noted "one of the factors that led to Japan's asset-inflated bubble was the fact we kept monetary policy easy even as the economy continued to expand". Hence, "the BOJ must be mindful of the potential risks to the economy and prices, including financial imbalances,"
Regarding monetary policy, Amamiya said "we're ready to respond if financial problems have a big impact on the economy."
Looking ahead
UK inflation data will be a major focus in European session with CPI, RPI, PPI and house price featured. Eurozone will release current account, trade balance and CPI final. Later in the day, Canada will release CPI. US will release trade balance, wholesale inventories and Fed's Beige Book economic report.
AUD/USD Daily Outlook
Daily Pivots: (S1) 0.7149; (P) 0.7165; (R1) 0.7190; More...
AUD/USD's choppy rise from 0.7003 resumed by taking out 0.7192 and reaches as high as 0.7205 so far. Intraday bias is back on the upside for 0.7295 resistance. Upside momentum is relatively weak and structure of the recovery is corrective looking. Thus, upside could be limited by 0.7295 to bring near term reversal. On the downside, break of 0.7139 minor support will turn intraday bias back to the downside for 0.7003/7052 support zone instead.
In the bigger picture, break of medium term channel resistance is the first sign of bullish reversal. But there is no confirmation yet. As long as 0.7393 resistance holds, larger fall from 0.8135 is still expected to resume later. Such decline is seen as resuming long term down trend from 1.1079 (2011 high). Decisive break of 0.6826 (2016 low) will confirm this bearish view and resume the down trend to 0.6008 (2008 low). However, firm break of 0.7393 will argue that fall from 0.8135 has completed. And corrective pattern from 0.6826 has started the third leg, targeting 0.8135 again.
Economic Indicators Update
| GMT | Ccy | Events | Actual | Forecast | Previous | Revised |
|---|---|---|---|---|---|---|
| 22:45 | NZD | CPI Q/Q Q1 | 0.10% | 0.30% | 0.10% | |
| 22:45 | NZD | CPI Y/Y Q1 | 1.50% | 1.70% | 1.90% | |
| 23:50 | JPY | Trade Balance (JPY) Mar | -0.18T | -0.30T | 0.12T | 0.03T |
| 0:30 | AUD | Westpac Leading Index M/M Mar | 0.20% | 0.00% | ||
| 2:00 | CNY | GDP Y/Y Q1 | 6.40% | 6.30% | 6.40% | |
| 2:00 | CNY | Industrial Production YTD Y/Y Mar | 8.50% | 5.60% | 5.30% | |
| 2:00 | CNY | Retail Sales YTD Y/Y Mar | 8.70% | 8.30% | 8.20% | |
| 2:00 | CNY | Fixed Assets Ex Rural YTD Y/Y Mar | 6.30% | 6.30% | 6.10% | |
| 2:00 | CNY | Surveyed Jobless Rate Mar | 5.20% | 5.30% | ||
| 4:30 | JPY | Industrial Production M/M Feb F | 0.70% | 1.40% | 1.40% | |
| 8:00 | EUR | Eurozone Current Account (EUR) Feb | 33.2B | 36.8B | ||
| 8:30 | GBP | CPI M/M Mar | 0.20% | 0.50% | ||
| 8:30 | GBP | CPI Y/Y Mar | 2.00% | 1.90% | ||
| 8:30 | GBP | Core CPI Y/Y Mar | 1.90% | 1.80% | ||
| 8:30 | GBP | RPI M/M Mar | 0.20% | 0.70% | ||
| 8:30 | GBP | RPI Y/Y Mar | 2.60% | 2.50% | ||
| 8:30 | GBP | PPI Input M/M Mar | 0.50% | 0.60% | ||
| 8:30 | GBP | PPI Input Y/Y Mar | 4.10% | 3.70% | ||
| 8:30 | GBP | PPI Output M/M Mar | 0.30% | 0.10% | ||
| 8:30 | GBP | PPI Output Y/Y Mar | 2.20% | 2.20% | ||
| 8:30 | GBP | PPI Output Core M/M Mar | 0.10% | 0.10% | ||
| 8:30 | GBP | PPI Output Core Y/Y Mar | 2.20% | 2.20% | ||
| 8:30 | GBP | House Price Index Y/Y Feb | 1.30% | 1.70% | ||
| 9:00 | EUR | Eurozone Trade Balance (EUR) Feb | 16.8B | 17.0B | ||
| 9:00 | EUR | Eurozone CPI M/M Mar | 0.30% | 0.30% | ||
| 9:00 | EUR | Eurozone CPI Y/Y Mar F | 1.40% | 1.50% | ||
| 9:00 | EUR | Eurozone CPI Core Y/Y Mar F | 0.80% | 0.80% | ||
| 12:30 | CAD | International Merchandise Trade (CAD) Feb | 3.50B | -4.25B | ||
| 12:30 | CAD | CPI M/M Mar | 0.60% | 0.70% | ||
| 12:30 | CAD | CPI Y/Y Mar | 1.30% | 1.50% | ||
| 12:30 | CAD | CPI Core - Common Y/Y Mar | 1.80% | |||
| 12:30 | CAD | CPI Core - Median Y/Y Mar | 1.80% | |||
| 12:30 | CAD | CPI Core - Trim Y/Y Mar | 1.90% | |||
| 12:30 | USD | Trade Balance (USD) Feb | -53.5B | -51.1B | ||
| 14:00 | USD | Wholesale Inventories M/M Feb | 0.40% | 1.20% | ||
| 14:30 | USD | Crude Oil Inventories | 7.0M | |||
| 18:00 | USD | Federal Reserve Beige Book |
Eurozone Construction Output Rose To A 2-Year High Level In February
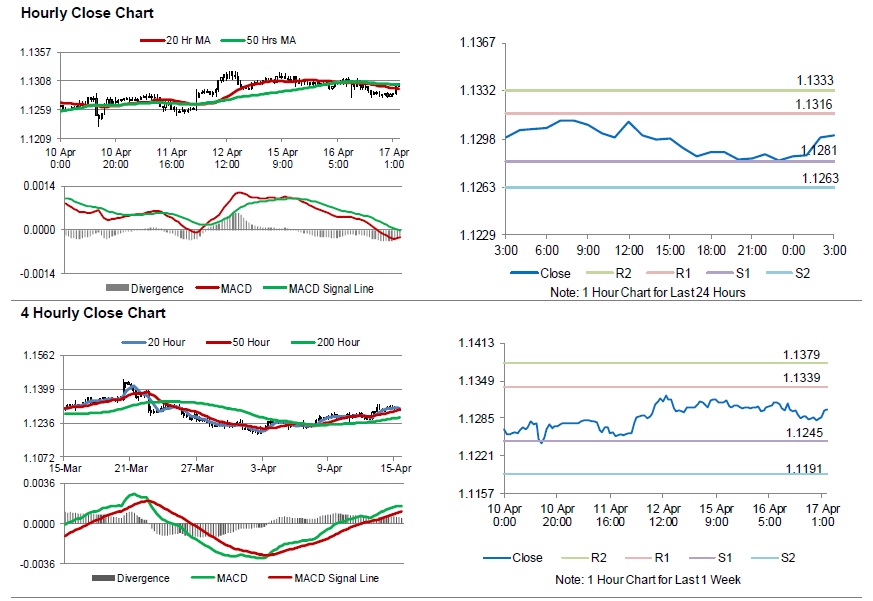
For the 24 hours to 23:00 GMT, the EUR declined 0.19% against the USD and closed at 1.1282.
On the data front, the Eurozone seasonally adjusted construction output climbed to a 2-year high level of 3.0% on a monthly basis, in February. In the prior month, construction output had recorded a revised drop of 0.8%.
Separately, in Germany, the ZEW economic sentiment index jumped to a level of 3.1 in April, surpassing market expectations for a rise to a level of 0.5. In the previous month, the index had recorded a reading of -3.6. Meanwhile, the nation’s current situation index eased to a level of 5.5 in April, less than market consensus for a fall to a level of 8.5. The index had registered a reading of 11.1 in the previous month.
The US dollar gained ground against a basket of currencies, amid upbeat housing market data.
In the US, data indicated that the NAHB housing market index rose to a level of 63.0 in April, marking its highest level in six-month amid fall in mortgage prices and at par with market expectations and. In the preceding month, the index had recorded a reading of 62.0. Moreover, the nation’s manufacturing production unexpectedly remained steady on a monthly basis, in March, compared to a revised drop of 0.3% in the prior month. Market participants had expected the manufacturing production to advance 0.1%.
On the flipside, the nation’s industrial production unexpectedly slid 0.1% on a monthly basis, in March, defying market anticipation for a gain of 0.2%. In the prior month, industrial production had recorded a rise of 0.1%.
In the Asian session, at GMT0300, the pair is trading at 1.1300, with the EUR trading 0.16% higher against the USD from yesterday’s close.
The pair is expected to find support at 1.1281, and a fall through could take it to the next support level of 1.1263. The pair is expected to find its first resistance at 1.1316, and a rise through could take it to the next resistance level of 1.1333.
Moving ahead, traders would keep an eye on the Euro-zone’s trade balance data for February and consumer price index for March, slated to release in a few hours. Later in the day, the US trade balance data for February along with the weekly MBA mortgage applications, will be on investors’ radar. Also, the US Federal Reserve’s Beige Book set to release later in the day, will keep the traders on their toes.
The currency pair is trading above its 20 Hr moving average and showing convergence with its 50 Hr moving average.