
Sample Category Title
USD/CHF Daily Outlook
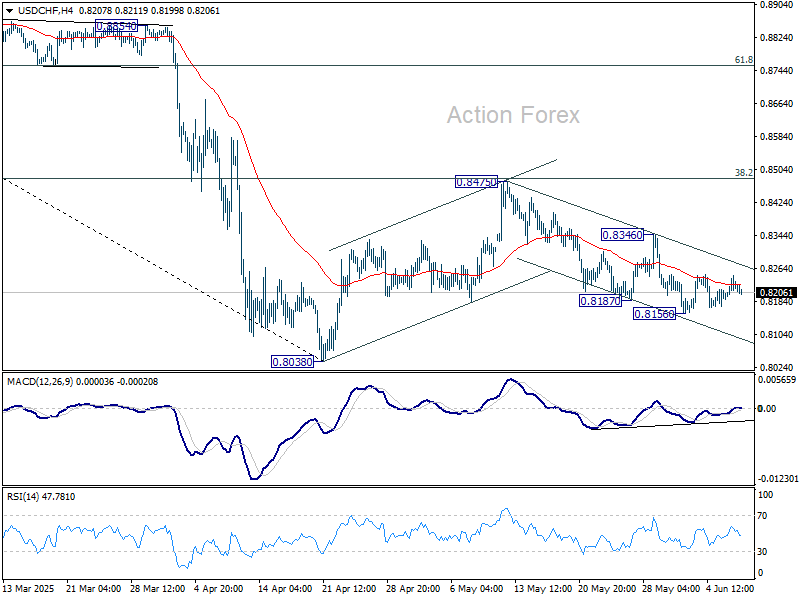
Daily Pivots: (S1) 0.8191; (P) 0.8220; (R1) 0.8248; More….
Intraday bias in USD/CHF remains neutral at this point. Price actions from 0.8038 are seen as a corrective pattern to decline from 0.9200. While fall from 0.8475 might extend lower, downside should be contained by 0.8038 to bring rebound. Break of 0.8436 resistance will suggest that it's already in the third leg of the correction, and target 0.8475.
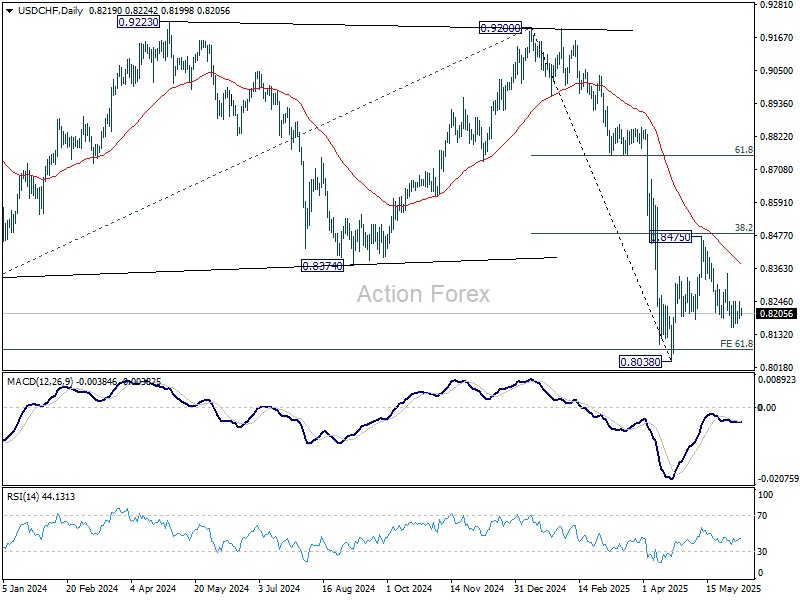
In the bigger picture, long term down trend from 1.0342 (2017 high) is still in progress and met 61.8% projection of 1.0146 (2022 high) to 0.8332 from 0.9200 at 0.8079 already. In any case, outlook will stay bearish as long as 55 W EMA (now at 0.8696) holds. Sustained break of 0.8079 will target 100% projection at 0.7382.
USD/CAD Daily Outlook
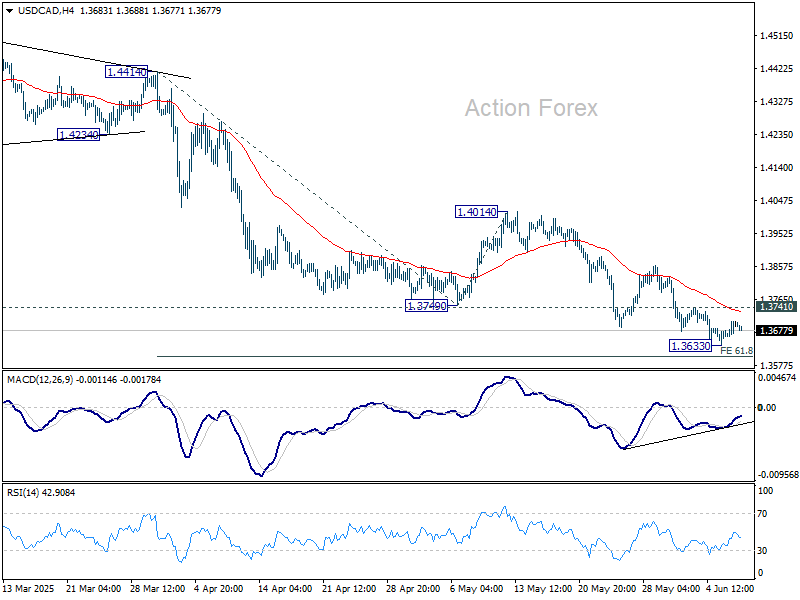
Daily Pivots: (S1) 1.3668; (P) 1.3686; (R1) 1.3712; More...
Intraday bias in USD/CAD remains neutral for the moment. Considering bullish convergence condition in 4H MACD, firm break of 1.3741 will indicate short term bottoming at 1.3633. Intraday bias will turn back to the upside for stronger rebound to 1.4014 resistance, as a correction to fall from 1.4791. Nevertheless, decisive break of 61.8% projection of 1.4414 to 1.3749 from 1.4014 at 1.3603 will pave the way to 100% projection at 1.3349.
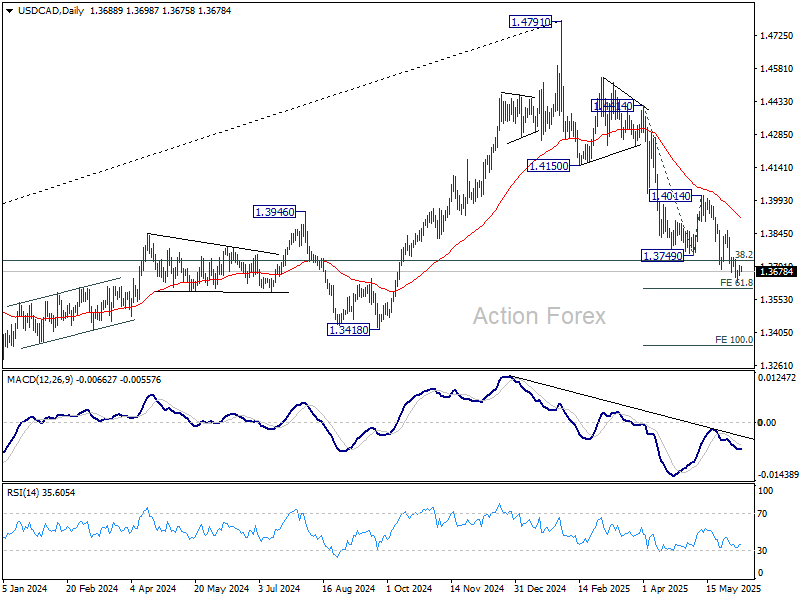
In the bigger picture, price actions from 1.4791 medium term top could either be a correction to rise from 1.2005 (2021 low), or trend reversal. In either case, further decline is expected as long as 1.4014 resistance holds. Firm break of 38.2% retracement of 1.2005 (2021 low) to 1.4791 at 1.3727 will pave the way back to 61.8% retracement at 1.3069.
Gold Tests 3,300 as Downside Pressures Persist
- Gold is in danger of breaching 3,300 after false breakout.
- 20-day SMA is holding as support for now.
- Neutral-to-bearish bias in the short term.
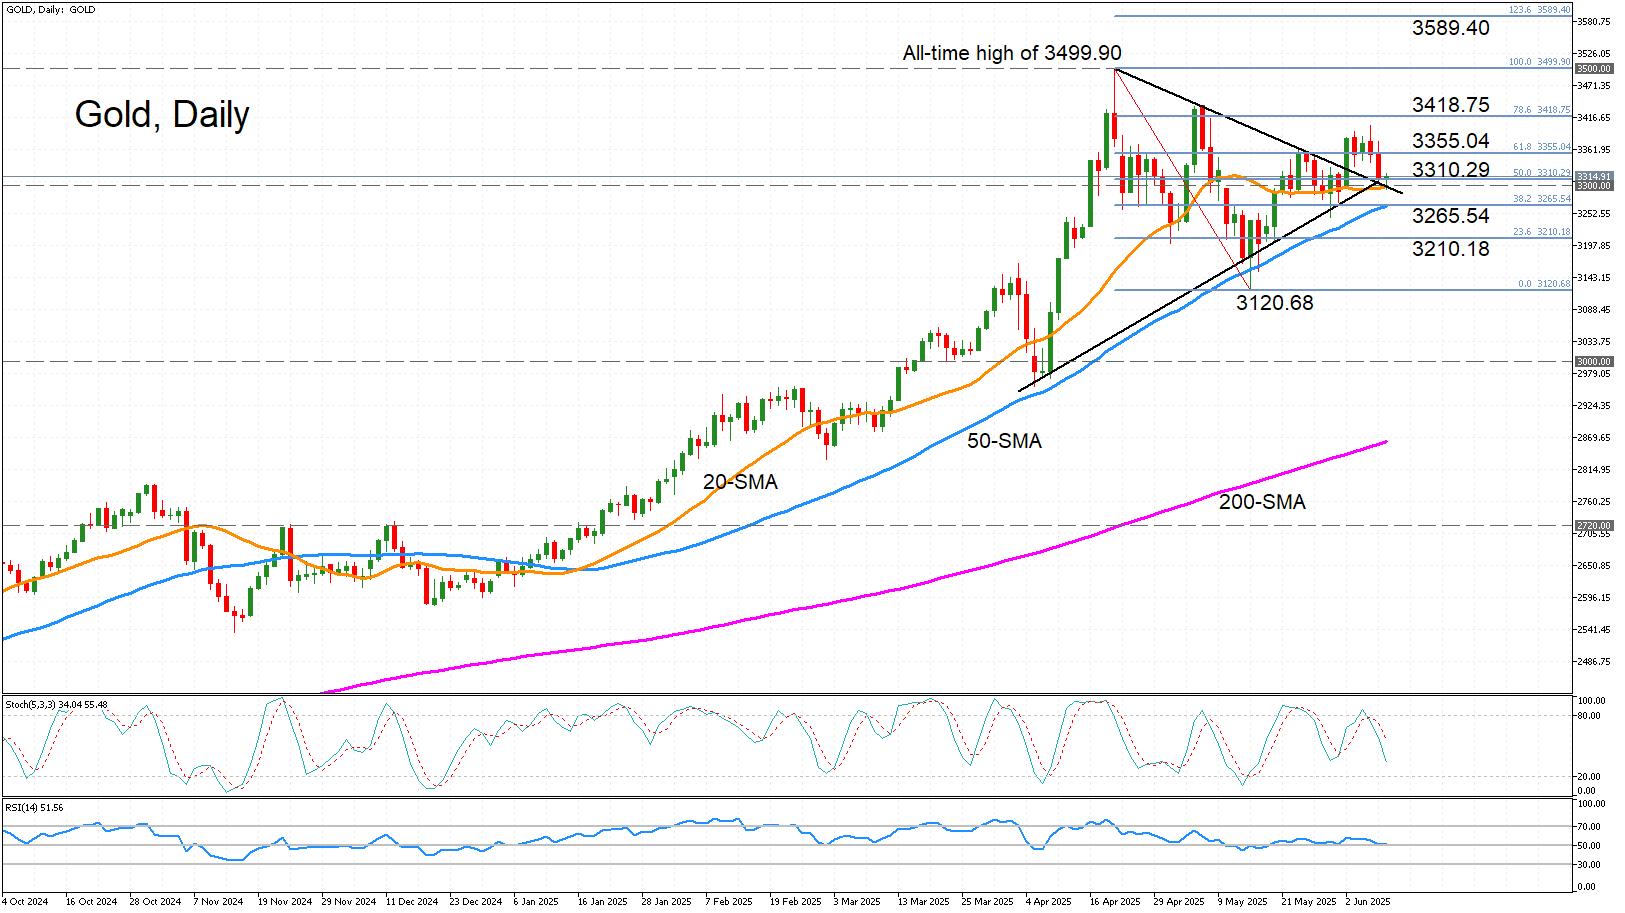
Gold hasn’t had the best start to the week, as it faces selling pressure for the third straight day, following the false breakout from the bullish pennant formation. Hopes that negotiators from the US and China will make progress in resolving their trade dispute when they meet in London later today is aiding risk sentiment.
The momentum indicators point to a lacklustre session. The stochastics are headed sharply lower but remain some distance from the oversold zone. However, the RSI has flatlined just above the 50 level. This neutral-to-bearish bias is clearly displayed in the price action, with immediate support coming from the 20-day simple moving average (SMA) just beneath the 3,300 mark.
Should gold breach this critical barrier, there’s likely to be further support at the 50-day SMA, which is about to intersect the 38.2% Fibonacci retracement of the April-May downleg at 3,265.54. Further down, the 23.3% Fibonacci of 3,210.18 could halt the decline before the May low of 3,120.68 comes into range.
If, though, the 20-day SMA is successful in fending off the bears and the price reverses higher, there could be another stiff battle around the 3,355 area, which encompasses the 61.8% Fibonacci. After that, attention would turn to the May peak of 3,437.76 before gold makes another attempt at its all-time high of 3,499.90 set in April.
In a nutshell, gold is struggling to regain some momentum and whether it holds above the 20-day SMA or slips below it could determine the next direction. Dropping below the May trough of 3,120.68 would set the precious metal on a new bearish phase, while only a climb above 3,500.00 would restore the longer-term bullish outlook.
All Eyes on US-China Talks
Last week ended on a positive note. Improved headlines on the trade front between the US and China and a set of better-than-expected US jobs data helped lift the S&P 500 by 1.5% over the week. The Nasdaq 100 rallied 2% despite a sharp selloff in Tesla shares amid a heated dispute between Donald Trump and Elon Musk. As a result, the Nasdaq closed the week just below its all-time high reached in February, while the S&P 500 hit and closed at the key 6,000 psychological level – the first time since February we've seen the major US index trading at this level. We are now approaching overbought conditions.
On the bond front, Friday’s rally was driven largely by a narrative that the US economy remains surprisingly resilient despite trade chaos and geopolitical uncertainty. The US economy added 139K new nonfarm jobs in May, while wage growth unexpectedly accelerated – giving further ammunition to Federal Reserve (Fed) hawks arguing against a July rate cut. As it stands, September looks like the earliest point at which the Fed might consider cutting rates… and even that depends on inflation. On Wednesday, the US will publish its latest CPI data, and forecasts point to growing price pressures – both in headline and core metrics – which could further cool expectations for rate cuts. The US 2-year yield jumped past the 4% mark on Friday. At these levels, the Fed is unlikely to act as a catalyst for equity bulls. However, a strong auction of 30-year US bonds on Thursday could help ease concerns at the long end of the yield curve – as the 30-year yield opens the week just below the 5% psychological level.
More positive trade news could also help sentiment.
Speaking of inflation and trade: Chinese exports grew much slower than expected in May – weighed down by still-elevated triple-digit import tariffs – while imports fell significantly more than forecast. Consumer prices declined for the fourth consecutive month, and the drop in producer prices deepened. Chinese equities opened the week on a mildly positive note, supported by hopes that weak macro data will prompt further stimulus from the People’s Bank of China (PBoC) and the government, and that the second round of US-China trade talks – today in London – could lead to further progress. Last week, a phone call between Trump and Xi yielded news that China would relax export controls on rare earth metals to the US, suggesting the US may also ease restrictions on certain technology exports. Still, some observers warn that the second round of talks may not bring the same level of progress as the first. Any lack of progress could prompt bulls to take profits and move to the sidelines.
In earnings, Oracle and Adobe will be in focus on Wednesday and Thursday, respectively. Oracle’s results will provide an update on cloud infrastructure momentum, while Adobe’s will offer insight into whether consumers are willing to pay for AI tools. Last quarter, Oracle’s infrastructure business grew 50% on demand from major clients including Nvidia and OpenAI. However, the multibillion-dollar Stargate data center expansion has raised concerns about margins and whether the company is spending more on AI than investors are comfortable with.
Elsewhere, European growth data surprised to the upside on Friday, with Ireland and Germany particularly standing out. The upside surprise was largely due to net trade, as exporters rushed to ship goods ahead of expected US tariffs – a possibly temporary boost – but investment also rose in Q1, in line with more government spending, particularly on security. The Stoxx 600 closed the week 0.9% higher. The EURUSD remained bid below the 1.14 level, although the pair has yet to break through 1.15 resistance. The European Central Bank (ECB) delivered another 25bp rate cut but signaled that this may be the end of the rate-cutting cycle. Still, continued inflows into euro-denominated assets should help support the euro against the dollar.
In Japan, GDP figures released earlier today showed stronger-than-expected growth and hotter-than-expected inflation – reinforcing expectations of a more hawkish Bank of Japan (BoJ) stance. The USDJPY is currently testing its 50-day moving average to the downside. A break below this level could trigger further decline, with key support seen in the 142.50–142.75 zone.
In energy, US crude rose more than 5% last week on optimism over US-China trade progress, a weekly decline in US inventories, and strong US jobs data. Crude is consolidating just below the $65/barrel mark this morning. Any positive surprise on the trade front could lift prices above the $65.35 level – the key 38.2% retracement of this year’s decline, and a potential signal of a shift from a bearish to a medium-term bullish trend.
AUD/USD Daily Report
Daily Pivots: (S1) 0.6476; (P) 0.6497; (R1) 0.6513; More...
AUD/USD recovers mildly today but stays below 0.6536 resistance. Intraday bias remains neutral for the moment. Further rise is in favor as long as 0.6406 support holds. On the upside, decisive break of 0.6536 will resume the rally from 0.5913 to 61.8% retracement of 0.6941 to 0.5913 at 0.6548. However, firm break of 0.6406 will turn bias to the downside for 38.2% retracement of 0.5913 to 0.6536 at 0.6298.
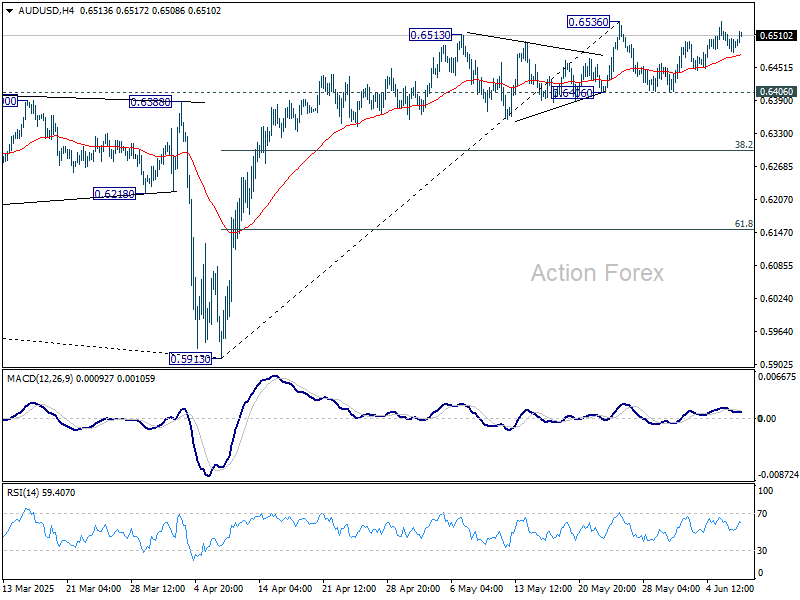
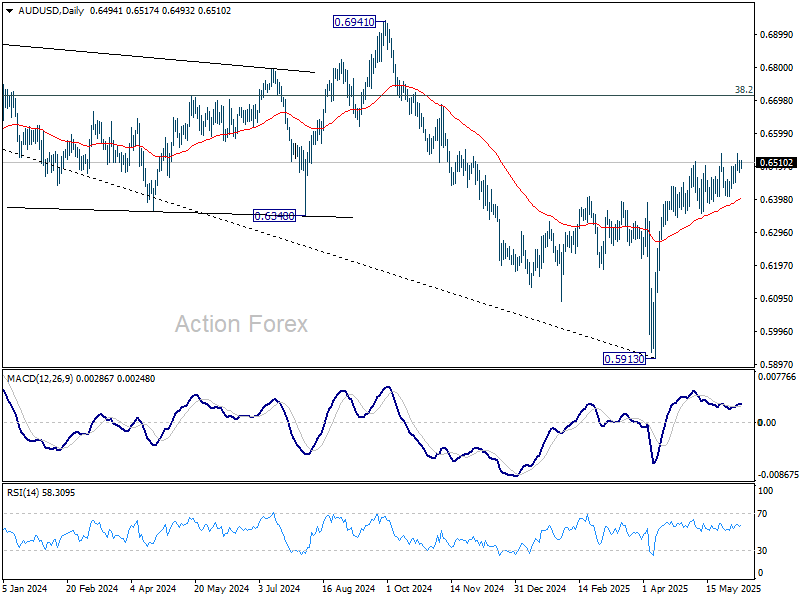
In the bigger picture, AUD/USD is still struggling to sustain above 55 W EMA (now at 0.6443) cleanly, and outlook is mixed. Sustained trading above 55 W EMA will indicate that rise from 0.5913 is at least correcting the down trend from 0.8006 (2021 high), with risk of trend reversal. Further rise should be seen to 38.2% retracement of 0.8006 to 0.5913 at 0.6713. However, rejection by 55 W EMA will revive medium term bearishness for another fall through 0.5913 at a later stage.
Markets Eye US-China Trade Talks for Fresh Catalyst
Asian equity markets opened the week on a positive note, supported by cautious optimism surrounding the high-stakes US-China trade negotiations in London. US Treasury Secretary Scott Bessent, along with Commerce Secretary Howard Lutnick and Trade Representative Jamieson Greer, are meeting Chinese counterparts as efforts to revive dialogue intensify. The outcome of these talks could set the tone for broader risk sentiment in the coming sessions.
Despite the upbeat market tone, traders appear restrained in their positioning. While recent developments — such as China’s approval of rare earth export licenses — hint at a willingness to de-escalate, there’s little in the way of concrete breakthrough yet. White House economic adviser Kevin Hassett tempered enthusiasm by pointing out that China's release of critical minerals remains below what the US believes was agreed to previously in Geneva. As such, expectations for a definitive deal remain muted, limiting any aggressive risk-on trades for now.
Currency markets reflect this tempered tone. Aussie and Kiwi are modestly firmer, benefiting from the underlying improvement in sentiment, Dollar and Loonie are trading on the softer side. European majors and Yen are relatively steady in the middle. With most major pairs holding inside Friday’s ranges, the currency space is clearly in wait-and-see mode.
Beyond trade, inflation will be the other key macro theme this week. The US will release its May CPI and PPI data, alongside the University of Michigan’s consumer sentiment and inflation expectations. Markets are keen to assess whether signs of tariff-driven are beginning to firm. A surprise to the upside could challenge the current market view that the Fed’s next move will be no earlier than Q4, particularly if inflation expectations also pick up.
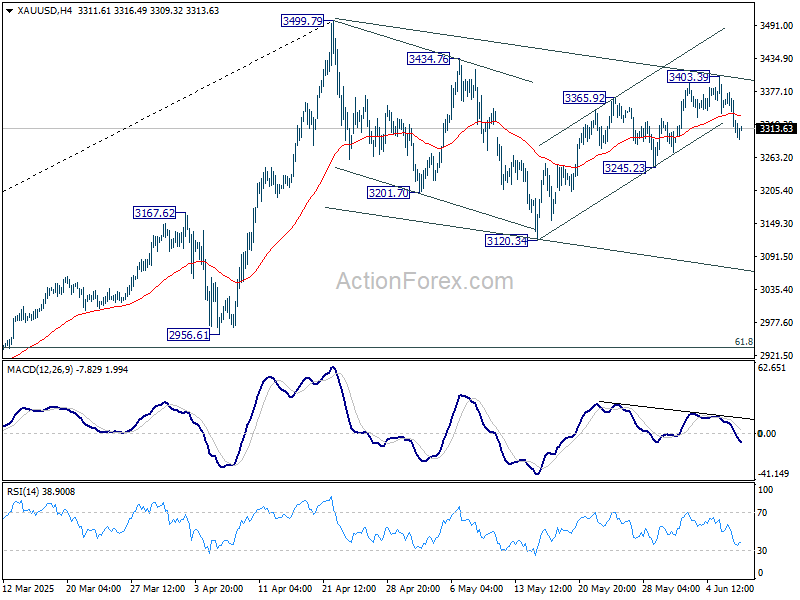
Technically, Gold's extended decline argues that rebound from 3120.34 might have completed at 3403.39 already, with break of near term channel support and bearish divergence condition in 4H MACD. Further fall is now in favor to 3245.23 support first. Firm break there will the solidify the case that corrective pattern from 3499.79 is already in its third leg, and target 3120.34 support and possibly below.
In Asia, at the time of writing, Nikkei is up 0.89%. Hong Kong HSI is up 0.88%. China Shanghai SSE is up 0.26%. Singapore Strait Times is up 0.15%. Japan 10-year JGB yield is up 0.011 at 1.470.
China's CPI falls -0.1% yoy in May, negative for fourth month
China’s headline CPI stayed in negative territory for the fourth consecutive month in May, coming in at -0.1% yoy, slightly better than the expected -0.2% yoy.
The persistent softness in overall inflation was largely driven by a sharp -6.1% yoy decline in energy prices, which alone shaved off nearly half a percentage point from the annual CPI reading.
On a monthly basis, CPI fell -0.2% mom, with energy again dragging down the figure through a -1.7% mom decline.
In contrast, core inflation, which strips out food and energy prices, rose to 0.6% yoy, the highest level since January.
Producer price pressures continue to weaken further, with PPI dropping to -3.3% yoy from -2.7% yoy previously, marking the deepest contraction in nearly two years. Wholesale prices have now been stuck in deflation since October 2022.
China’s trade surplus widens to USD 103.2B in May, US exports slump -34.5% yoy
China’s trade surplus widened to USD 103.2B in May, exceeding expectations of USD 101.3, even as headline export and import figures undershot forecasts. Exports rose 4.8% yoy, just shy of the 5.0% yoy consensus. Imports fell -3.4% yoy, a sharper drop than the anticipated -0.9% yoy.
Exports to the US plunged -34.5% yoy, highlighting the entrenched trade tensions despite Washington’s partial tariff rollback in April. However, the impact was cushioned by robust growth in exports to ASEAN (15% yoy), the European Union (12% yoy), and Africa (33% yoy).
ECB’s Nagel signals Pause, cites maximum flexibility at current rates
German ECB Governing Council member Joachim Nagel indicated over the weekend that the central bank is likely entering a pause phase after last week's eighth rate cut in the current easing cycle, which brought the deposit rate to 2.00%.
Speaking on Deutschlandfunk radio, Nagel also noted that the current level of interest rates offers “maximum flexibility.” And, “We can now take the time to look at the situation first.”
BoE’s Greene warns on inflation sensitivity, risk of wage-price spiral
BoE Monetary Policy Committee member Megan Greene acknowledged at a Saturday conference that while UK inflation is moving "in the right direction," the pace of decline is slower than she would prefer.
Speaking candidly about April’s upside inflation surprise, Greene stated that while the MPC believes it can "look through" the jump, there remains a "pretty big risk" that price pressures could become more entrenched, especially if second-round effects materialize.
Greene also highlighted the behavioral shift triggered by the recent cost-of-living crisis, warning that past inflation shocks may have left households and businesses more reactive to even small price increases. That, in turn, could "feed through the wage-price behavior." S
He noted that private-sector wage growth remains "way above" the level consistent with the BoE’s 2% inflation target.
Tariff effects under scrutiny as US CPI, PPI and inflation expectations take center stage
A relatively quiet week for global economic releases will nevertheless carry key signals for monetary policy in both the US and UK.
US May CPI report will be front and center, offering insight into whether there is an emerging inflation pickup from tariffs. Headline CPI is expected to accelerate from 2.3% yoy to 2.5% yoy. Core CPI is seen rising to 2.9% after troughing at 2.8% for two months. A rise in both measures would raise concerns that 2025's slow disinflation trend is reversing just as tariffs begin to seep into consumer prices.
Additional confirmation may come from upstream price pressures in PPI data, alongside consumer inflation expectations in the University of Michigan’s sentiment survey. If all three elements—CPI, PPI, and expectations—firm, the Fed’s cautious stance would harden further. While markets currently lean toward a September cut, such an inflation environment could shift expectations toward Q4.
In the UK, attention will turn to April GDP and labor market data. GDP is expected to show a mild contraction of -0.1% mom. But that may be less concerning given signs that post-trade deal clarity with the US could support stronger growth later in Q2. The more pivotal element will be wage growth, which has remained stubbornly high and continues to feed into sticky services inflation—a key concern for BoE.
Diverging views within the Monetary Policy Committee remain apparent. While some members are inclined to ease, Chief Economist Huw Pill has warned last month that the UK's weak productivity growth and embedded wage pressures could mirror past inflationary episodes. His remarks highlight that underlying structural risks—especially in the labor market—may prevent BoE from loosening policy too quickly, even if growth remains uneven.
Here are some highlights of the week:
- Monday: New Zealand manufacturing sales; Japan GDP final; China CPI, PPI, trade balance.
- Tuesday: Australia Westpac consumer sentiment, NAB business confidence; UK employment; Swiss SECO consumer climate; Eurozone Sentix investor confidence.
- Wednesday: Japan PPI; Canada building permit; US CPI.
- Thursday: Japan BSI manufacturing; UK GDP, industrial and manufacturing production, goods trade balance; US PPI, jobless claims.
- Friday: New Zealand BNZ manufacturing; Japan tertiary industry index; Germany CPI final; Eurozone industrial production, trade balance; Canada wholesale sales, manufacturing sales; US U of Michigan consumer sentiment.
AUD/USD Daily Report
Daily Pivots: (S1) 0.6476; (P) 0.6497; (R1) 0.6513; More...
AUD/USD recovers mildly today but stays below 0.6536 resistance. Intraday bias remains neutral for the moment. Further rise is in favor as long as 0.6406 support holds. On the upside, decisive break of 0.6536 will resume the rally from 0.5913 to 61.8% retracement of 0.6941 to 0.5913 at 0.6548. However, firm break of 0.6406 will turn bias to the downside for 38.2% retracement of 0.5913 to 0.6536 at 0.6298.
In the bigger picture, AUD/USD is still struggling to sustain above 55 W EMA (now at 0.6443) cleanly, and outlook is mixed. Sustained trading above 55 W EMA will indicate that rise from 0.5913 is at least correcting the down trend from 0.8006 (2021 high), with risk of trend reversal. Further rise should be seen to 38.2% retracement of 0.8006 to 0.5913 at 0.6713. However, rejection by 55 W EMA will revive medium term bearishness for another fall through 0.5913 at a later stage.
China’s trade surplus widens to USD 103.2B in May, US exports slump -34.5% yoy
China’s trade surplus widened to USD 103.2B in May, exceeding expectations of USD 101.3, even as headline export and import figures undershot forecasts. Exports rose 4.8% yoy, just shy of the 5.0% yoy consensus. Imports fell -3.4% yoy, a sharper drop than the anticipated -0.9% yoy.
Exports to the US plunged -34.5% yoy, highlighting the entrenched trade tensions despite Washington’s partial tariff rollback in April. However, the impact was cushioned by robust growth in exports to ASEAN (15% yoy), the European Union (12% yoy), and Africa (33% yoy).
EUR/USD Eyes Support, Can Bulls Restart Increase?
Key Highlights
- EUR/USD corrected some gains from the 1.1500 resistance zone.
- A connecting bullish trend line is forming with support at 1.1330 on the 4-hour chart.
- GBP/USD tested the 1.3600 resistance and corrected some gains.
- USD/JPY recovered losses and climbed above the 144.20 resistance.
EUR/USD Technical Analysis
The Euro remained well-bid above 1.1350 against the US Dollar. EUR/USD climbed above 1.1420, tested 1.1500, and recently started a short-term downside correction.
Looking at the 4-hour chart, the pair settled above the 1.1320 level, the 100 simple moving average (red, 4-hour), and the 200 simple moving average (green, 4-hour). On the downside, immediate support is near the 1.1350 level. It is near the 50% Fib retracement level of the upward move from the 1.1210 swing low to the 1.1494 high.
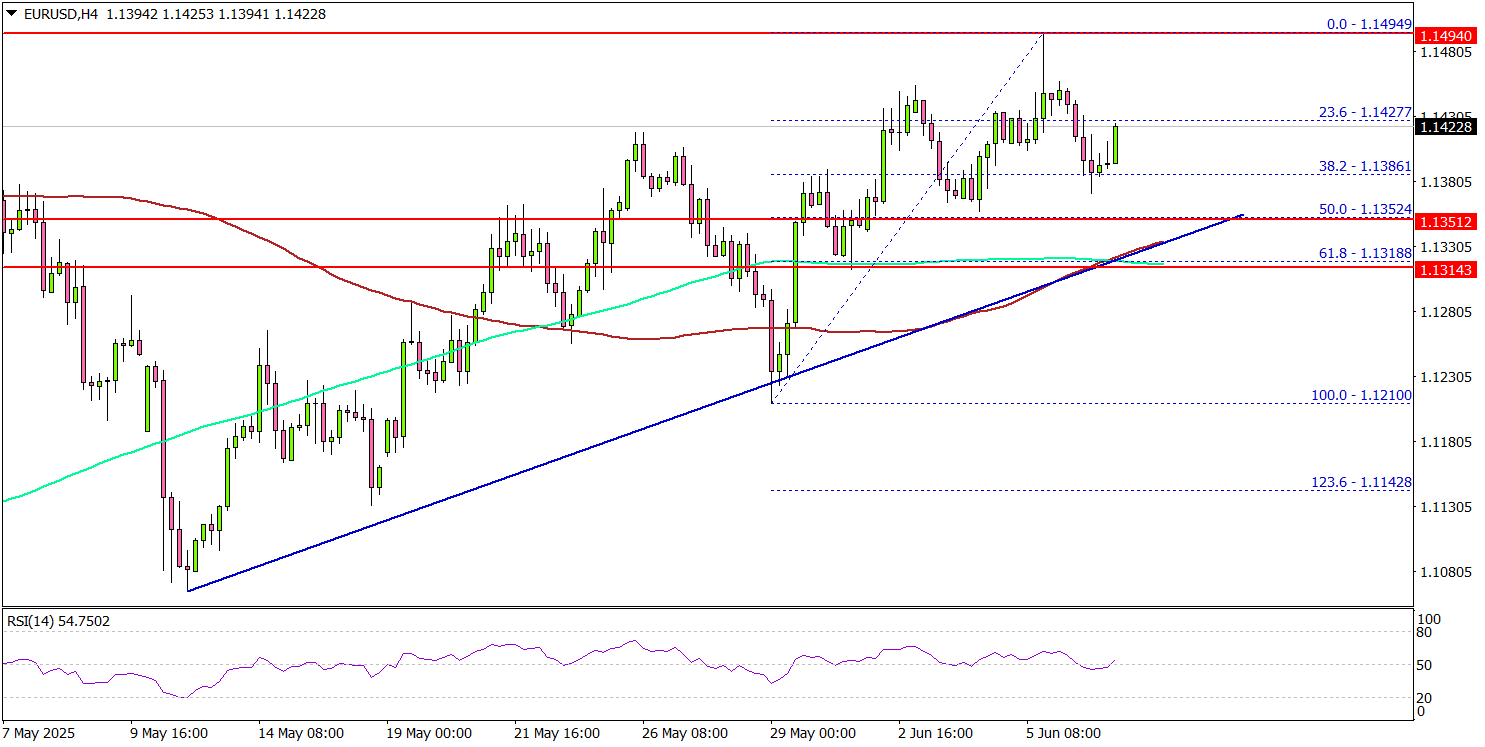
The next key support sits near 1.1330. There is also a connecting bullish trend line forming with support at 1.1330 on the same chart. Any more losses could send the pair toward the 1.1250 pivot level in the near term. The main support could be near 1.1200.
On the upside, the pair could face resistance near the 1.1465 level. The next key resistance sits near the 1.1480 level. The first major resistance sits at 1.1500. A close above the 1.1500 level could set the pace for another increase.
In the stated case, the pair could even clear the 1.1620 resistance. The next major stop for the bulls could be near the 1.1680 resistance.
Looking at GBP/USD, the pair started another increase, but the bulls seem to be facing hurdles near the 1.3600 level.
Upcoming Economic Events:
- ECB's Elderson speech.
- ECB's Escrivá speech.
China’s CPI falls -0.1% yoy in May, negative for fourth month
China’s headline CPI stayed in negative territory for the fourth consecutive month in May, coming in at -0.1% yoy, slightly better than the expected -0.2% yoy.
The persistent softness in overall inflation was largely driven by a sharp -6.1% yoy decline in energy prices, which alone shaved off nearly half a percentage point from the annual CPI reading.
On a monthly basis, CPI fell -0.2% mom, with energy again dragging down the figure through a -1.7% mom decline.
In contrast, core inflation, which strips out food and energy prices, rose to 0.6% yoy, the highest level since January.
Producer price pressures continue to weaken further, with PPI dropping to -3.3% yoy from -2.7% yoy previously, marking the deepest contraction in nearly two years. Wholesale prices have now been stuck in deflation since October 2022.
ECB’s Nagel signals Pause, cites maximum flexibility at current rates
German ECB Governing Council member Joachim Nagel indicated over the weekend that the central bank is likely entering a pause phase after last week's eighth rate cut in the current easing cycle, which brought the deposit rate to 2.00%.
Speaking on Deutschlandfunk radio, Nagel also noted that the current level of interest rates offers “maximum flexibility.” And, “We can now take the time to look at the situation first.”