
Sample Category Title
USD/CHF Weekly Outlook
USD/CHF edged lower to 0.8156 last week but quickly recovered. Initial bias remains neutral this week first. Price actions from 0.8038 are seen as a corrective pattern to decline form 0.9200. While fall from 0.8475 might extend lower, downside should be contained by 0.8038 to bring rebound. Break of 0.8436 resistance will suggest that it's already in the third leg of the correction, and target 0.8475.
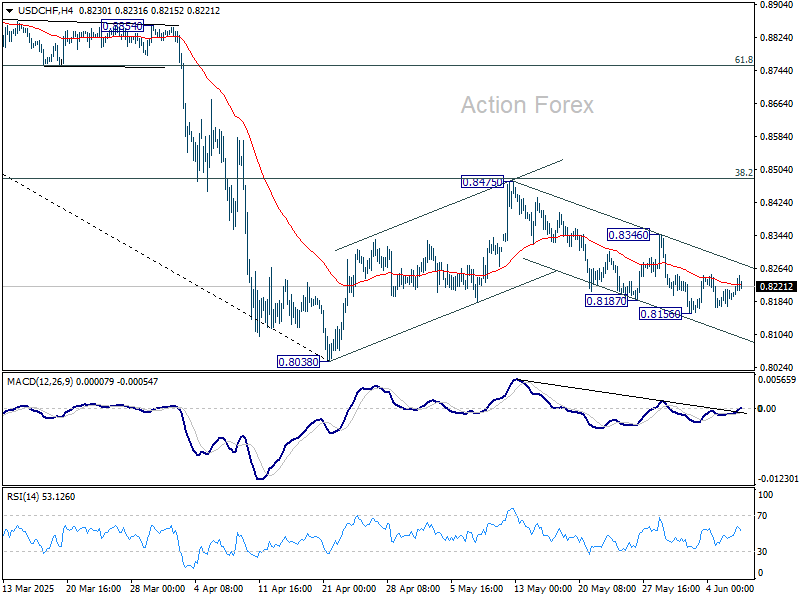
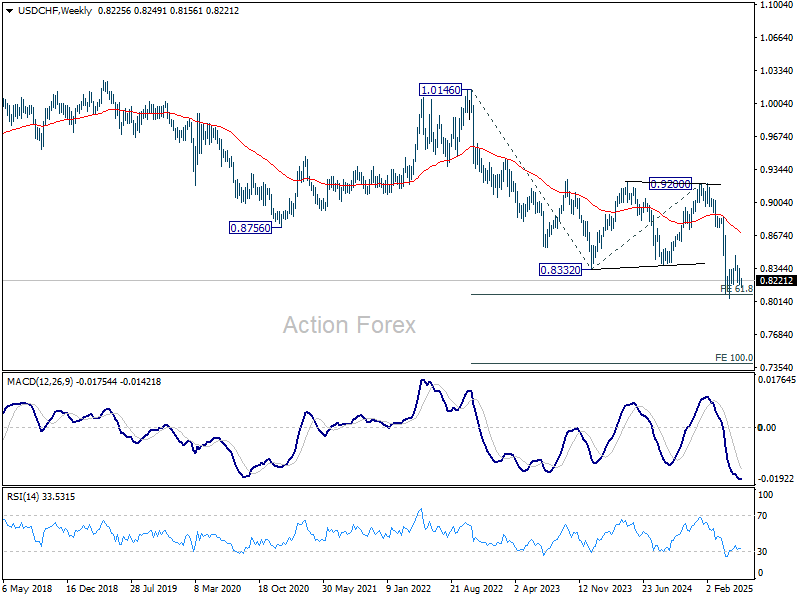
In the bigger picture, long term down trend from 1.0342 (2017 high) is still in progress and met 61.8% projection of 1.0146 (2022 high) to 0.8332 from 0.9200 at 0.8079 already. In any case, outlook will stay bearish as long as 55 W EMA (now at 0.8714) holds. Sustained break of 0.8079 will target 100% projection at 0.7382.
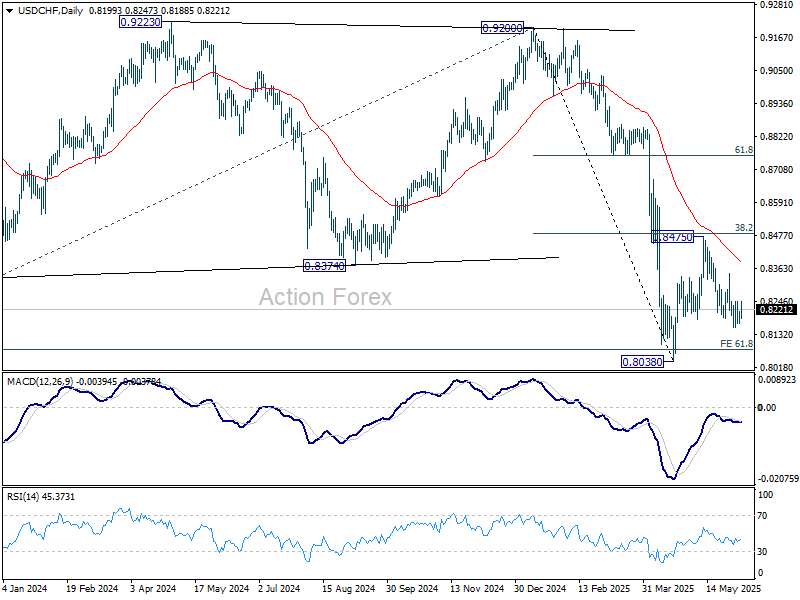
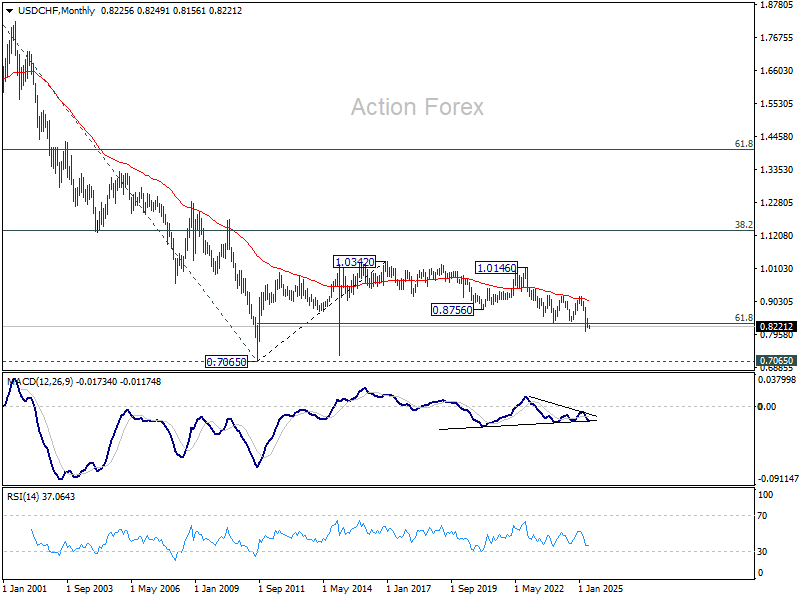
In the long term picture, price action from 0.7065 (2011 low ) are seen as a corrective pattern to the multi-decade down trend from 1.8305 (2000 high). It's uncertain if the fall from 1.0342 is the second leg of the pattern, or resumption of the down trend. But in either case, sustained trading below 61.8% retracement of 0.7065 to 1.0342 at 0.8317 will pave the way back to 0.7065.
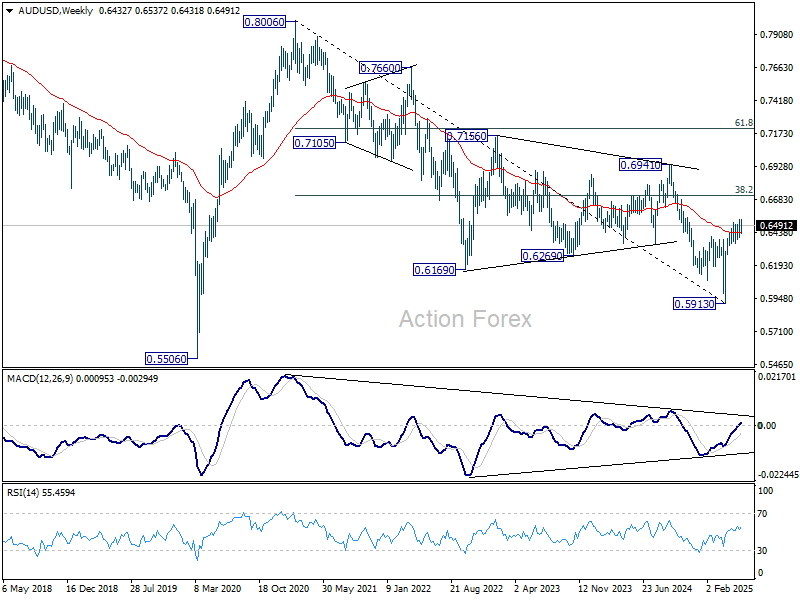
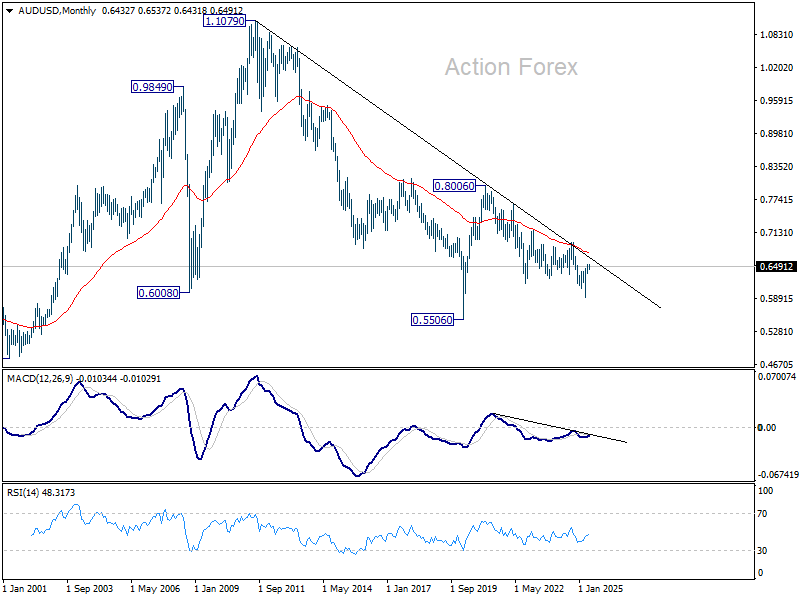
AUD/USD Weekly Report
AUD/USD stays in sideway consolidations from 0.6536 last week and outlook is unchanged. Initial bias remains neutral this week first. Further rise is in favor as long as 0.6406 support holds. On the upside, decisive break of 0.6536 will resume the rally from 0.5913 to 61.8% retracement of 0.6941 to 0.5913 at 0.6548. However, firm break of 0.6406 will turn bias to the downside for 38.2% retracement of 0.5913 to 0.6536 at 0.6298.
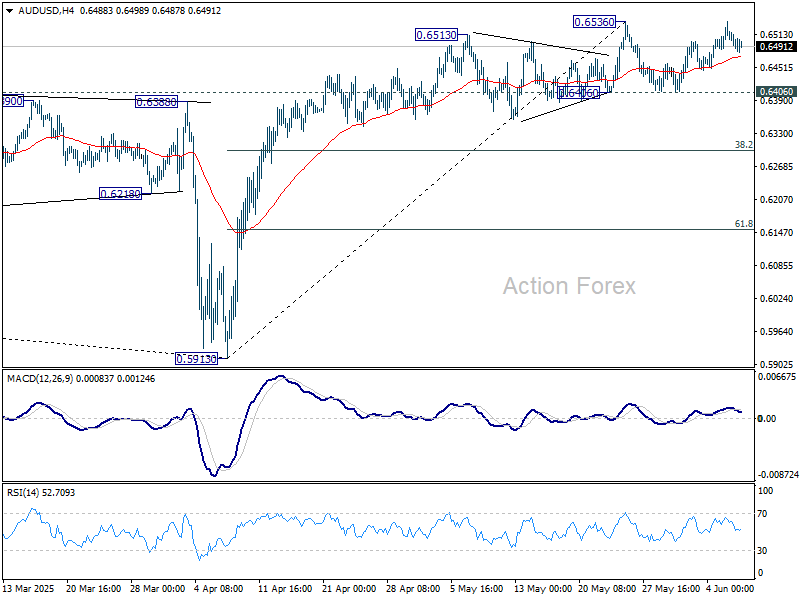
In the bigger picture, AUD/USD is still struggling to sustain above 55 W EMA (now at 0.6443) cleanly, and outlook is mixed. Sustained trading above 55 W EMA will indicate that rise from 0.5913 is at least correcting the down trend from 0.8006 (2021 high), with risk of trend reversal. Further rise should be seen to 38.2% retracement of 0.8006 to 0.5913 at 0.6713. However, rejection by 55 W EMA will revive medium term bearishness for another fall through 0.5913 at a later stage.
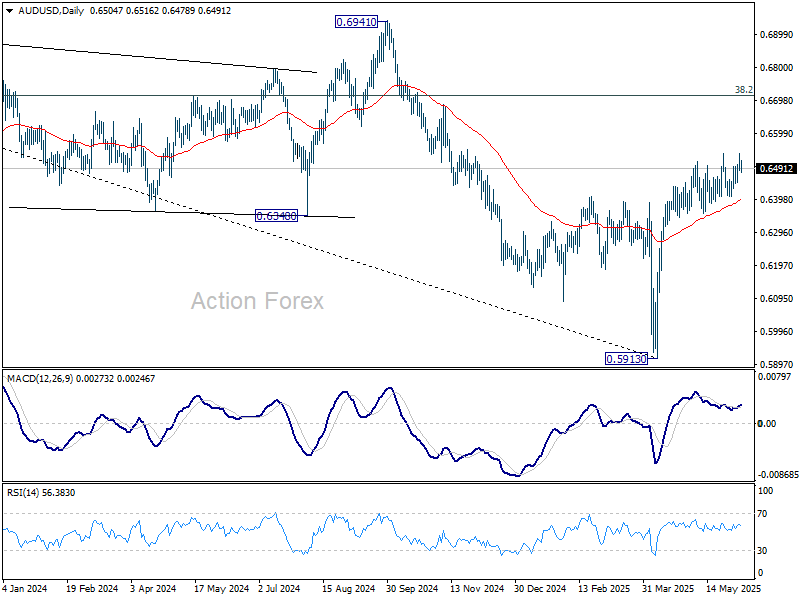
In the long term picture, fall from 0.8006 is seen as the second leg of the corrective pattern from 0.5506 long term bottom (2020 low). Hence, in case of deeper decline, strong support should emerge above 0.5506 to contain downside to bring reversal. On the upside, firm break of 0.6941 will argue that the third leg has already started back to 0.8006.
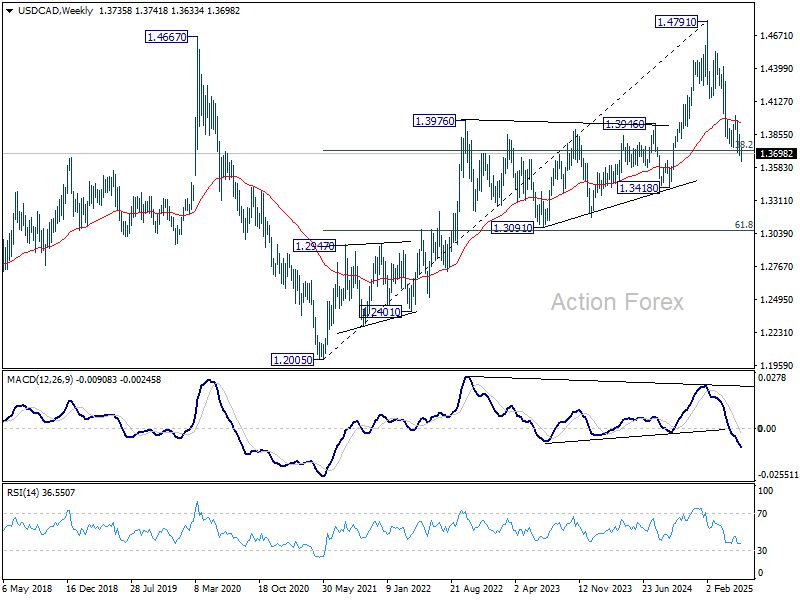
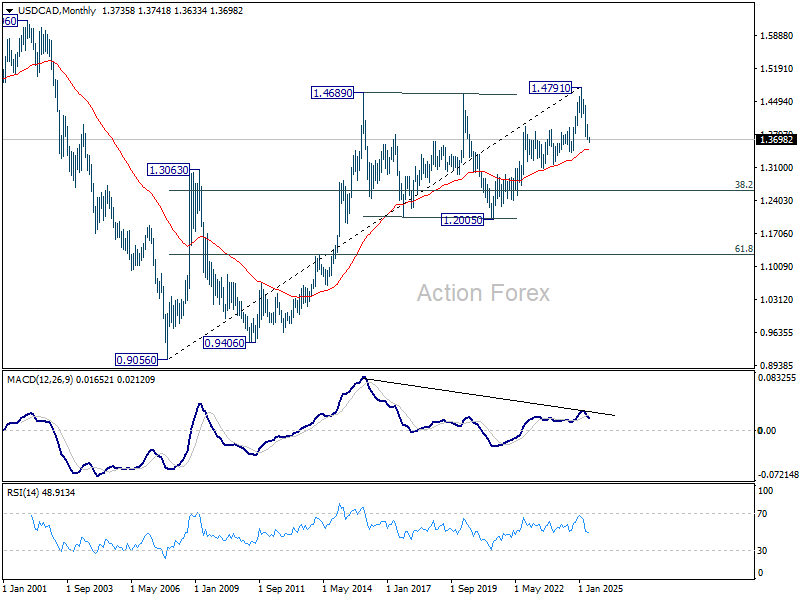
USD/CAD Weekly Outlook
USD/CAD's decline from 1.4791 resumed last week but lost momentum again ahead of 61.8% projection of 1.4414 to 1.3749 from 1.4014 at 1.3603. Initial bias is turned neutral this week first. Considering bullish convergence condition in 4H MACD, firm break of 1.3741 will indicate short term bottoming. Stronger rebound then be seen to 1.4014 resistance, as a correction to fall from 1.4791. Nevertheless, decisive break of 1.3603 will pave the way to 100% projection at 1.3349.
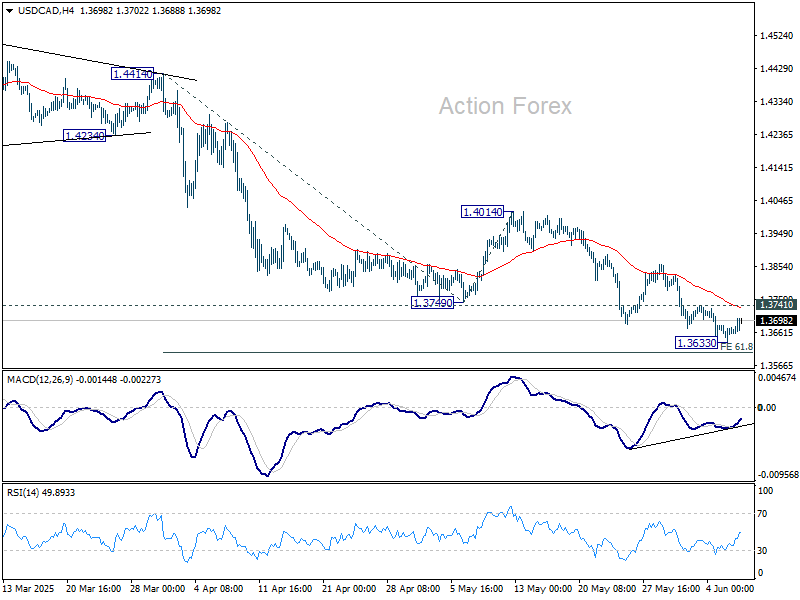
In the bigger picture, price actions from 1.4791 medium term top could either be a correction to rise from 1.2005 (2021 low), or trend reversal. In either case, further decline is expected as long as 1.4014 resistance holds. Firm break of 38.2% retracement of 1.2005 (2021 low) to 1.4791 at 1.3727 will pave the way back to 61.8% retracement at 1.3069.
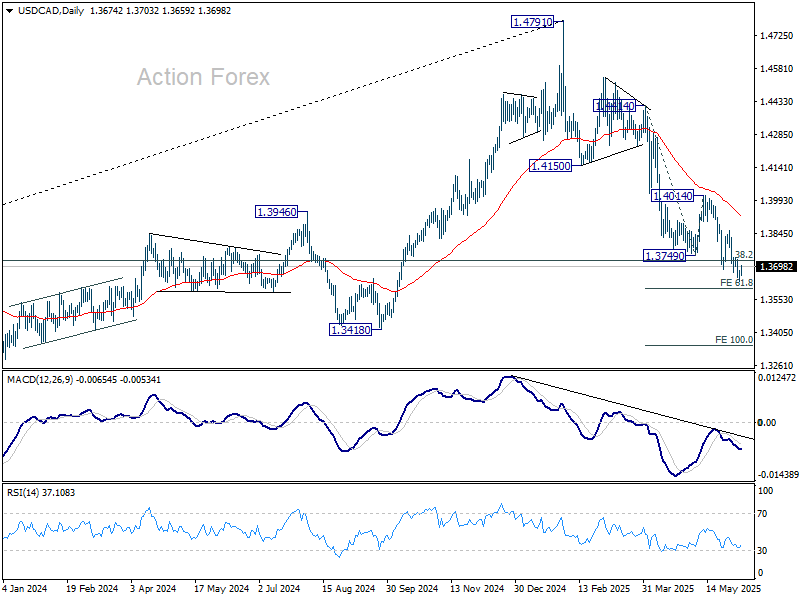
In the long term picture, as long as 55 M EMA (now at 1.3485) holds, up trend from 0.9056 (2007 low) should still resume through 1.4791 at a later stage. However, sustained trading below 55 M EMA will argue that the up trend has already completed, with rise from 1.2005 to 1.4791 as the fifth wave. 1.4791 would then be seen as a long term top and deeper medium term down trend should then follow.
GBP/JPY Weekly Outlook
GBP/JPY stayed in sideway trading below 196.38 last week. Initial bias stays neutral this week first. Further rise is in favor as long as 191.86 support holds. Firm break of 196.38 will resume whole rally from 184.35 to 199.79 resistance, and possibly further to 100% projection of 180.00 to 199.79 from 184.35 at 204.14.
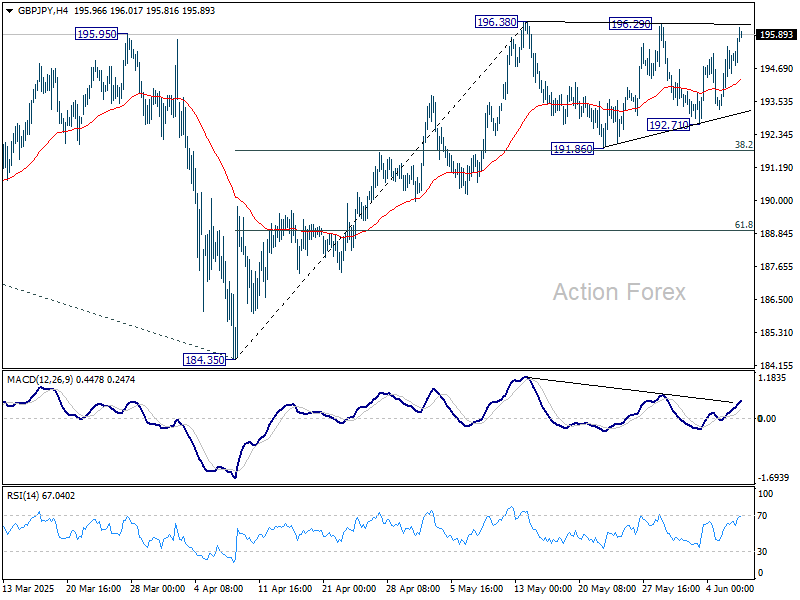
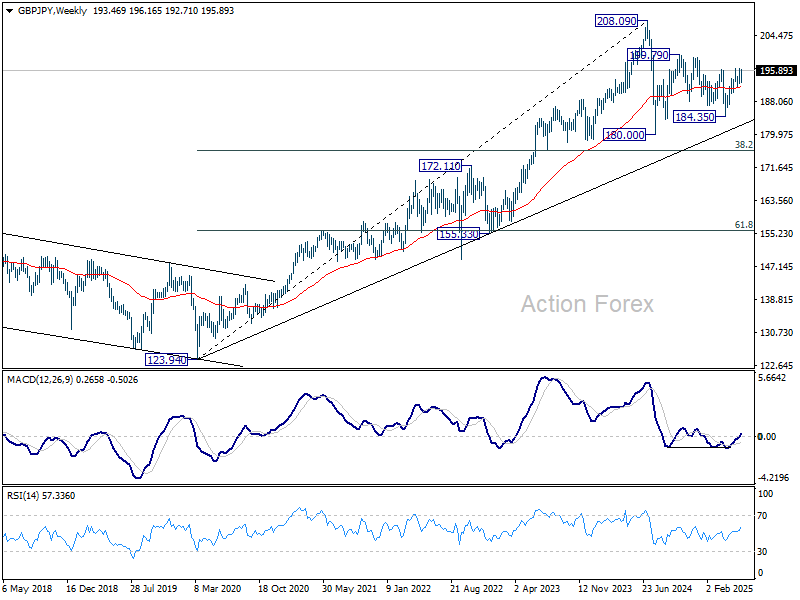
In the bigger picture, price actions from 208.09 are seen as a correction to rally from 123.94 (2020 low). Strong support should be seen from 38.2% retracement of 123.94 to 208.09 at 175.94 to contain downside. However, sustained break of 175.94 will bring deeper fall even still as a correction.
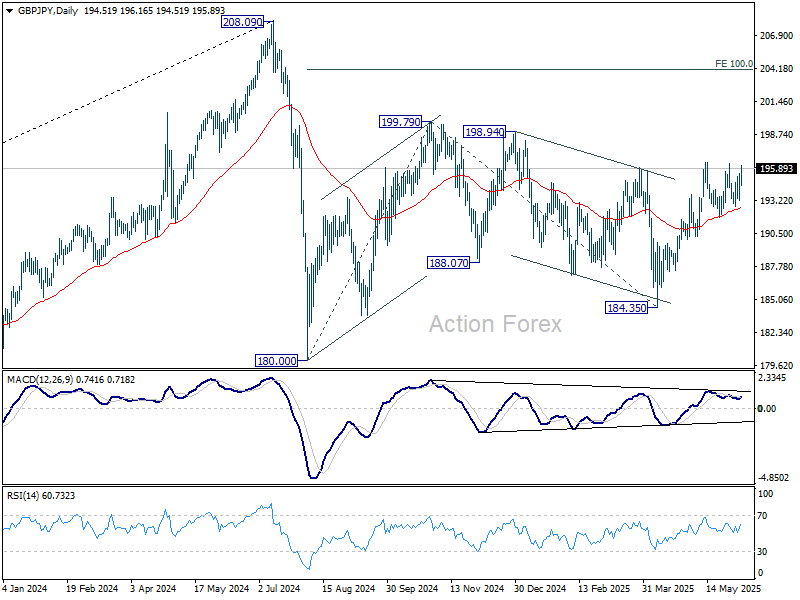
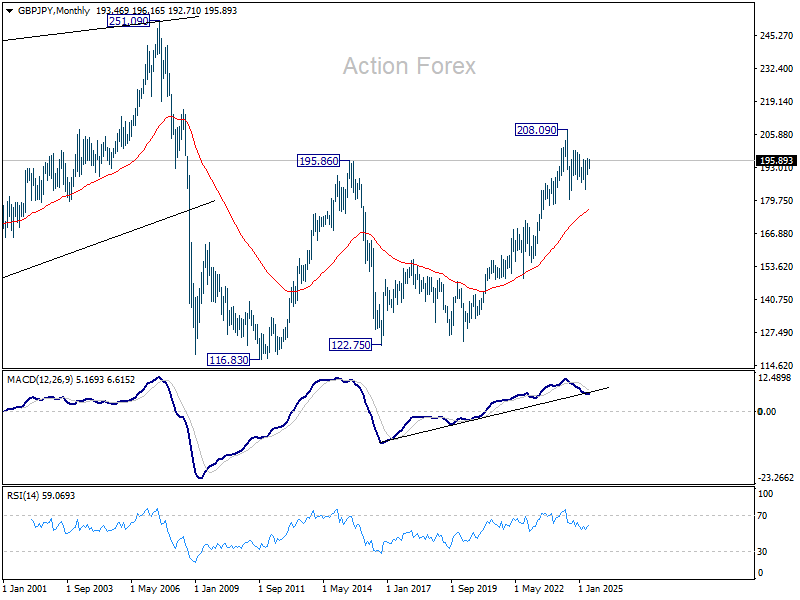
In the longer term picture, while a medium term top was formed at 208.09 (2024 high), it's still early to conclude that the up trend from 122.75 (2016 low) has completed. But GBP/JPY is at least in a medium term corrective phase, with risk of correction to 55 M EMA (now at 176.62).
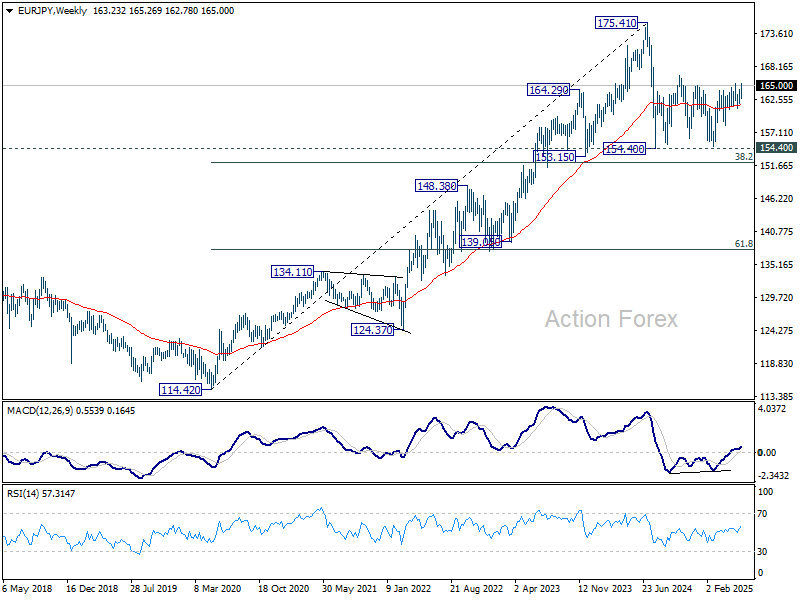
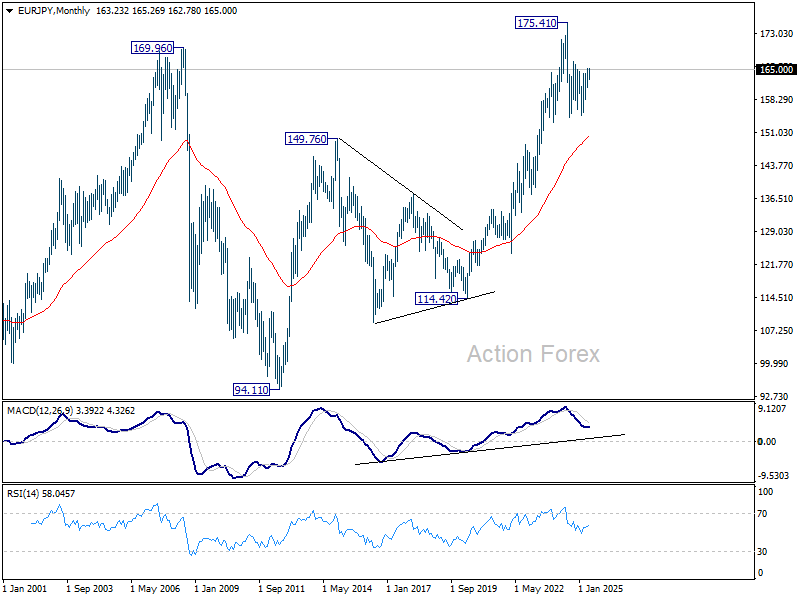
EUR/JPY Weekly Outlook
EUR/JPY's rebound from 161.06 continued last week and breached 165.19 resistance. Initial bias stays on the upside this week. Further rally would be seen to 166.67 resistance, and possibly further to 61.8% retracement of 175.41 to 154.77 at 167.38. For now, near term outlook will stay mildly bullish as long as 162.87 support holds, in case of retreat.
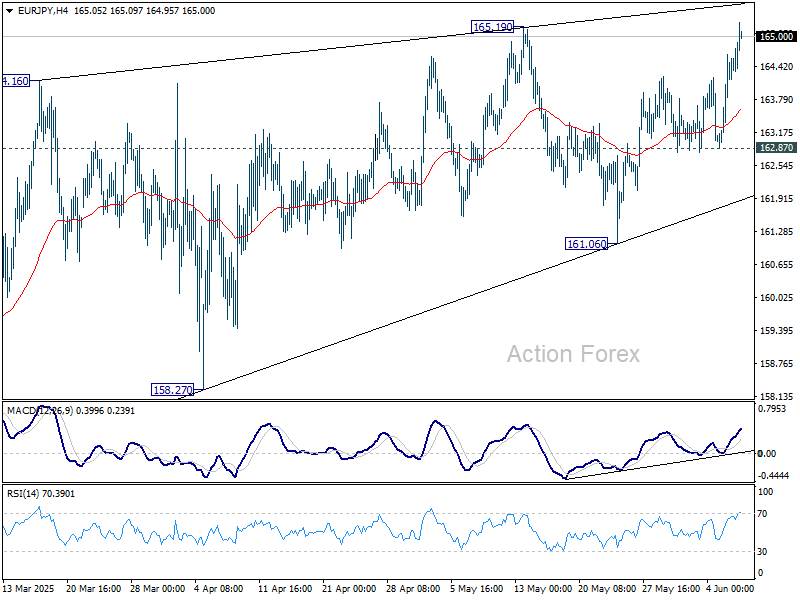
In the bigger picture, price actions from 175.41 are seen as correction to up trend from 114.42 (2020 low). Strong support should be seen from 38.2% retracement of 114.42 to 175.41 at 152.11 to contain downside. However, sustained break of 152.11 will bring deeper fall even still as a correction.
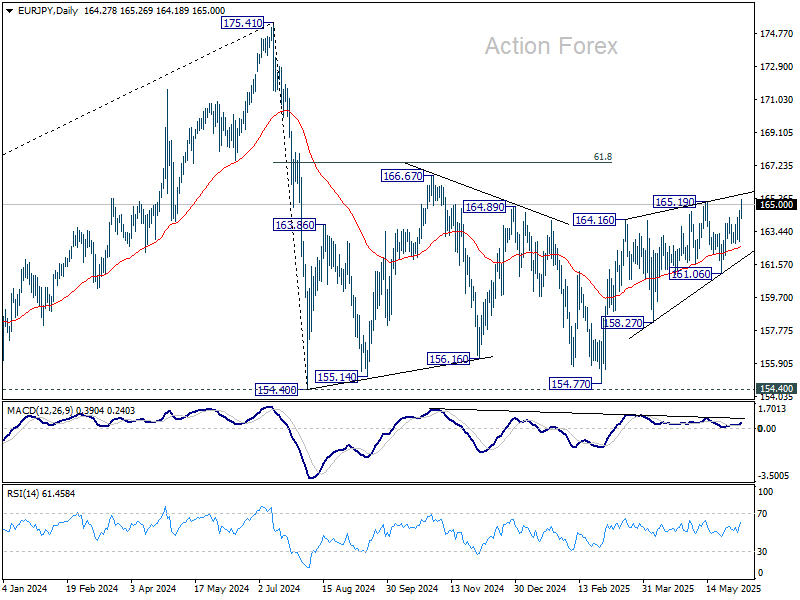
In the long term picture, while 175.41 is at least a medium term top, it's still early to conclude that up trend from 94.11 (2012 low) has completed. A medium term corrective phase is in progress with risk of deeper fall back to 55 M EMA (now at 150.44).
EUR/GBP Weekly Outlook
EUR/GBP stayed in consolidations above 0.8354 short term bottom last week. Initial bias stays neutral this week first. On the upside, above 0.8448 will bring stronger rebound to 38.2% retracement of 0.8737 to 0.8354 at 0.8500. On the downside, below 0.8401 will bring retest of 0.8354 low.
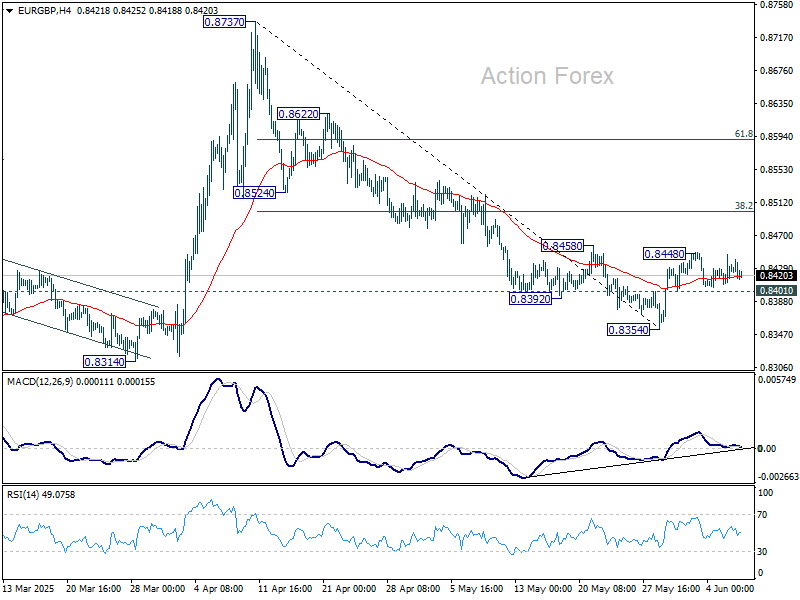
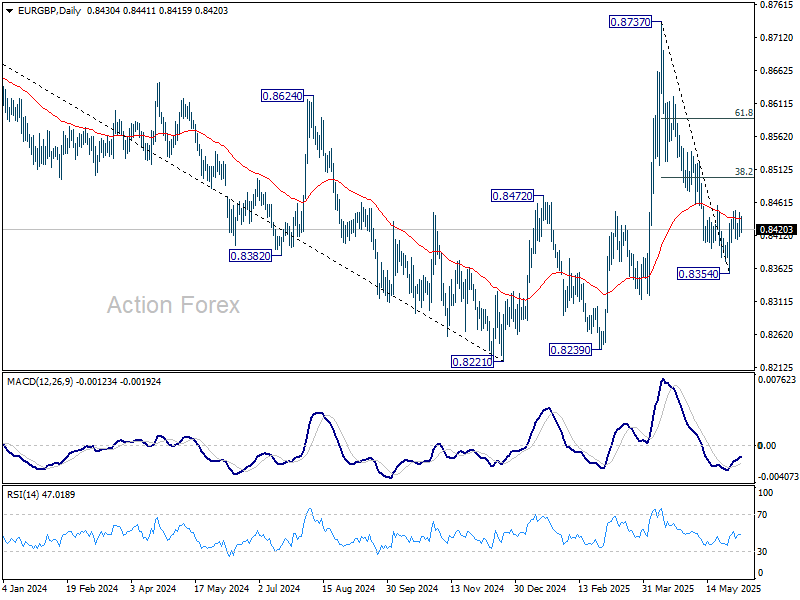
In the bigger picture, price actions from 0.8221 medium term bottom are merely forming a corrective pattern. Nevertheless, there is no clear momentum to break through 0.8201 key support (2022 low) yet. Hence, range trading is expected between 0.8221/8737 for now.
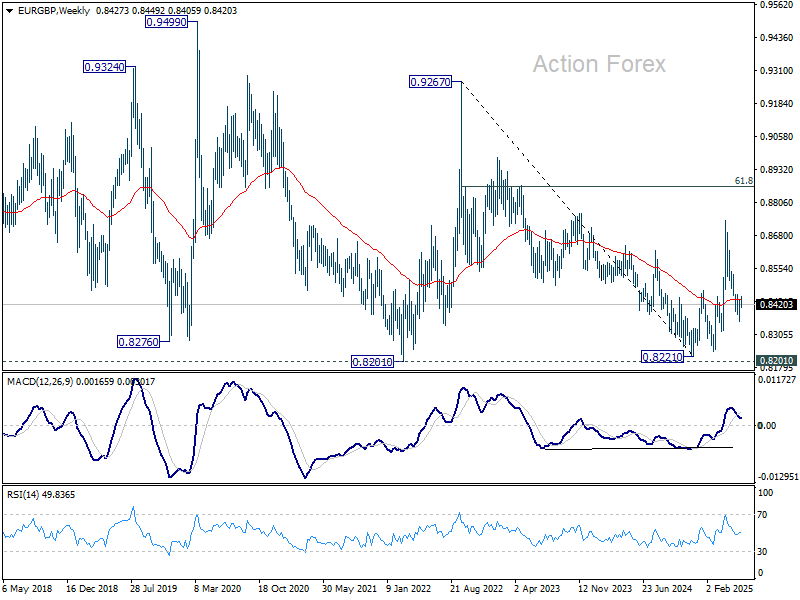
In the long term picture, price action from 0.9499 (2020 high) is seen as part of the long term range pattern from 0.9799 (2008 high). Range trading should continue between 0.8201 and 0.9499, until there is clear signal of imminent breakout.
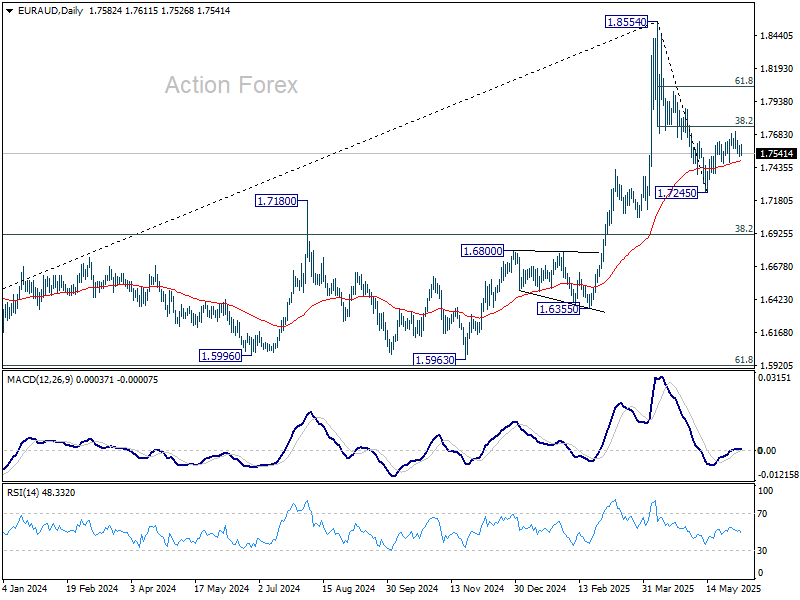
EUR/AUD Weekly Outlook
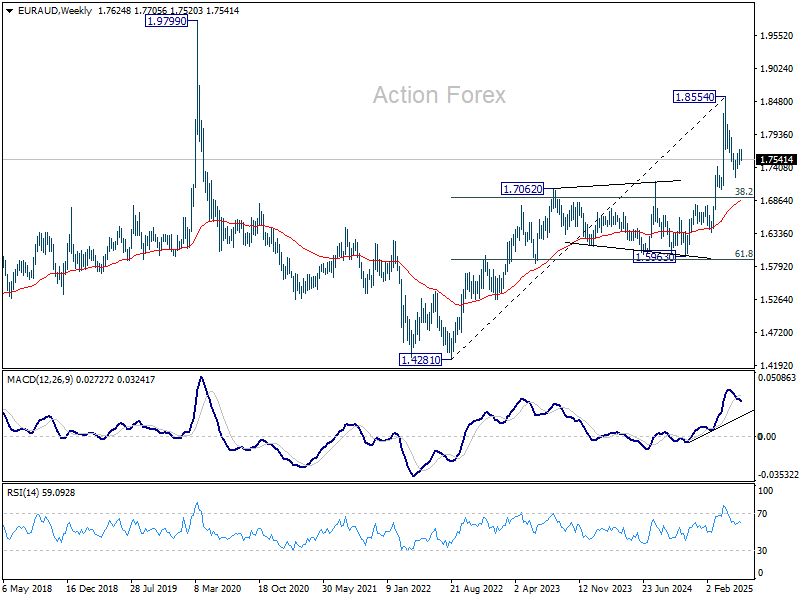
EUR/AUD edged higher to 1.7705 last week but failed to break through 38.2% retracement of 1.8554 to 1.7245 at 1.7745 and retreated. Initial bias remains neutral this week first. On the upside, decisive break of 1.7745 will solidify the case that fall from 1.8554 has completed as a corrective move. Next target is 61.8% retracement at 1.8054. On the downside, however, break of 1.7460 support will bring retest of 1.7245 instead.
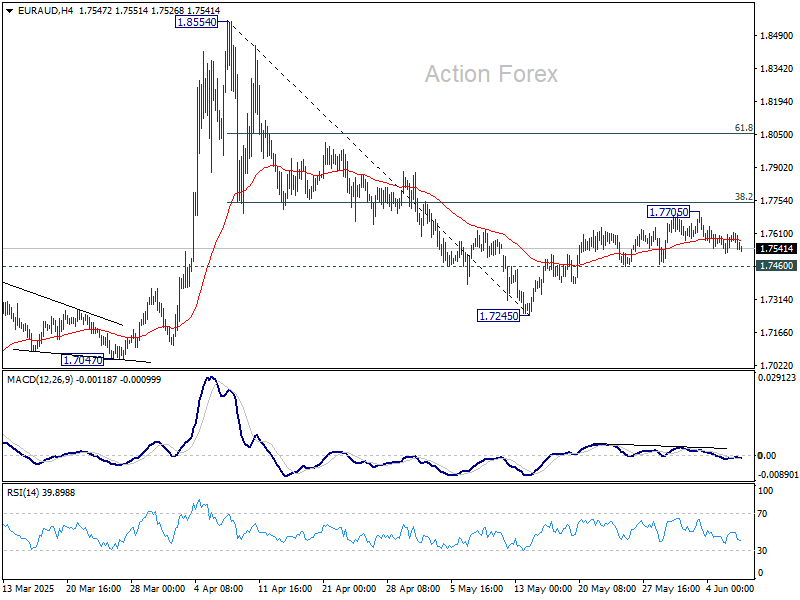
In the bigger picture, with 55 W MACD staying well below signal line, 1.8554 is likely a medium term top already. Price actions from there are seen as a corrective pattern only. While deeper pullback might be seen, downside should be contained by 38.2% retracement of 1.4281 (2022 low) to 1.8554 at 1.6922 to bring rebound. Up trend from 1.4281 is still expected to resume at a later stage.
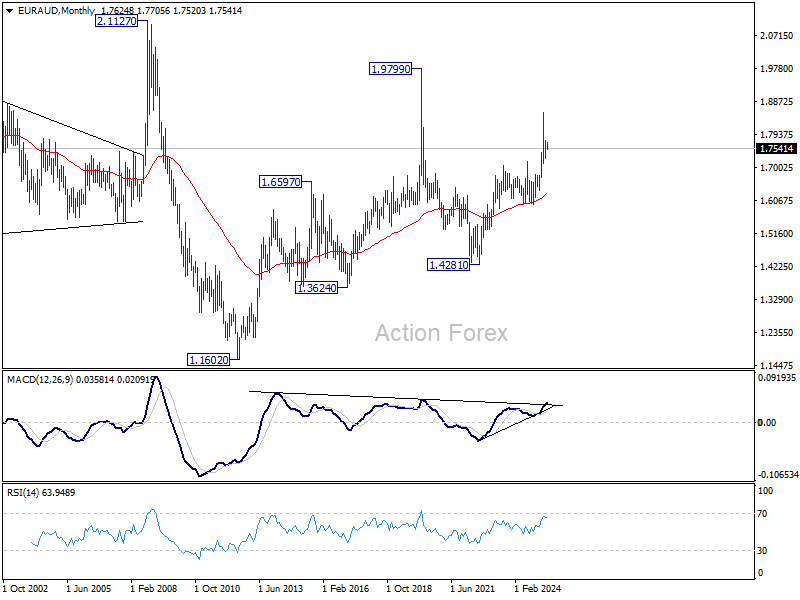
In the longer term picture, rise from 1.4281 is seen as the second leg of the pattern from 1.9799 (2020 high), which is part of the pattern from 2.1127 (2008 high). As long as 55 M EMA (now at 1.6294) holds, this second leg could still extend higher.
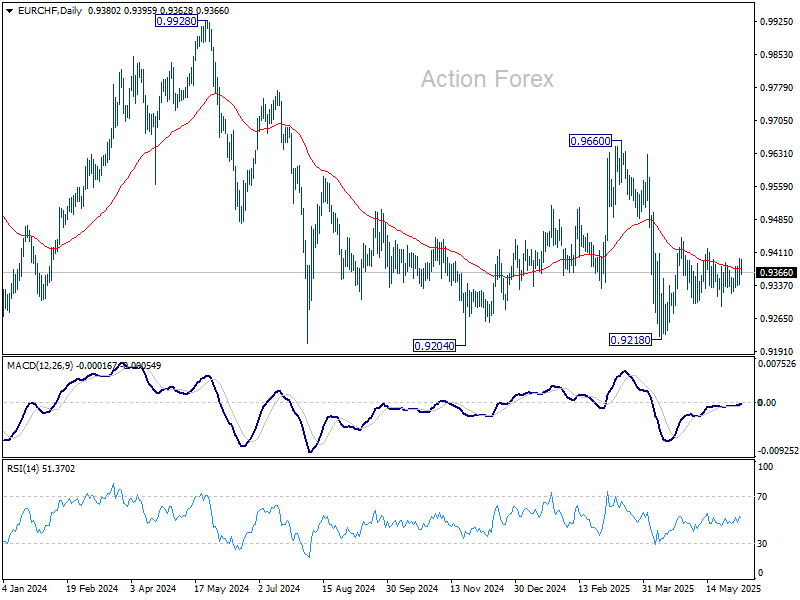
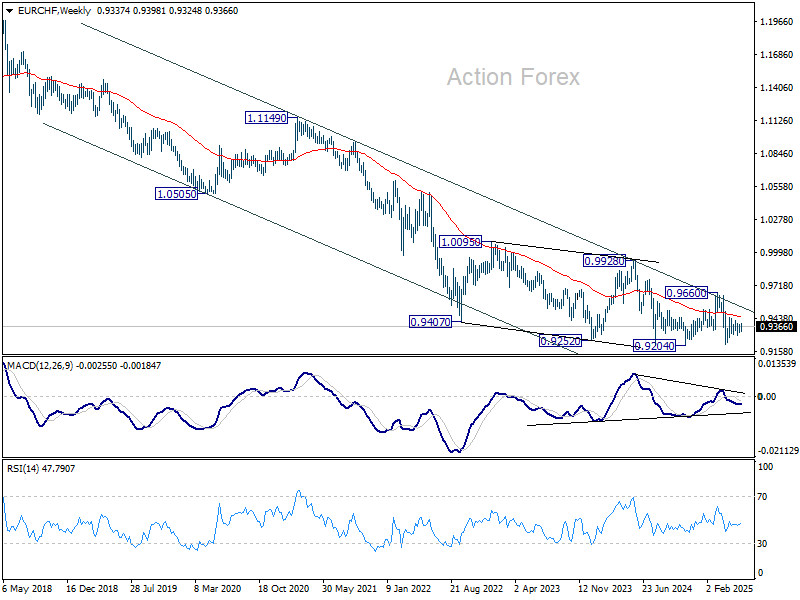
EUR/CHF Weekly Outlook
EUR/CHF rebounded last week mildly last week, but failed well ahead of 0.9419 resistance and retreated. Initial bias remains neutral this week first. Price actions from 0.9445 are seen as a triangle consolidation pattern, and thus rise from 0.9218 is not finished. Break of 0.9419 will argue that the rise, either as a correction to fall from 0.9660, or the third leg of the pattern from 0.9204, is ready to resume through 0.9445. Nevertheless, on the downside, firm break of 0.9291 will bring retest of 0.9218 low.
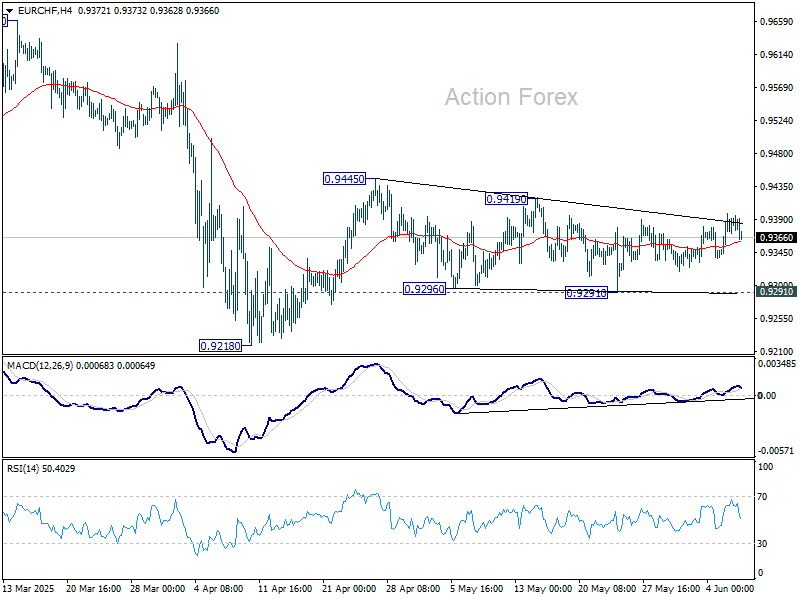
In the bigger picture, prior rejection by long-term falling channel resistance (now at 0.9527) retains medium term bearishness. That is, down trend from 1.2004 (2018 high) is still in progress. Firm break of 0.9204 (2024 low) will confirm resumption. This will remain the favored case as long as 0.9660 resistance holds.
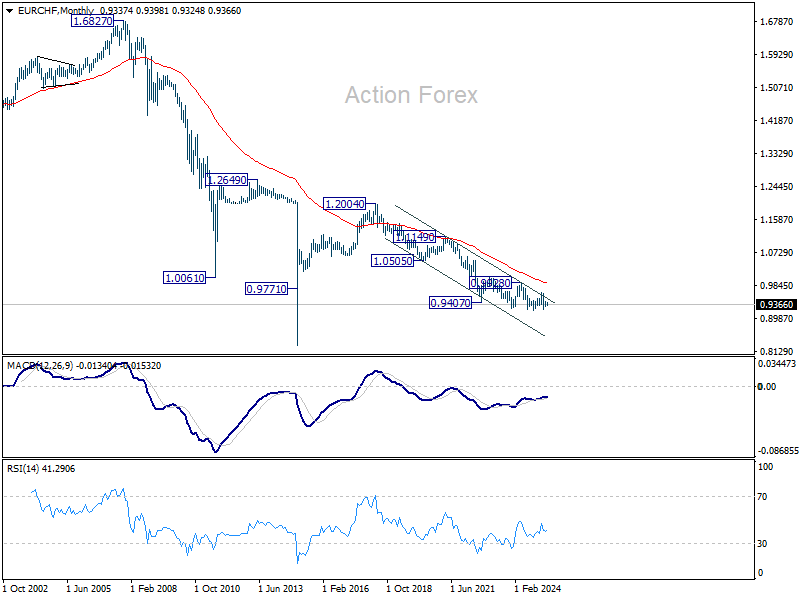
In the long term picture, overall long term down trend is still in force in EUR/CHF. Outlook will continue to stay bearish as long as 55 M EMA (now at 0.9919) holds.
Summary 6/9 – 6/13
Monday, Jun 9, 2025
| GMT | Ccy | Events | Consensus | Previous |
|---|---|---|---|---|
| 22:45 | NZD | Manufacturing Sales Q1 | 1.10% | |
| 23:50 | JPY | Bank Lending Y/Y May | 2.40% | 2.40% |
| 23:50 | JPY | Current Account (JPY) Apr | 2.59T | 2.72T |
| 23:50 | JPY | GDP Q/Q Q1 F | -0.20% | -0.20% |
| 23:50 | JPY | GDP Deflator Y/Y Q1 F | 3.20% | 3.30% |
| 01:30 | CNY | CPI Y/Y May | -0.20% | -0.10% |
| 01:30 | CNY | PPI Y/Y May | -3.00% | -2.70% |
| 03:00 | CNY | Trade Balance (USD) May | 101.1B | 96.2B |
| 05:00 | JPY | Eco Watchers Survey: Current May | 43.9 | 42.6 |
| 14:00 | USD | Wholesale Inventories M/M Apr F | 0% | 0% |
| 23:01 | GBP | BRC Retail Sales Monitor Y/Y May | 6.80% | |
| 23:50 | JPY | Money Supply M2+CD Y/Y May | 0.50% |
| GMT | Ccy | Events | |
|---|---|---|---|
| 22:45 | NZD | Manufacturing Sales Q1 | |
| Forecast: | Previous: 1.10% | ||
| 23:50 | JPY | Bank Lending Y/Y May | |
| Forecast: 2.40% | Previous: 2.40% | ||
| 23:50 | JPY | Current Account (JPY) Apr | |
| Forecast: 2.59T | Previous: 2.72T | ||
| 23:50 | JPY | GDP Q/Q Q1 F | |
| Forecast: -0.20% | Previous: -0.20% | ||
| 23:50 | JPY | GDP Deflator Y/Y Q1 F | |
| Forecast: 3.20% | Previous: 3.30% | ||
| 01:30 | CNY | CPI Y/Y May | |
| Forecast: -0.20% | Previous: -0.10% | ||
| 01:30 | CNY | PPI Y/Y May | |
| Forecast: -3.00% | Previous: -2.70% | ||
| 03:00 | CNY | Trade Balance (USD) May | |
| Forecast: 101.1B | Previous: 96.2B | ||
| 05:00 | JPY | Eco Watchers Survey: Current May | |
| Forecast: 43.9 | Previous: 42.6 | ||
| 14:00 | USD | Wholesale Inventories M/M Apr F | |
| Forecast: 0% | Previous: 0% | ||
| 23:01 | GBP | BRC Retail Sales Monitor Y/Y May | |
| Forecast: | Previous: 6.80% | ||
| 23:50 | JPY | Money Supply M2+CD Y/Y May | |
| Forecast: | Previous: 0.50% | ||
Tuesday, Jun 10, 2025
| GMT | Ccy | Events | Consensus | Previous |
|---|---|---|---|---|
| 00:30 | AUD | Westpac Consumer Confidence Jun | 2.20% | |
| 01:30 | AUD | NAB Business Confidence May | -1 | |
| 01:30 | AUD | NAB Business Conditions May | 2 | |
| 06:00 | JPY | Machine Tool Orders Y/Y May | 7.70% | |
| 06:00 | GBP | Claimant Count Change May | 4.5K | 5.2K |
| 06:00 | GBP | Average Earnings Excluding Bonus 3M/Y Apr | 5.50% | 5.60% |
| 06:00 | GBP | Average Earnings Including Bonus 3M/Y Apr | 5.50% | 5.50% |
| 06:00 | GBP | ILO Unemployment Rate (3M) Apr | 4.60% | 4.50% |
| 08:30 | EUR | Eurozone Sentix Investor Confidence Jun | -6 | -8.1 |
| 10:00 | USD | NFIB Business Optimism Index May | 95.9 | 95.8 |
| 23:50 | JPY | PPI Y/Y May | 3.50% | 4.00% |
| GMT | Ccy | Events | |
|---|---|---|---|
| 00:30 | AUD | Westpac Consumer Confidence Jun | |
| Forecast: | Previous: 2.20% | ||
| 01:30 | AUD | NAB Business Confidence May | |
| Forecast: | Previous: -1 | ||
| 01:30 | AUD | NAB Business Conditions May | |
| Forecast: | Previous: 2 | ||
| 06:00 | JPY | Machine Tool Orders Y/Y May | |
| Forecast: | Previous: 7.70% | ||
| 06:00 | GBP | Claimant Count Change May | |
| Forecast: 4.5K | Previous: 5.2K | ||
| 06:00 | GBP | Average Earnings Excluding Bonus 3M/Y Apr | |
| Forecast: 5.50% | Previous: 5.60% | ||
| 06:00 | GBP | Average Earnings Including Bonus 3M/Y Apr | |
| Forecast: 5.50% | Previous: 5.50% | ||
| 06:00 | GBP | ILO Unemployment Rate (3M) Apr | |
| Forecast: 4.60% | Previous: 4.50% | ||
| 08:30 | EUR | Eurozone Sentix Investor Confidence Jun | |
| Forecast: -6 | Previous: -8.1 | ||
| 10:00 | USD | NFIB Business Optimism Index May | |
| Forecast: 95.9 | Previous: 95.8 | ||
| 23:50 | JPY | PPI Y/Y May | |
| Forecast: 3.50% | Previous: 4.00% | ||
Wednesday, Jun 11, 2025
| GMT | Ccy | Events | Consensus | Previous |
|---|---|---|---|---|
| 12:30 | CAD | Building Permits M/M Apr | 0.30% | -4.10% |
| 12:30 | USD | CPI M/M May | 0.20% | 0.20% |
| 12:30 | USD | CPI Y/Y May | 2.30% | 2.30% |
| 12:30 | USD | CPI Core M/M May | 0.30% | 0.20% |
| 12:30 | USD | CPI Core Y/Y May | 2.80% | |
| 14:30 | USD | Crude Oil Inventories | -4.3M | |
| 23:01 | GBP | RICS Housing Price Balance May | -3% | -3% |
| 23:50 | JPY | BSI Large Manufacturing Index Q2 | 0.8 | -2.4 |
| GMT | Ccy | Events | |
|---|---|---|---|
| 12:30 | CAD | Building Permits M/M Apr | |
| Forecast: 0.30% | Previous: -4.10% | ||
| 12:30 | USD | CPI M/M May | |
| Forecast: 0.20% | Previous: 0.20% | ||
| 12:30 | USD | CPI Y/Y May | |
| Forecast: 2.30% | Previous: 2.30% | ||
| 12:30 | USD | CPI Core M/M May | |
| Forecast: 0.30% | Previous: 0.20% | ||
| 12:30 | USD | CPI Core Y/Y May | |
| Forecast: | Previous: 2.80% | ||
| 14:30 | USD | Crude Oil Inventories | |
| Forecast: | Previous: -4.3M | ||
| 23:01 | GBP | RICS Housing Price Balance May | |
| Forecast: -3% | Previous: -3% | ||
| 23:50 | JPY | BSI Large Manufacturing Index Q2 | |
| Forecast: 0.8 | Previous: -2.4 | ||
Thursday, Jun 12, 2025
| GMT | Ccy | Events | Consensus | Previous |
|---|---|---|---|---|
| 01:00 | AUD | Consumer Inflation Expectations Jun | 4.10% | |
| 06:00 | GBP | GDP M/M Apr | -0.10% | 0.20% |
| 06:00 | GBP | Industrial Production M/M Apr | -0.40% | -0.70% |
| 06:00 | GBP | Industrial Production Y/Y Apr | -0.70% | |
| 06:00 | GBP | Manufacturing Production M/M Apr | -0.80% | -0.80% |
| 06:00 | GBP | Manufacturing Production Y/Y Apr | -0.80% | |
| 06:00 | GBP | Goods Trade Balance (GBP) Apr | -20.8B | -19.9B |
| 12:30 | USD | PPI M/M May | 0.20% | -0.50% |
| 12:30 | USD | PPI Y/Y May | 2.40% | |
| 12:30 | USD | PPI Core M/M May | 0.30% | -0.40% |
| 12:30 | USD | PPI Core Y/Y May | 3.10% | |
| 12:30 | USD | Initial Jobless Claims (Jun 6) | 251K | 247K |
| 14:30 | USD | Natural Gas Storage | 122B | |
| 22:30 | NZD | Business NZ PMI May | 53.9 |
| GMT | Ccy | Events | |
|---|---|---|---|
| 01:00 | AUD | Consumer Inflation Expectations Jun | |
| Forecast: | Previous: 4.10% | ||
| 06:00 | GBP | GDP M/M Apr | |
| Forecast: -0.10% | Previous: 0.20% | ||
| 06:00 | GBP | Industrial Production M/M Apr | |
| Forecast: -0.40% | Previous: -0.70% | ||
| 06:00 | GBP | Industrial Production Y/Y Apr | |
| Forecast: | Previous: -0.70% | ||
| 06:00 | GBP | Manufacturing Production M/M Apr | |
| Forecast: -0.80% | Previous: -0.80% | ||
| 06:00 | GBP | Manufacturing Production Y/Y Apr | |
| Forecast: | Previous: -0.80% | ||
| 06:00 | GBP | Goods Trade Balance (GBP) Apr | |
| Forecast: -20.8B | Previous: -19.9B | ||
| 12:30 | USD | PPI M/M May | |
| Forecast: 0.20% | Previous: -0.50% | ||
| 12:30 | USD | PPI Y/Y May | |
| Forecast: | Previous: 2.40% | ||
| 12:30 | USD | PPI Core M/M May | |
| Forecast: 0.30% | Previous: -0.40% | ||
| 12:30 | USD | PPI Core Y/Y May | |
| Forecast: | Previous: 3.10% | ||
| 12:30 | USD | Initial Jobless Claims (Jun 6) | |
| Forecast: 251K | Previous: 247K | ||
| 14:30 | USD | Natural Gas Storage | |
| Forecast: | Previous: 122B | ||
| 22:30 | NZD | Business NZ PMI May | |
| Forecast: | Previous: 53.9 | ||
Friday, Jun 13, 2025
| GMT | Ccy | Events | Consensus | Previous |
|---|---|---|---|---|
| 04:30 | JPY | Tertiary Industry Index M/M Apr | 0.20% | -0.30% |
| 04:30 | JPY | Industrial Production M/M Apr | -0.90% | -0.90% |
| 06:00 | EUR | Germany CPI M/M May F | 0.10% | 0.10% |
| 06:00 | EUR | Germany CPI Y/Y May F | 2.10% | 2.10% |
| 08:30 | GBP | Consumer Inflation Expectations | 3.40% | |
| 09:00 | EUR | Eurozone Industrial Production M/M Apr | -1.60% | 2.60% |
| 09:00 | EUR | Eurozone Trade Balance (EUR) Apr | 22.5B | 27.9B |
| 12:30 | CAD | Manufacturing Sales M/M Apr | -2.00% | -1.40% |
| 12:30 | CAD | Capacity Utilization Q1 | 79.80% | 79.80% |
| 12:30 | CAD | Wholesale Sales M/M Apr | 0.30% | 0.20% |
| 14:00 | USD | UoM Consumer Sentiment Jun P | 52 | 52.2 |
| 14:00 | USD | UoM Inflation Expectations Jun P | 6.60% |
| GMT | Ccy | Events | |
|---|---|---|---|
| 04:30 | JPY | Tertiary Industry Index M/M Apr | |
| Forecast: 0.20% | Previous: -0.30% | ||
| 04:30 | JPY | Industrial Production M/M Apr | |
| Forecast: -0.90% | Previous: -0.90% | ||
| 06:00 | EUR | Germany CPI M/M May F | |
| Forecast: 0.10% | Previous: 0.10% | ||
| 06:00 | EUR | Germany CPI Y/Y May F | |
| Forecast: 2.10% | Previous: 2.10% | ||
| 08:30 | GBP | Consumer Inflation Expectations | |
| Forecast: | Previous: 3.40% | ||
| 09:00 | EUR | Eurozone Industrial Production M/M Apr | |
| Forecast: -1.60% | Previous: 2.60% | ||
| 09:00 | EUR | Eurozone Trade Balance (EUR) Apr | |
| Forecast: 22.5B | Previous: 27.9B | ||
| 12:30 | CAD | Manufacturing Sales M/M Apr | |
| Forecast: -2.00% | Previous: -1.40% | ||
| 12:30 | CAD | Capacity Utilization Q1 | |
| Forecast: 79.80% | Previous: 79.80% | ||
| 12:30 | CAD | Wholesale Sales M/M Apr | |
| Forecast: 0.30% | Previous: 0.20% | ||
| 14:00 | USD | UoM Consumer Sentiment Jun P | |
| Forecast: 52 | Previous: 52.2 | ||
| 14:00 | USD | UoM Inflation Expectations Jun P | |
| Forecast: | Previous: 6.60% | ||
Markets Weekly Outlook – US Inflation on Deck as Trade Uncertainty Lingers
Week in review: Trade Uncertainty Lingers, US Data Positive… For Now
Wall Street's main indexes were set to end the week on a high note, after a better-than-expected jobs report calmed worries about the economy, while Tesla rebounded from a sharp plunge a day earlier and technology stocks continued to rise.
Stocks bounced back earlier in the week, following concerns around a deterioration in the US China relationship as well as the US economy. However, decent data out of the US and a much anticipated phone call between US President Donald Trump and China's Xi Jinping has seen some of the risk premium dissipate ahead of the weekend.
The S&P 500 hit its highest in over three months on Friday and remains nearly 2.4% below record highs touched in February. The Dow index also rose to a three-month high.
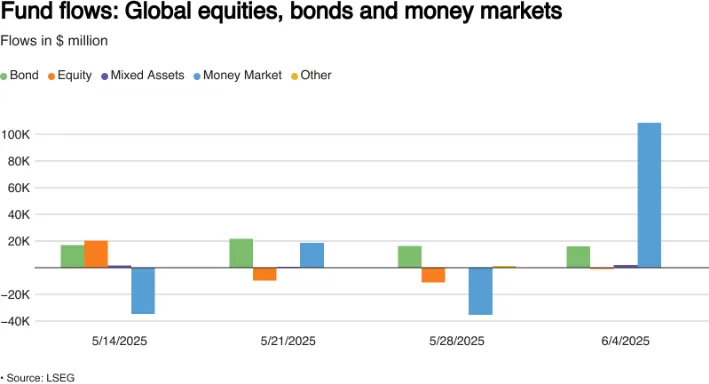
Despite the positive end to the week for US stocks, U.S. equity funds saw money pulled out for the third week in a row by June 4, as worries about U.S. trade policies continued and investors stayed cautious ahead of Friday’s key jobs report.
Meanwhile, European equity funds remained popular for the eighth straight week, boosted by lower inflation and the European Central Bank’s decision to cut interest rates on Thursday.
Data from LSEG Lipper shows investors took out $7.42 billion from U.S. equity funds during the week but invested $2.72 billion in European funds and $1.84 billion in Asian funds.
Source: LSEG
On the commodities front, Gold surrendered most of its early week gains to trade around 0.83% higher for the week. Quite a fall in Gold prices on Thursday and Friday as the precious metal touched $3400/oz on Thursday before beginning its correction, trading at $3317/oz at the time of writing.
Oil prices ended the week on the front foot as US-China talks as well as US jobs data. Markets appeared calmer regarding a global slowdown as the week progressed but uncertainty still remains.
On the FX front, the US Dollar staged a recovery late in the week. The U.S. currency was headed for a second straight weekly gain against both the yen and franc, but it was still down about 8% year-to-date and about 9% year-to-date, respectively, against both currencies.
The dollar index, which compares the U.S. dollar to other major currencies like the yen and euro, went up 0.38% to 99.05 for the day. However, it’s still set to end the week with a loss.
The Week Ahead: US and Chinese Inflation on Deck, Trade Deal Chatter Rumbles On
The week ahead is a bit of a quiet one from a data point of view with US inflation the highlight. This could leave trade deals and tariff developments top of the agenda and overall market sentiment may be the driving force for markets in the week ahead.
Asia Pacific Markets
In China, the big focus will be on inflation (CPI) and May trade data. Inflation has been falling recently due to price competition and cost-cutting, and this trend is expected to continue. Inflation is likely to stay the same as April’s -0.1% YoY figure.
For trade, predictions are less certain because of changing tariffs. Exports are expected to grow at a slower pace of 6.3%, which is still solid and matches the growth seen so far this year. Imports, however, are expected to keep shrinking. This drop in imports, combined with steady exports, has helped China’s trade surplus grow even more this year.
In Japan, the revised GDP data for the first quarter will be released soon. A small improvement is expected due to strong business investment. However, the economy is still predicted to shrink by -0.1% compared to the previous quarter, after adjusting for seasonal changes.
Economic Data from Europe, UK and the US
In developed markets, US inflation takes center stage. Following on from the May jobs report there appears to be an urgent need to cut rates. The outlook remains tough due to trade uncertainty and worries about consumer spending as confidence drops sharply. The main focus will be on inflation, which is expected to rise by 0.2% month-on-month, lower than the 0.3% forecast.
While there were fears of price hikes from tariffs, surveys show businesses are holding off on passing higher costs to customers for now. Lower service inflation is helping keep prices in check temporarily.
However, prices are expected to rise soon, as the Federal Reserve’s Beige Book noted many businesses expect costs to increase significantly. We’re likely to see more price pressures in July and August, which could delay any interest rate cuts by the Fed until late in the year.
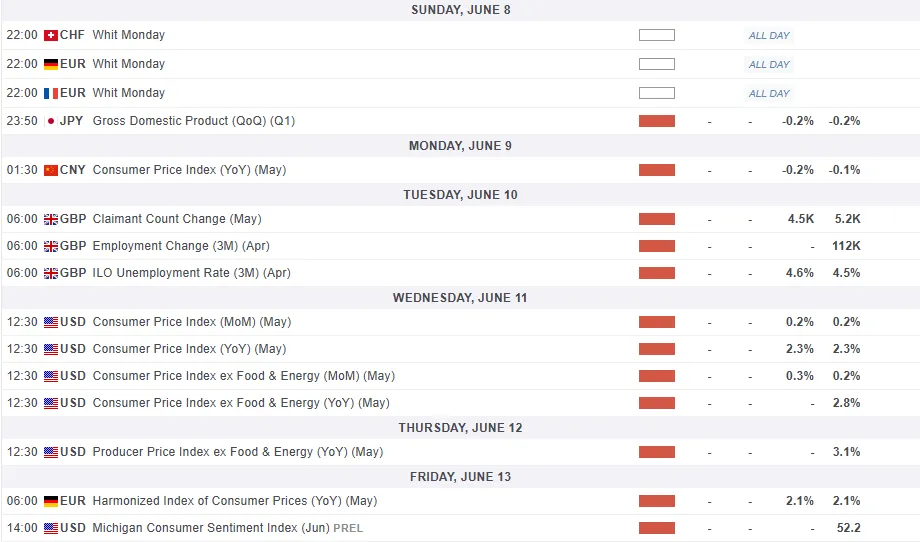
For all market-moving economic releases and events, see the MarketPulse Economic Calendar. (click to enlarge)
Chart of the Week - US Dollar Index (DXY)
From a technical standpoint, the DXY has edged lower over the past few weeks with the trendline break on May 12 so far failing to lead to higher prices.
However, the DXY continues to hold above the April low around the 98.00 handle.
As things stand, Fridays close looks set to leave the DXY with a morningstar candlestick pattern which would hint at further upside next week.
When it comes to the DXY, recent price action has proved that overall market sentiment is a bigger driver at the moment which has been overshadowing the technicals.
Market participants may want to pay attention to the period-14 RSI which is eyeing a move above the neutral 50 level, this is usually seen as a change in momentum and could finally help bulls push prices higher.
Immediate resistance rests at 99.57 before the psychological 100.00 level comes into focus.
On the downside, immediate support rests at 98.57 before the lows at 98.00 come into focus.
US Dollar Index (DXY) Daily Chart - June 6, 2025
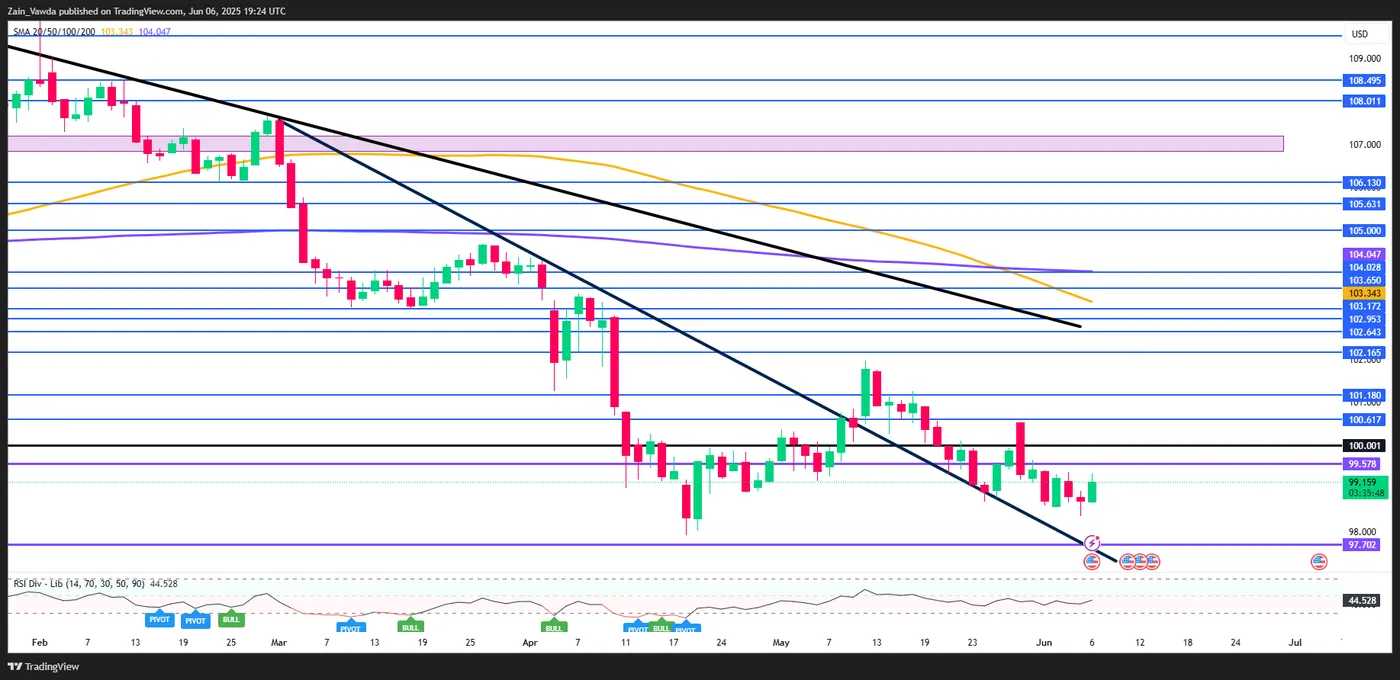
Source: TradingView.Com (click to enlarge)