Sample Category Title
GBP/USD Outlook: Bears Extend on Rising No-Deal Brexit Fears
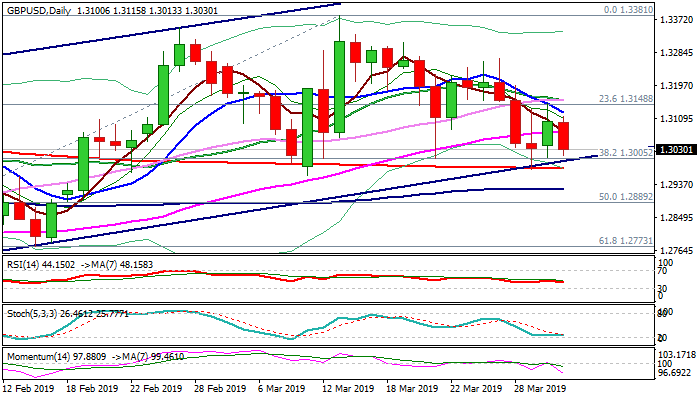
Sterling remains firmly in red ahead of start of the US session on Tuesday and extends weakness closer to psychological/trendline/Fibo supports at 1.30 zone. Rising fears of no deal Brexit continue to weigh on the pound, after PM May's divorce plan has been rejected three times. May failed to find support to her plan or any alternative that increases risk of disastrous scenario of Britain's exit from the EU without agreement on 12 Apr. If she doesn't ratify her deal in the parliament by then or fails to make a deal for further Brexit delay, the no-deal scenario would become reality. Also, weaker than expected UK Construction PMI (Mar 49.7 vs 49.8 f/c) which stays below 50 threshold for the second straight month, adds to negative signals. Cable maintains strong bearish momentum that could help to eventually break key supports at 1.3005/1.2978 (trendline/200SMA) and extend weakness from 2019 high at 1.3381 (13 Mar). Holding below broken 55SMA (1.3077) will keep bears fully in play for final push through 200SMA pivot.
Res: 1.3077; 1.3127; 1.3149; 1.3160
Sup: 1.3000; 1.2977; 1.2924; 1.2889
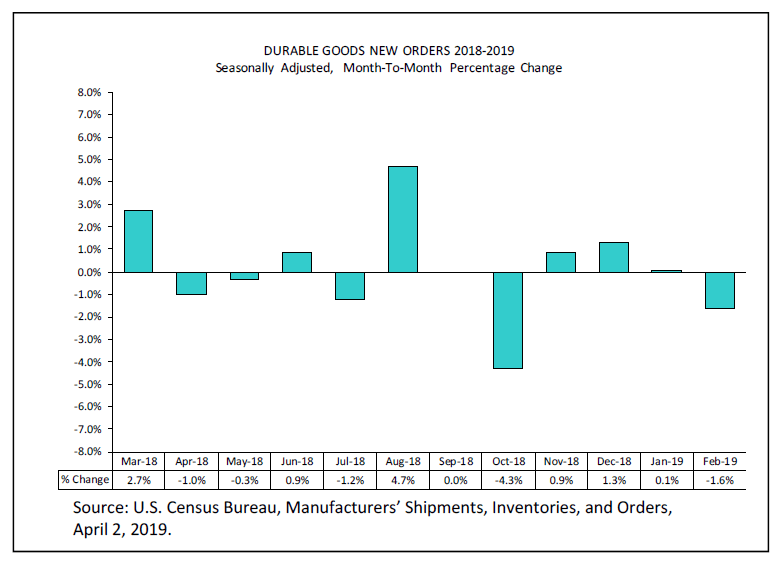
US durable orders dropped -1.6%, ex-transport orders rose 0.1%, missed expectations
US headline durable goods orders dropped -1.6% to USD 250.6B in February, below expectation of -1.2%. Ex-transport order rose 0.1%, also below expectation of 0.3%.
Into US session: Sterling weakest on Brexit deadlock, Dollar and Yen firm
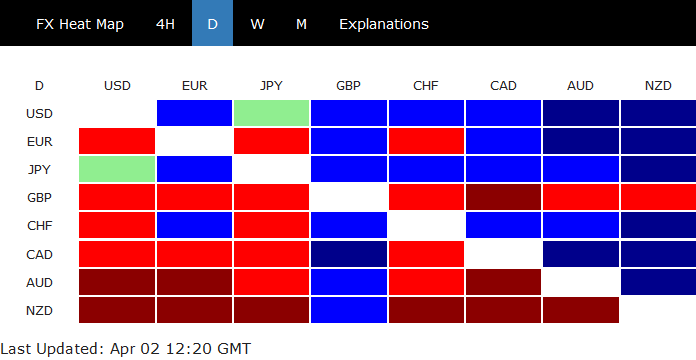
Entering into US session, Sterling is once again the weakest one for today as Brexit uncertainty continues. But still, the Pound is holding above near term support levels against Dollar, Euro and Yen. And thus, it's just experience volatility in tight range. After rejecting all four alternatives in the Commons, there remains no majority on the way forward regarding Brexit. And it's reported that Conservative MP Oliver Letwin might be a abandoning attempts to use indicative votes to find a consensus.
Meanwhile, Prime Minister Theresa May is maintaining the firm opposition to second referendum and a long Article 50 extension. The Financial Times even reported that May would rather go for a no-deal Brexit than revocation. It's also reported that May is still considering to bring back her deal for a fourth vote. But Speaker John Bercow is said to reject it. After all, it seems no one knows what's next.
Staying in the currency markets, New Zealand Dollar is currently the second weakest, followed by Australian Dollar. Aussie dropped notably earlier today after RBA loosen up its monetary policy stance and hinted the next move is data-dependent. But there is no follow through selling yet. Meanwhile, Dollar and Yen are the strongest ones for today
In Europe, currently:
- FTSE is up 1.08%.
- DAX is up 0.64%.
- CAC is up 0.50%.
- German 10-year yield is down -0.011 at -0.036.
Earlier in Asia:
- Nikkei closed down -0.03%.
- Hong Kong HSI rose 0.21%.
- China Shanghai SSE rose 0.20%.
- Singapore Strait Times rose 0.90%.
- Japan 10-year JGB yield is up 0.0101 at -0.068.
Canadian Dollar Improves on Stronger Risk Appetite
The Canadian dollar has looked sharp, with gains of 1.0% since Friday. Will the positive momentum continue on Tuesday? Currently, the pair is trading at 1.3316, up 0.07% on the day. On the release front, there are no Canadian events. In the U.S., core durable goods orders is expected to improve to 0.3%, while durable goods orders is forecast to plunge 1.1%. On Wednesday, the U.S. publishes ISM Non-Manufacturing PMI and ADP nonfarm payrolls.
The Canadian dollar ended last week with strong gains, as Canada’s GDP posted a gain of 0.3% in January. This beat the estimate and came after two successive declines, which has raised concerns about the health of the Canadian economy. The slowdown in the fourth quarter has forced the BoC to turn more dovish and shelve any plans of hiking interest rates. There have even been calls for a rate cut from the bank, but the GDP gain in January will lessen the pressure on the BoC to stimulate the economy.
Positive data out of China this week has also boosted the fortunes of the Canadian dollar. Investor risk appetite has risen following a key manufacturing report that was better than expected. Chinese Caixin Manufacturing PMI improved to 50.8, easily beating the estimate of 50.1 points. Investors cheered as the indicator climbed to an 8-month high, after three successive readings in contraction territory. The Chinese economy has been hit hard by the trade war with the U.S., and a piece of good news sparked strong gains on the equity markets and boosted the Canadian dollar.
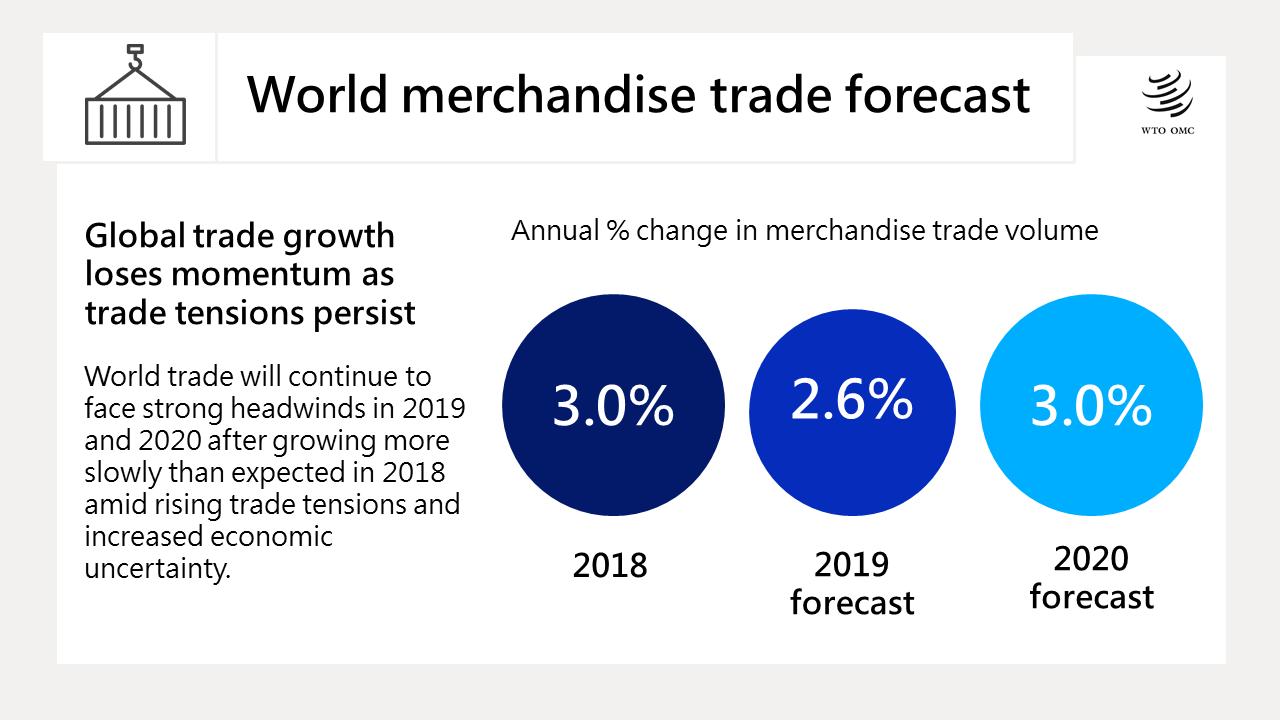
WTO forecasts global trade growth to slow to 2.6% this year
WTO warned that global trade will continue to face "strong headwinds" this year and next due to "rising trade tensions and increased economic uncertainty. For 2019, growth in trade volume is forecast to slow to 2.6%, down fro 3.0% in 2018. Though, trade growth should pic up again to 3.0% in 2020. It also warned that trade tensions still pose the greatest risk to the forecast, but a relaxation could provide some upside potential.
In the press release, WTO Director General Roberto Azevêdo said: said "it is increasingly urgent that we resolve tensions and focus on charting a positive path forward for global trade which responds to the real challenges in today's economy – such as the technological revolution and the imperative of creating jobs and boosting development."
WTO's chief economist Robert Koopman also warned that "any automobile tariff would likely have bigger knock on effects through the global economy than what we see from the U.S.-China conflict."
Dollar Index Futures Could Get More Bullish In Short Term
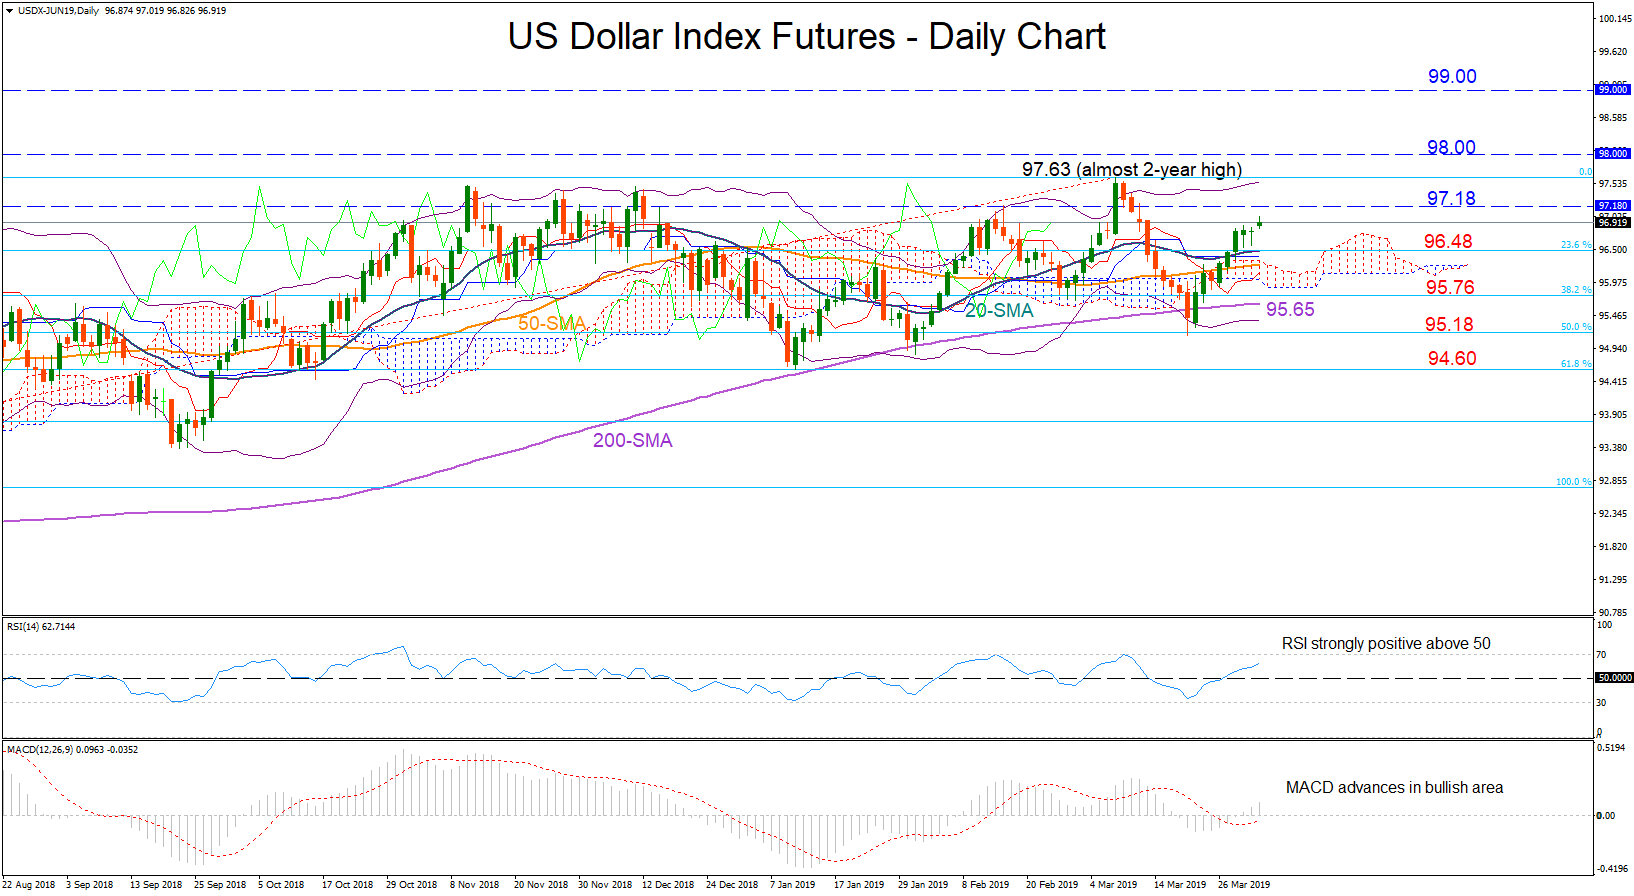
Following the close under the 200-day moving average (MA), the US dollar index future price (with an expiry date in June) regained considerable ground to overcome its MAs once again and return above the Ichimoku cloud, staying mostly green over the past two weeks.
Technically, more upsides could be in store as the MACD keeps strengthening in the positive zone and above its red signal line, while the RSI is maintaining a steep positive slope well above its 50-neutral mark. The fact that the price has still some room to run until it touches the upper Bollinger band could be also a sign that downside corrections may be less likely in the short term.
An extension higher and above the 97 level could meet nearby resistance from the February 15 peak of 97.18, while a more decent rally could push the price until the almost two-year high of 97.63 reached early in March, where the upper Bollinger band is also positioned now. Clearing this top, the next important point to watch out for is 99 but before that, the 98 level could appear psychologically restrictive.
On the flip side, a decline under 96.48, the 23.6% Fibonacci of the upleg from 92.74 to 97.63, could pressure the market towards the 38.2% Fibonacci of 95.76. Slightly lower at 95.65, the 200-day MA may become the trigger point for a new sell-off, with the 50% Fibonacci of 95.18 closely watched in such a case.
In the bigger picture, the market remains in neutrality as long as it holds strictly between 97.63 and 94.60.
U.S. Recession? How Do We Count the Ways?
Executive Summary
The recent inversion of the yield curve has some observers wondering if a recession in the United States is right around the corner. In our view, talk of an imminent U.S. recession is a bit overdone because the underlying fundamentals of the U.S. economy are generally solid at present. Business sector leverage has risen in recent years, but probably not by enough to lead to recession in the near term, while households have de-levered over the past decade. Growth in many foreign economies has slowed, but it would take a significant downturn in the rest of the world to bring the U.S. economy to its knees. Absent some unforeseen shock, "talking" ourselves into a recession seems to be the most realistic way that the U.S. economy could experience one in the foreseeable future.
How Do Recessions Happen?
The inversion of the U.S. yield curve recently—the yield on the 10-year Treasury security slid below the 3-month T-bill yield on March 22, although the spread has subsequently returned to positive territory—has some observers speculating that a recession is around the corner.1 But economic downturns do not occur in a vacuum. That is, something needs to happen to trigger a recession. In that regard, there are two general catalysts for recession. First, an unforeseen shock (a so-called exogenous shock) can lead to a downturn. For example, the decision by OPEC to embargo oil exports in the wake of the Arab-Israeli War in October 1973 led to a nearly fourfold increase in oil prices. U.S. real GDP subsequently contracted more than 3% between Q4-1973 and Q1-1975.
There have been some disruptions that have hit the economy recently, which we will discuss in more detail subsequently, but none of these shocks rise to the magnitude of the 1973 spike in oil prices. Could another major exogenous shock negatively impact the U.S. economy in the near future? Yes, but exogenous shocks by their very nature are difficult to forecast. Consequently, a forecast of recession that is predicated on some yet-to-occur low-probability exogenous shock is probably not very reliable.
Second, a recession can occur when some sector in the economy becomes unbalanced over time. If the inevitable correction is deep enough and if the sector is large enough, then the entire economy can be dragged down. Examples of these types of recession are the housing boom/bust of the last decade and the "tech wreck" of 2000-2001. So, are there any sectors in the U.S. economy that are out of balance at present? If so, would the inevitable correction in these sectors have the ability to cause a recession in the U.S. economy in the foreseeable future? In the remainder of this report, we analyze different sectors of the economy to determine whether a U.S. recession could emanate therein in the foreseeable future.2
Are Consumer Finances in Good Shape?
Household leverage generally, and mortgage debt specifically, was at the epicenter of the last downturn. Although the severe repercussions of consumers getting over-extended a decade ago may still be fresh in the minds of borrowers, lenders and regulators, overall household leverage has fallen substantially over the past decade (Figure 1). As Mark Twain said, however, history does not repeat, but it often rhymes. Are there other areas in consumer balance sheets that pose a risk to the economy from an extensive build up in debt and deterioration in lending standards?
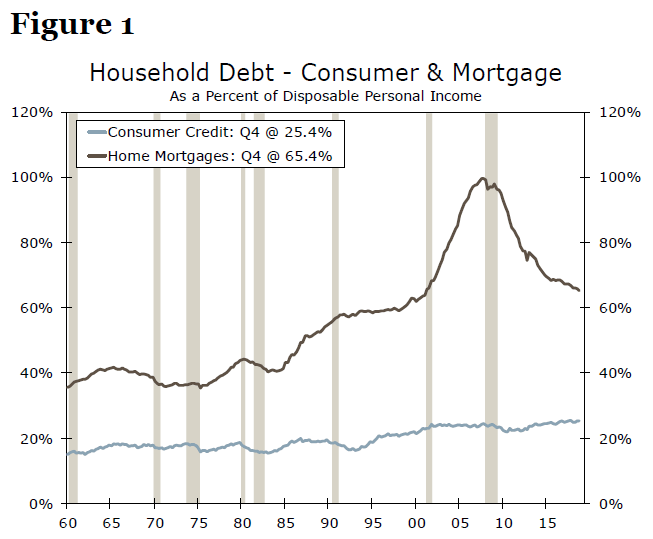
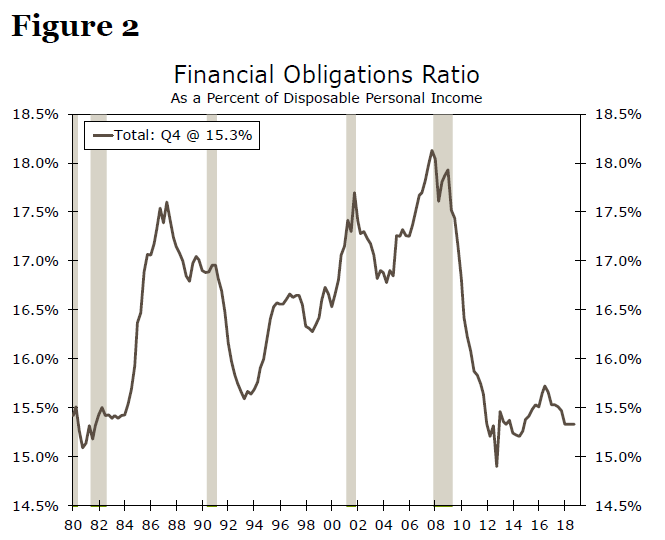
While mortgage debt has fallen over the past decade, Figure 1 also shows that leverage of other types of consumer debt, including autos, credit cards, and student loans, is at an all-time high. Yet unlike housing debt in the 2000s, the increase has not been exponential. Leverage for consumer credit is also only a quarter of the size of housing-related leverage at the height of the housing bust. What's more, debt service remains exceptionally low. Historically low interest rates and longer repayment terms have kept households' monthly financial obligations ratios near levels last seen in the early 1980s (Figure 2).
Notably, the most significant driver of the increase in consumer credit has been student loans. Given that educational debt is nearly impossible to discharge and primarily backed by the federal government, we view student loans as a sustained, long-term headwind to other types of spending rather than a mass credit event that could cause the financial system to seize up like the subprime mortgage crisis. In short, we do not think that consumer debt problems will trigger a recession in the foreseeable future.
Corporate Sector Debt: Keep an Eye on This Space
Where leverage may be more concerning is in the non-financial corporate (NFC) sector. As measured as a percent of GDP, debt in the NFC sector is at a record high. With corporate profit growth slowing, the ability to service debt likely will deteriorate somewhat over the next few quarters. At the same time, a shift in investor sentiment could weigh on asset values, which up until recently had been keeping pace with debt.
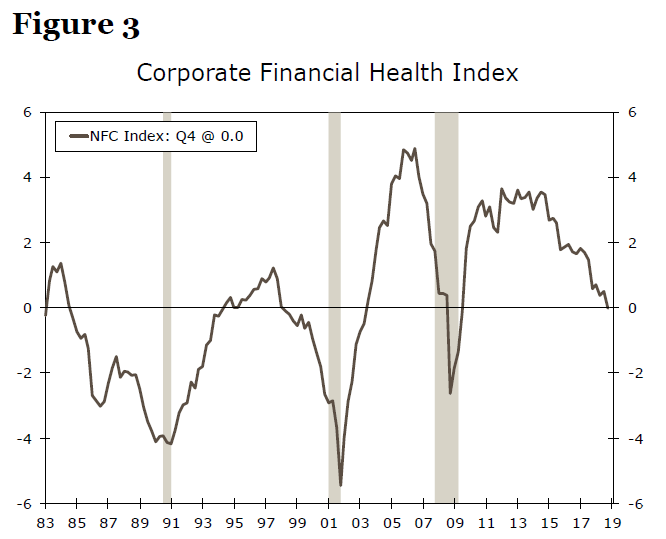
The financial health of the business sector has deteriorated since 2015, and significant further deterioration would be worrisome (Figure 3). Firms that are stretched financially may be more reluctant to invest and hire. In addition, if companies start having trouble servicing their debt due to slower growth and/or higher interest costs, rising charge-offs and loan losses could disrupt credit growth. However, the current health of the non-financial corporate sector does not seem particularly dire at present when compared to the late 1980s or ahead of what we consider to have been the business-led recession of 2001.3 Interest rates have been rising from a historically low level and are unlikely to rise much further this cycle, while companies have locked in historically low interest rates by holding more long-term debt.
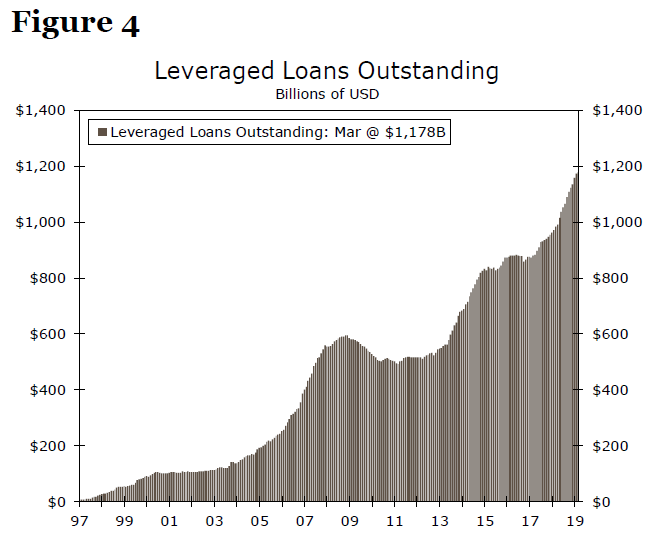
One segment of business sector debt that bears particularly close watch is the leveraged loan market. Leveraged loans are made to companies with high debt-to-cash flow ratios that are typically rated less than investment grade. Loans outstanding in this sector have grown 35% since 2016, twice as fast as total NFC debt. Slower economic growth this year could make servicing that debt more difficult and lead to weaker demand from investors, which would weigh on credit growth to the business sector and therefore the broader economy. Yet leveraged loans are floating-rate instruments, and, with the Fed currently on hold, interest costs are not expected to shoot markedly higher. As a result, we do not see the leveraged loan market as an immediate threat to the economy.4
Is There Overbuilding in Construction?
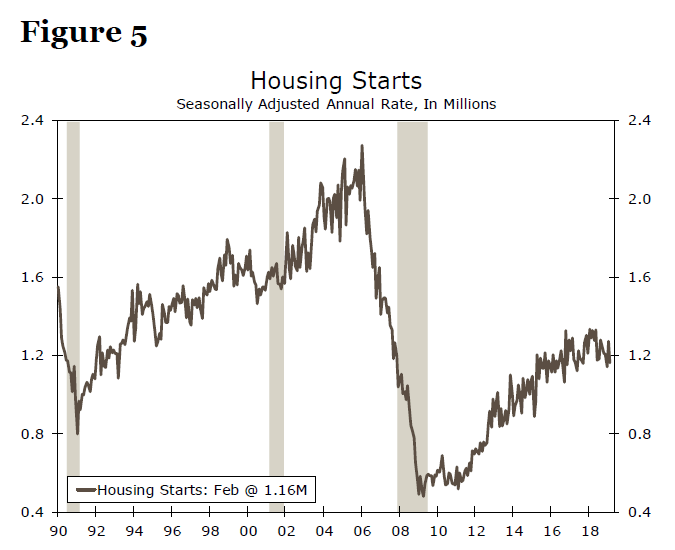
The bursting of the U.S. housing market bubble precipitated the Great Recession but it does not seem that lightning will strike twice, at least not in the current cycle. As noted above, households have de-levered over the past ten years. The value of mortgage debt outstanding among households is down 4% relative to its peak in early 2008. But disposable personal income is up 50% over the past ten years, giving households better ability to service that mortgage debt than they had at the height of the housing bubble. Furthermore, single-family housing starts are roughly 50% lower than they were at the height of the housing boom (Figure 5). Although the level of multifamily starts is a bit higher today than it was a decade ago, apartment vacancy rates are low and rent growth remains solid.
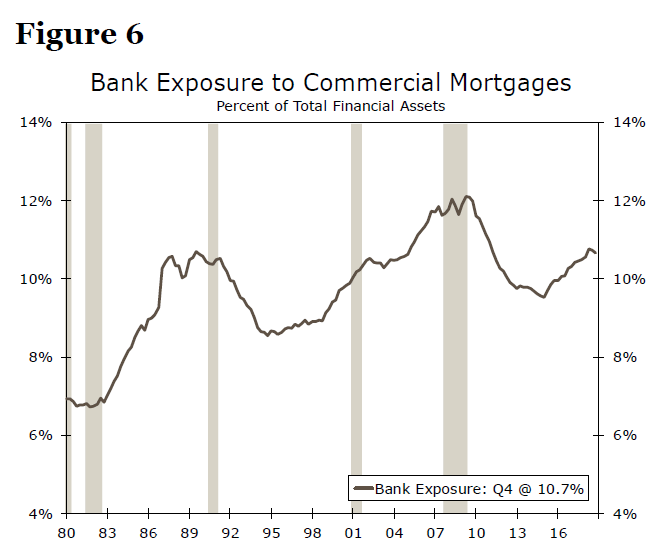
Despite indications of robust activity in commercial construction, we do not think that commercial real estate (CRE) is an accident waiting to happen, at least not in the foreseeable future. As we wrote last autumn, the underlying fundamentals in the CRE market appear to be strong.5 Despite appearances of robust construction activity, the level of real non-residential construction spending is only 16% higher today than it was before the economy tumbled into recession in late 2007. At the end of the expansion in the 1980s, real non-residential construction spending was more than 60% higher than its previous peak. Commercial banks hold nearly $1.7 trillion worth of commercial mortgages, an all-time high. However, this amount represents less than 11% of their total financial assets, which is not out of line in a historical context (Figure 6).
Could the Rest of the World Pull Down the U.S. Economy?
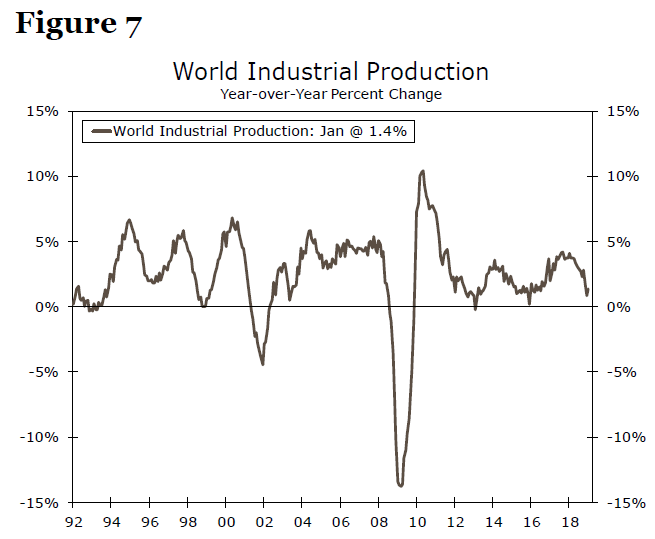
Economic growth in foreign economies has slowed over the past few quarters. Global industrial production (IP) was growing roughly 4% on a year-ago basis in early 2018 (Figure 7). At present global IP is up only 1% or so. Some of this loss of momentum represents secular deceleration in China and some other large developing economies. But the direct effects of trade restrictions and the uncertainty regarding the outlook for trade policy arguably have also played a role in slowing the rate of global economic growth. Could slow growth in the rest of the world lead to a U.S. recession?
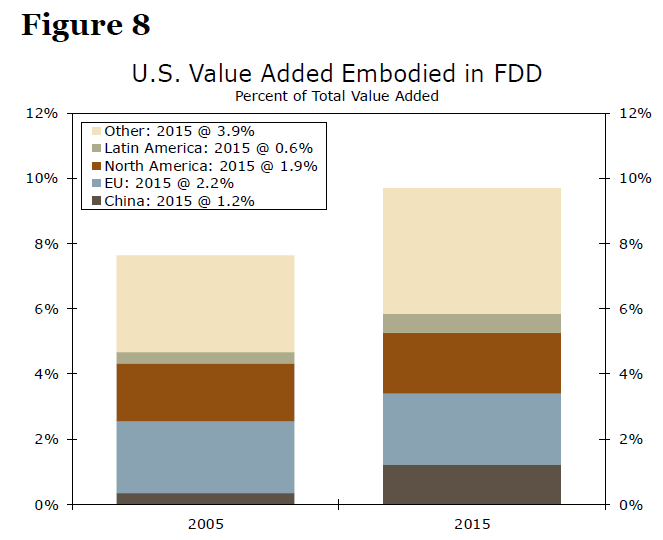
The value of American exports of goods and services totaled $2.5 trillion in 2018. Yet, the value added (i.e., income) of those exports of goods and services that is embodied in foreign final demand (final sales to foreign households, businesses and governments) represents only 10% of total value added in the U.S. economy. That percentage has grown from less than 8% a decade ago, due in part to strong economic growth in China that has pulled in American goods and, to a lesser extent, services (Figure 8). But with exports accounting for only 10% of U.S. value added, it would take a sharp downturn in the rest of the world to lead to a recession in the United States. Although foreign economic growth has ratcheted down in recent quarters and conceivably could slow further, we forecast that most major economies will not slip into recession in the foreseeable future. In short, the rest of the world can exert a slowing effect on U.S. GDP growth, but those headwinds probably are not strong enough to blow the U.S. economy significantly off course at this time.
Are Financial Market Conditions Restrictive?
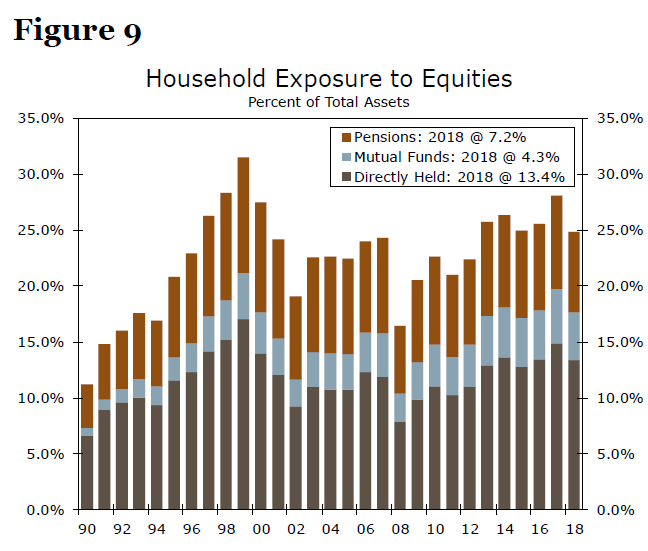
The U.S. stock market has encountered some volatility recently for a number of reasons. Could a significant decline in equity prices, should one occur, lead to a U.S. recession? Let's start with the effect that equity prices have on households. Equities that are directly held account for roughly 15% of household assets (Figure 9). Adding in our estimate of the amount of stocks that people hold in mutual funds and pensions raises exposure to equities to about 25% of total household assets.6 But researchers have generally found that a one dollar change in equity prices causes consumption spending to change by only a few cents.7
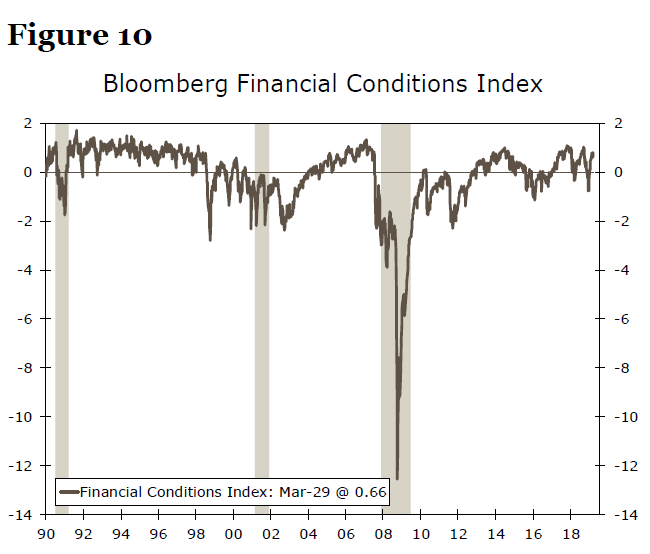
But a significant decline in the stock market would raise the cost of capital for firms, which probably would have a depressing effect on investment spending and employment. Furthermore, a swoon in equity prices likely would be associated with a generalized tightening in financial conditions, which would weigh on overall economic activity. Financial markets do not need to seize up entirely à la 2007-2009 to lead to economic weakness (Figure 10). Tightening in financial markets in the wake of the dot-com bust in 2000 contributed to the recession of 2001. At present, financial market conditions generally are accommodative. The stock market remains at a high level, credit spreads generally remain tight and bank lending remains positive. But a significant deterioration in financial market conditions could eventually lead to economic weakness in coming quarters. Clearly, the Federal Reserve could lead to tighter overall financial conditions if it were to significantly raise rates, but Fed policymakers have emphasized recently that they intend to be "patient" in coming months.
Conclusion
In our view, talk of an imminent U.S. recession is a bit overdone. Yes, the yield curve inverted a bit recently. But the underlying fundamentals of the U.S. economy do not indicate that recession is right around the corner, in our view. Household balance sheets are generally solid. Leverage in the NFC sector has risen in recent years, but it probably is not so high now to cause a recession in the near term. Growth in many foreign economies has slowed, but it would take significant downturns in the rest of the world to bring the U.S. economy to its knees.
So what is the most realistic way that the U.S. economy slips into recession in coming months? In the absence of some shock that is unforeseen at this time, the most realistic way for a recession to happen in the foreseeable future is that we simply "talk" ourselves into one. Consumers could hear about prognostications of recession and could stop spending. Businesses could curtail investment and hiring decisions if they surmise that recession is on the way. The stock market would likely weaken, leading to a negative feedback loop. With real GDP growth having slowed already, it may not take much of a risk shock to tip over the economy at this time. In short, expectations of economic weakness could become self-fulfilling. Fortunately, we have never "talked" our way into recession, at least not in living memory. In the immortal words of Franklin Delano Roosevelt, "the only thing we have to fear is fear itself."
1 See "Inverted Yield Curve: Is It Different This Time?" (March 26, 2019) for a discussion about the reliability of the slope of the yield curve as an indicator of pending recession.
2 For model-based predictions of recession, see "Recession Update: Should We Worry?" (April 1, 2019).
3 See "U.S. Corporate Sector Health: Should We Worry?" (September 27, 2018).
4 See "Leveraged Loans: A Deathknell for the U.S. Economy?" (December 18, 2018).
5 See "Does CRE Pose a Risk to the Financial System?" (November 26, 2018).
6 Pension funds include public and private defined benefit and defined contribution plans.
7 For example, Calomiris, Longhofer and Miles (2012) find that a one dollar change in securities wealth leads to a change in consumption expenditures of only two cents. https://www.nber.org/papers/w17740.pdf
DAX Takes Rally Continues On Optimism Over China
The DAX has posted more gains on Tuesday, after starting the week with excellent gains. Currently, the DAX is at 11,733, up 0.45% on the day. Currently, the DAX is trading at 11.652, up 1.1% on the day. It’s a quiet day on the release front, with just one event. Eurozone PPI dipped to 0.1%, shy of the estimate of 0.2%. On Wednesday, Germany and the eurozone release services PMIs, and the eurozone will also post retail sales.
The DAX soared on Monday, posting its best daily gains since mid-February. The index jumped 1.35%, despite a weak German manufacturing PMI. French and German markets ignored the soft German data, focusing on Chinese data instead. The Chinese Caixin Manufacturing PMI didn’t sparkle, but improved to 50.8 and easily beat the estimate of 50.1 points. Investors cheered as the indicator climbed to an 8-month high, after posting three successive releases indicating contraction. The Chinese economy has been hit hard by the trade war with the U.S., and a piece of good news sparked strong gains on the equity markets.
Investors have become used to lukewarm data out of the eurozone and Germany, but are also discovering that the mighty U.S. economy is showing signs of slowing down. Retail sales, the primary gauge of consumer spending, looked dismal in March. The indicator declined by 0.2%, shy of the estimate of +0.3%. Core retail sales declined by 0.4%, a sharp drop from the 0.9% gain a month earlier. Both indicators posted a second decline in three months, which is bound to raise concerns about the strength of the economy. Growth for the first quarter could be as low as 0.8% annualized, compared to 2.2% in the third quarter.
Be Careful of U.K. Data Boomerang
Executive Summary
Recent U.K. economic data have seemingly been boosted by firms stockpiling in preparation for a no-deal Brexit. The problem with stockpiling is that it reduces the need for future production, and thus a potentially artificially-boosted Q1 GDP reading could be followed by a weak or even negative Q2 GDP print. Amid these inventory dynamics and given that Brexit uncertainty is dragging on longer than we envisaged, we are cutting our U.K. GDP forecasts, but making no changes to our Bank of England forecasts for now.
U.K. Macro Data Boosted by Brexit Stockpiling—Beware the Snapback
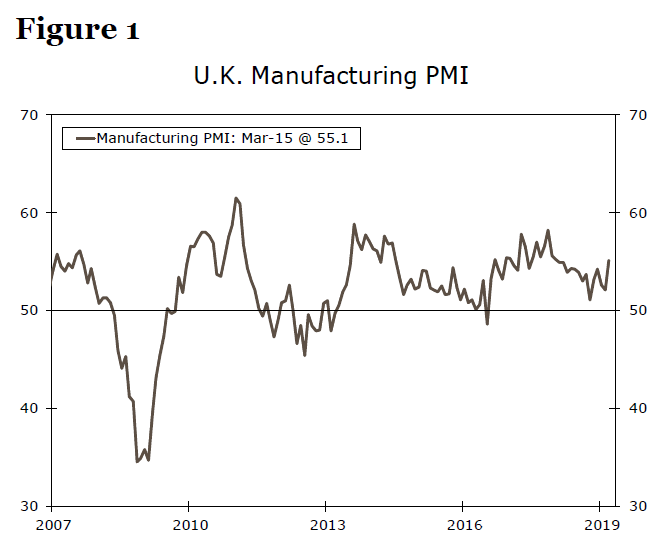
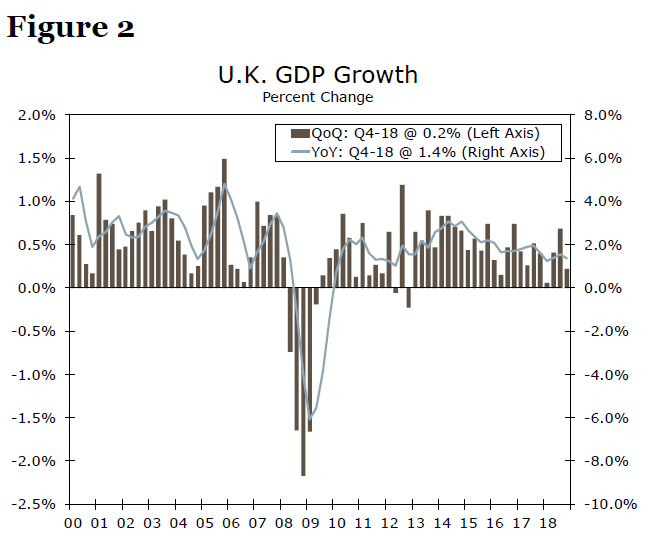
The U.K. economy has been surprisingly resilient despite uncertainty around Brexit, at least when the data are taken at face value. GDP rebounded in January with a 0.5% month-over-month gain amid strong manufacturing output, while retail sales beat expectations with solid gains in the first two months of the year. Meanwhile, data released today showed the U.K. March manufacturing PMI jumped to 55.1, the highest in nearly a year, even as the March 29 Brexit deadline was looming. What gives?
The U.K. manufacturing PMI release offers some clues. It notes that March was a record month for inventory building as manufacturers prepared for a potential no-deal exit from the European Union, activity which also boosted output and employment in the sector. The first takeaway is that this stockpiling activity will likely boost Q1 GDP, and we see upside risks to the current consensus estimate for U.K. Q1 GDP of 0.3% month-over-month (the data is not released until May 10). Beyond the first quarter, however, we see more downside risks for U.K. GDP. In the unlikely event the U.K. leaves the European Union without a deal on April 12, stockpiling among firms is unlikely to do much to cushion the impact on the U.K. economy, which would likely be sharply negative. In the more likely event that the U.K. avoids a no-deal exit, the unwinding of the inventory build should also be a negative event for the U.K. economy—albeit a much less significant one than a no-deal exit—and in turn a downside risk for the pound. With inventories already built up among firms, the need for future production is lessened, while firms could also resort to discounting current inventory in an effort to unload it and in turn see margin compression. To be sure, resilience in U.K. economic activity may not entirely be a function of Brexit stockpiling. Retail sales data suggest solid consumer demand, but the question will be whether this demand continues into the second quarter and whether it offers any offset to the potential inventory drawdown after the first quarter.
In part due to these inventory dynamics, but also in response to the prolonged uncertainty of the Brexit process, we are downgrading our forecasts for U.K. GDP. We now look for U.K. GDP growth of just 1.3% in 2019 (down from 1.5% previously) and 1.4% in 2020 (down from 1.5% previously). Meanwhile, we still look for just one rate hike from the Bank of England this year in August.
USDJPY Targets Further Recovery Threat On Bull Pressure
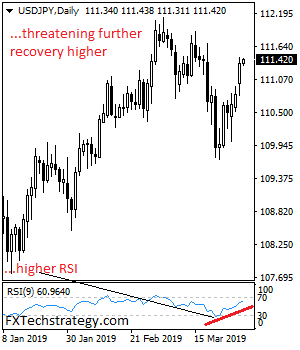
USDJPY targets further recovery threats as it builds on bull pressure with eyes on the 111.89 resistance zone. On the upside, resistance comes in at 112.50 level. Above this level will turn attention to the 113.00 level. Further out, we expect a possible move towards the 113.50 level. A cut through here will open the door for more gain towards the 114.00. Its daily RSI is bullish and pointing higher suggesting further upside pressure. On the downside, support comes in at the 111.00 level where a break will target the 110.50 level. Below that level will turn focus to the 110.00 level and then lower towards the 109.50 level. On the whole, USDJPY targets further recovery threats on upside pressure