Sample Category Title
EUR/JPY Daily Outlook
Daily Pivots: (S1) 124.31; (P) 124.67; (R1) 124.98; More....
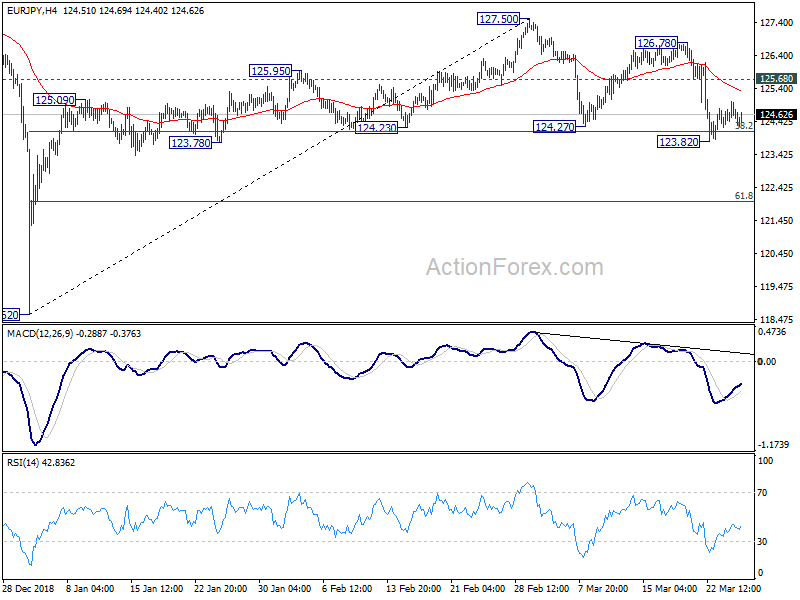
Intraday bias in EUR/JPY remains neutral for consolidation above 123.82 temporary low. Some consolidations could be seen and further fall is expected with 125.68 minor resistance intact. On the downside, break of 123.82 will resume the fall from 127.50 to 61.8% retracement of 118.62 to 127.50 at 122.01. However, break of 125.68 will bring stronger rebound back to 127.50 resistance.
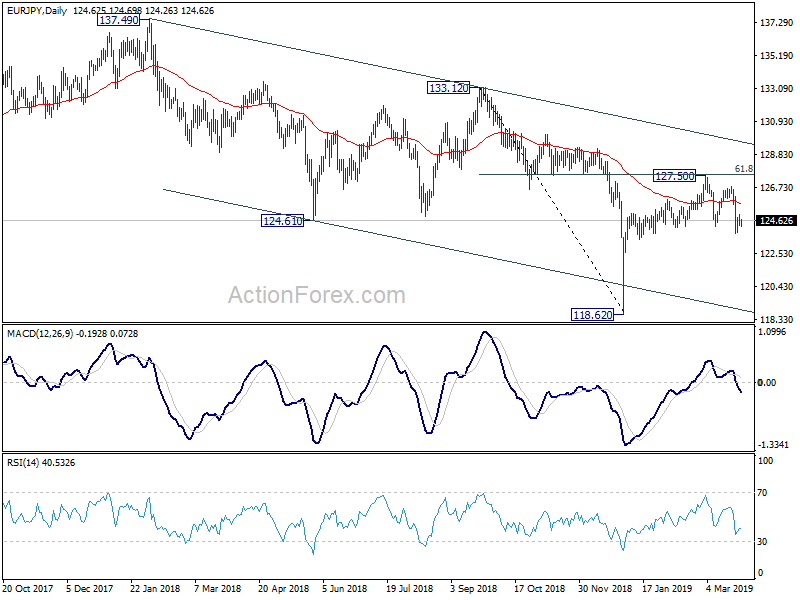
In the bigger picture, rebound from 118.62 might have completed earlier than expected at 127.50. EUR/JPY is held well inside medium term falling channel, and below 55 week EMA (now at 127.86). That is, the down trend from 137.49 (2018 high) might still be in progress. Break of 118.62 will target 109.03/114.84 long term support zone. On the upside, however, break of 127.50 will extend the rebound from 118.62 to 133.12 key resistance instead.
EUR/GBP Daily Outlook
Daily Pivots: (S1) 0.8501; (P) 0.8549; (R1) 0.8578; More...
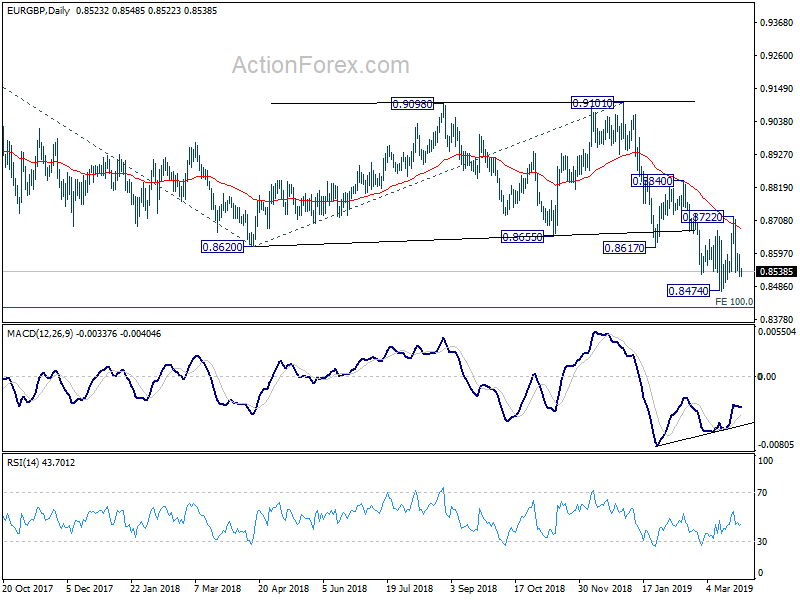
EUR/GBP is staying in consolidation from 0.8474 and intraday bias remains neutral first. On the downside, break of 0.8474 low will resume recent down trend and target 0.8416 long term projection next. On the upside, though, break of 0.8722 will resume the rebound from 0.8474 to 0.8840 resistance first.
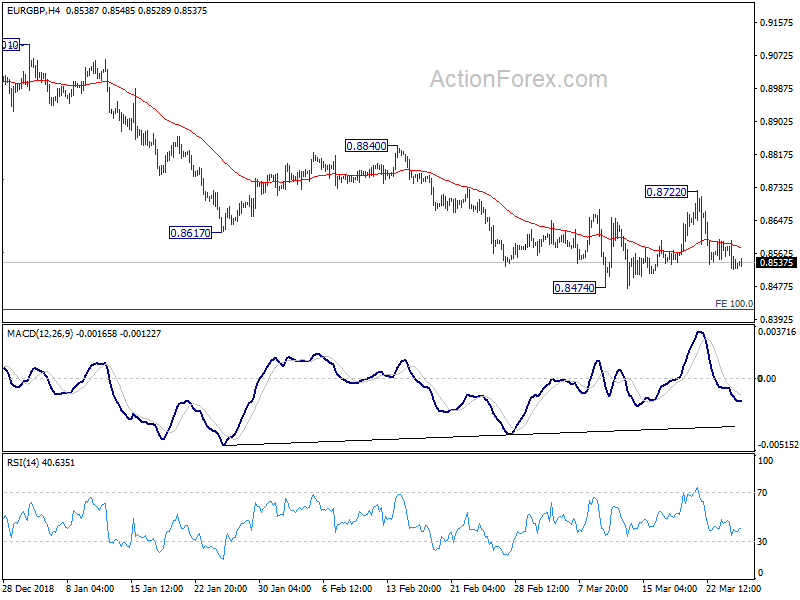
In the bigger picture, EUR/GBP is seen as staying in long term range pattern started at 0.9304 (2016 high). Current fall from 0.9305 (2017 high), is a falling leg inside the pattern. Such decline could extend to 100% projection of 0.9305 to 0.8620 from 0.9101 at 0.8416 and possibly below. But for now, we'd expect strong support around 0.8312 support to contain downside and bring rebound.
EUR/AUD Daily Outlook
Daily Pivots: (S1) 1.5738; (P) 1.5833; (R1) 1.5887; More...
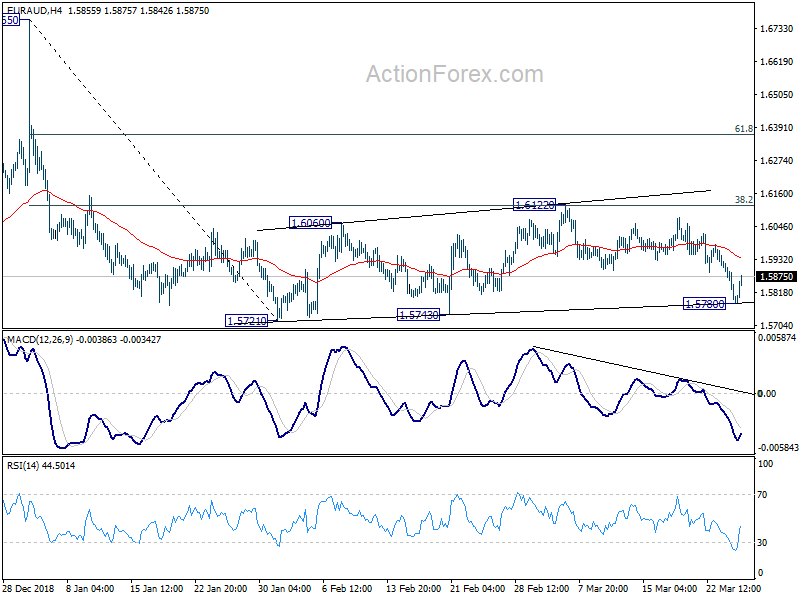
EUR/AUD reached as low as 1.5780 but recovered since then. It's also kept in range of 1.5721/6122. Intraday bias remains neutral first and more consolidation could still be seen. On the downside, break of 1.5721 low will resume the fall from 1.6765 and target 1.5346 support next. On the upside, though, break of 1.6122 will extend the pattern from 1.5721 with another rise.
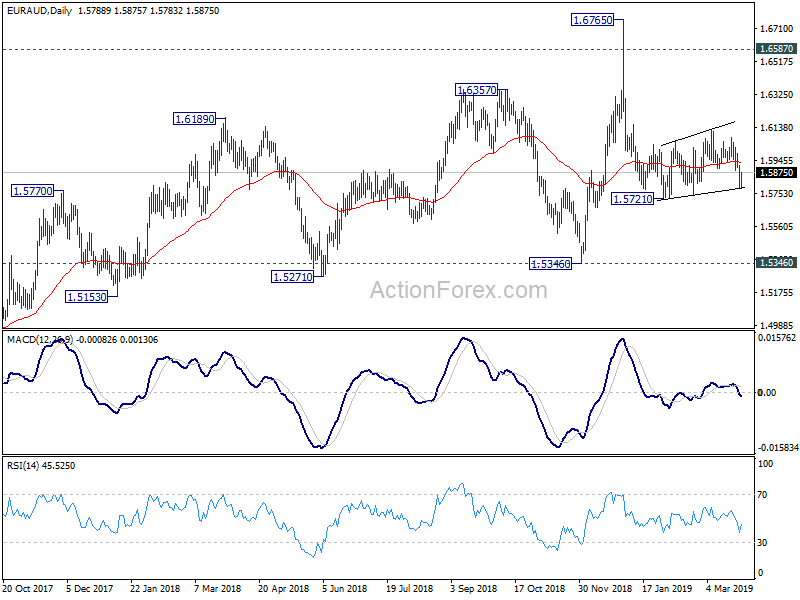
In the bigger picture, as long as 1.5346 support holds, outlook will remain bullish. Uptrend from 1.1602 (2012 low) is expected to resume sooner or later. Break of 1.6765 will target 61.8% retracement of 2.1127 (2008 high) to 1.1602 at 1.7488 next. However, firm break of 1.5346 key support will indicate trend reversal, with bearish divergence condition in weekly MACD, and turn outlook bearish.
EUR/CHF Daily Outlook
Daily Pivots: (S1) 1.1188; (P) 1.1217; (R1) 1.1235; More...
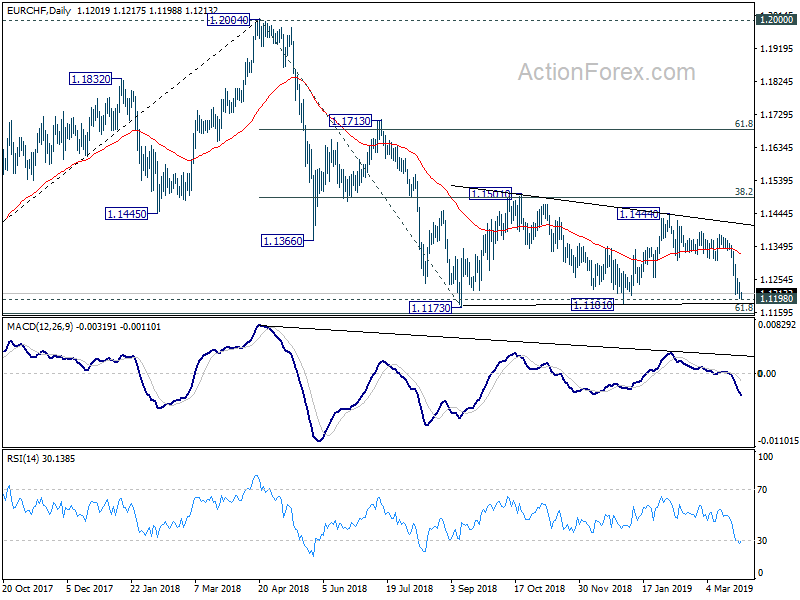
EUR/CHF's decline resumed after brief consolidation and intraday bias is back on the downside. Decisive break of 1.1173 low (inside 1.1154/98 key support zone) will carry larger bearish implication and could trigger downside acceleration. On the upside, though, break of 1.1256 minor resistance will turn bias back to the upside for recovery to 1.1310 support turned resistance.
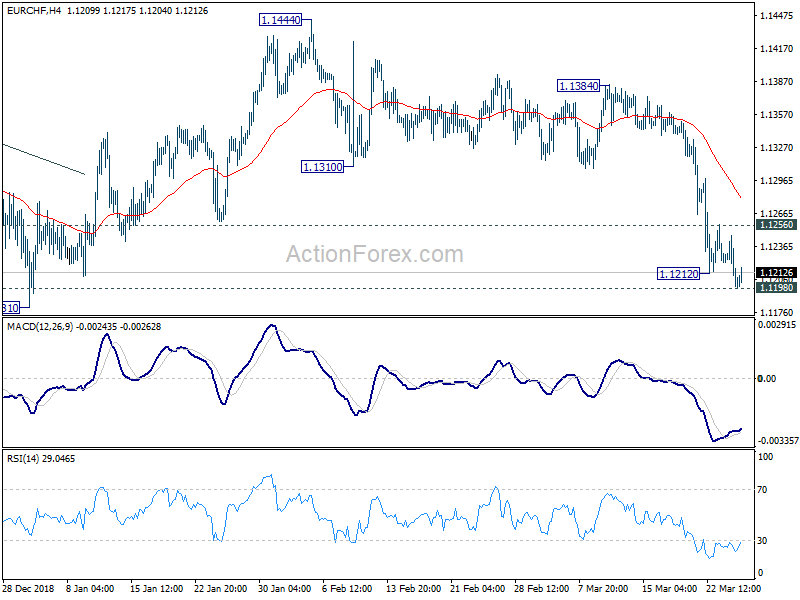
In the bigger picture, with last week's sharp decline, price actions from 1.1173 are now looking more like a consolidation that's completed at 1.1444. Bearishness is also reflected in multiple rejection by 55 week EMA. Immediate focus is back on 1.1154/98 support zone (2016 high and 61.8% retracement of 1.0629 to 1.2004 at 1.1154). Decisive break there will confirm resumption of whole down trend from 1.2004 and long term bearish reversal. 1.0629 support will be next target.
USDJPY 110.90 Major Resistance
The US dollar has recovered above the 110.40 resistance level against the Japanese yen, with the risk-sensitive pair so far finding weekly resistance from the 110.68 level. The USDJPY pair has a bullish intraday bias while trading above the 110.40 level, although major weekly resistance is located at the 1110.90 level. Technical indicators on the four-hour time frame have now corrected back towards neutral trading conditions.
The USDJPY pair is bullish while trading above the 110.40 level, key resistance is found at the 110.90 and 111.30 levels.
If the USDJPY pair trades below the 110.40 level, sellers may test towards the 110.00 and 109.70 support levels.

LTCUSD $60.00 Hard Resistance
Litecoin continues to struggle with the $60.00 resistance level as buying volumes and bullish momentum are starting to subside. The Ichimoku indicator on the daily time frame is showing that key support for the LTCUSD pair is found at the $57.00 and $52.00 levels. If the $52.00 level is broken, critical weekly support from the Ichimoku cloud is found at the $40.00 level.
If the LTCUSD pair moves under the $60.00 level, buyers may test towards the $65.00 and $70.00 resistance levels.
If the LTCUSD pair falls under the $57.00 level, key support is found at the $52.00 and $40.00 levels.

EURUSD Heavily Bearish Below 1.1275
The euro is back under downside pressure against the greenback, with the pair once again trading well below the 1.1300 level. Further downside in the EURUSD pair towards the 1.1237 level now seems increasingly likely while price trades below the 1.1275 level. European Central Bank President Mario Draghi’s speech will set the tone for the single currency during the European trading session.
The EURUSD pair bearish while trading below the 1.1275 level, key technical support is found at the 1.1237 and 1.1175 levels.
If the EURUSD pair trades above the 1.1275 level, buyers may test back towards the 1.1290 and 1.1330 resistance levels.

Kiwi Tanks After A Dovish RBNZ Points To A Rate Cut
The kiwi tanked after the RBNZ made its interest rates decision. The bank left rates unchanged at the 1.75% level, where they have been since 2016. This was expected. What was not expected was the bank’s announcement that it could be forced to lower rates this year. This decision came after other central bankers have turned a bit dovish. Just last week, the Fed announced that it won’t hike this year. In the week before, the ECB announced that it won’t hike until December this year. In the statement, the RBNZ said that:
The balance of risks to this outlook has shifted to the downside. The risk of a more pronounced global downturn has increased and low business sentiment continues to weigh on domestic spending. On the upside, inflation could rise faster if firms pass on cost increases to prices to a greater extent. We will keep the OCR at an expansionary level for a considerable period to contribute to maximizing sustainable employment, and maintaining low and stable inflation.
The price of crude oil edged up slightly after the API released the inventory numbers for the past week. The data showed that inventories rose by 1.9 million barrels. This was higher than last week’s drawdown of more than 2.1 million barrels. Today, the official government numbers will be released. They are expected to show that there was a drawdown of more than 1.2 million barrels. The data released last week showed that the drawdown was more than 9 million barrels, which led the price of oil to rise.
Focus will remain on Brexit as MPs start debating various options in Parliament in a process that could extend to the coming week. There are a few options. The customs union option allows Britain to negotiate a new customs union with the EU after Brexit. The common market 2.0 allows the UK to remain in the single market by joining the European Free Trade Association (EFTA) and staying in the European Economic Area. Another option is to join the EFTA and EEA but making them enforceable by UK courts. Theresa May’s deal could also be accepted but without a backstop arrangement. Finally, there is the option of another referendum or abandoning article 50 altogether.
EUR/USD
The EUR/USD slid in overnight trading. The pair is now trading at 1.1255, which is below the 25-day and 50-day moving average while the Relative Strength Index (RSI) has declined to the oversold level of 30. This price is slightly below the 23.6% Fibonacci Retracement level of 1.1268. After crossing this support, the pair could retest the previous lows of 1.1175.

GBP/USD
Sterling was little moved against the USD as MPs start deliberating on the next action on Brexit. The pair is trading at 1.3185, which is within yesterday’s range. On the hourly chart, the pair is above the important yellow support shown below. It is also close to the 23.6% Fibonacci Retracement level of 1.3186. There is a likelihood that the pair will continue moving lower to test the important support of 1.3100.

NZD/USD
The NZD/USD pair tanked after the decision by RBNZ. It declined from a high of 0.6190 to a low of 0.6975. This is the lowest level since the first week of March. On the hourly chart, the current price is below the 61.8% Fibonacci Retracement level of 0.6817. It is also sharply along the lower line of the Bollinger Bands. The pair could make a slight recovery today, but the downward trend could prevail.

AUDUSD Fails To Exit Ichimoku Cloud, Indicators Signal Neutral Bias
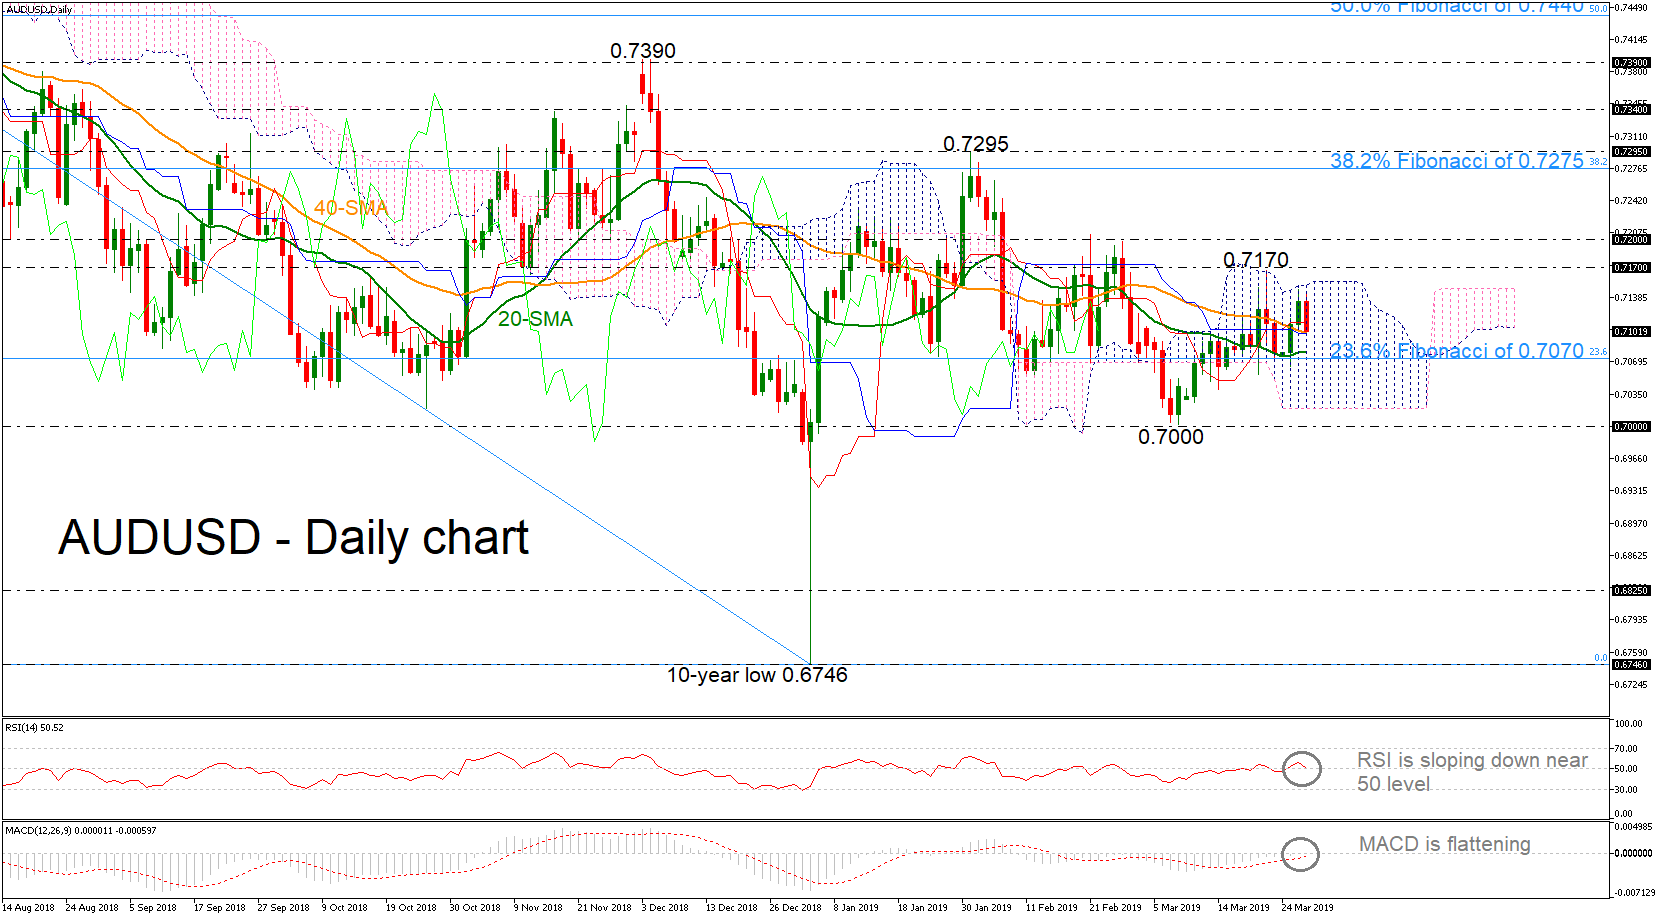
AUDUSD has been consolidating within the Ichimoku cloud since the price found strong support at the 0.7000 psychological level. The neutral picture in the short-term could last for longer if the bulls find hard to break above the upper line of the cloud as in the previous sessions.
The neutral bias is supported by the deterioration in the momentum indicators. The RSI is approaching its threshold of 50, while the MACD oscillator is flattening near the trigger and zero lines.
Should the price retreat further, immediate support may come from the 23.6% Fibonacci retracement level of the downward movement from 0.8135 to 0.6746, around 0.7070. A successful decline below this level could drive the pair until 0.7000 before a retest of the 0.6825 level, where the pair bottomed on January 2016.
In the alternative scenario, traders would be eagerly looking for a successful break of the Ichimoku cloud to increase buying orders, probably towards the 0.7170 – 0.7200 resistance zone. If bullish forces appear even stronger, the 0.7200 key level should be another resistance to keep in mind, while more upside pressure could touch the 38.2% Fibonacci of 0.7275.
Over the last seven months AUDUSD stands in a narrow range within the 0.7000-0.7390 area.
EUR/USD Daily Outlook
Daily Pivots: (S1) 1.1243; (P) 1.1284; (R1) 1.1308; More.....
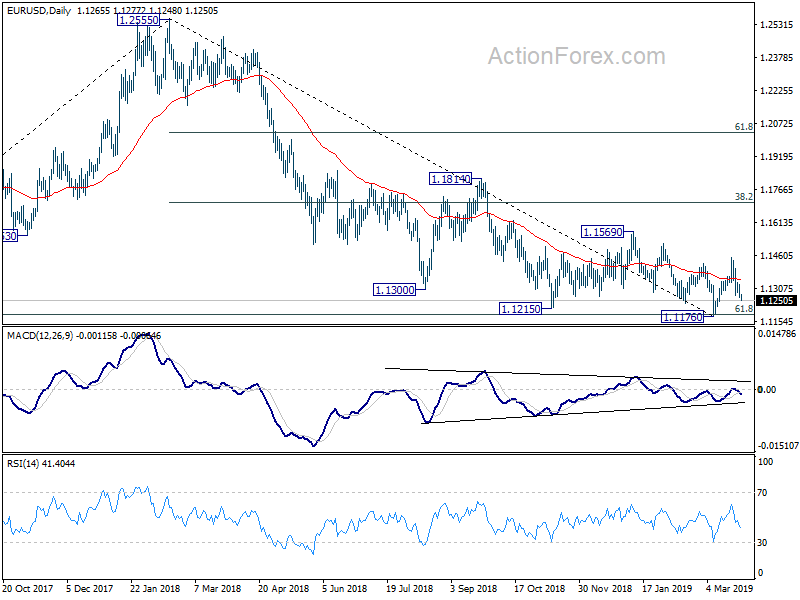
EUR/USD's fall from 1.1448 resumed by breaking 1.1273 temporary low. Intraday bias is turned back to the downside fro retesting 1.1176 low. Decisive break there will resume whole decline from 1.2555. On the upside, however, break of 1.1331 minor resistance will turn bias back to the upside for 1.1448 instead.
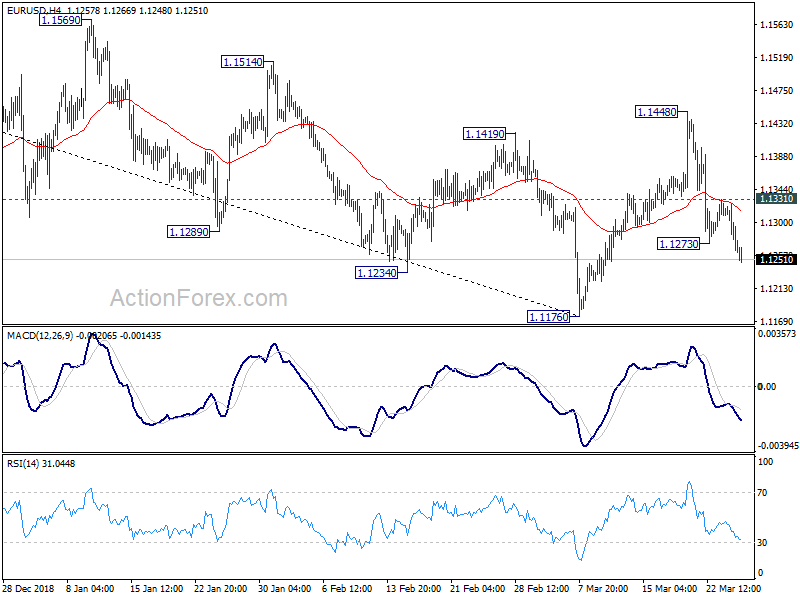
In the bigger picture, medium term outlooks is a bit mixed for now as there are conflicting signals. We'll turn neutral first. On the downside, decisive break of 61.8% retracement of 1.0339 (2016 low) to 1.2555 (2018 high) at 1.1186 will resume the whole down trend from 1.2555. Next target will be 1.0339 low. Nevertheless, break of 1.1569 resistance should confirm medium term bottoming. Stronger rebound should be seen back to 38.2% retracement of 1.2555 to 1.1176 at 1.1703. In that case, the structure of the rise from 1.1176 and reaction to 1.1703 fibonacci level will be watched for making an assessment on whether medium term trend has reversed, or rebound form 1.1176 is merely a correction.