

Sample Category Title
Fed Turns Even More Dovish in March – Downgrading Economic Outlook, Pausing Rate Hike Cycle, Ending Balance Sheet Reduction
The Fed has turned more dovish than previously expected. Besides downgrading the economic assessments at the policy statement, the members now expect no change in interest rate this year, followed by one rate hike in 2020. They also revised lower the economic projections and decided to terminate the balance sheet reduction plan in September this year.
Economic Projections
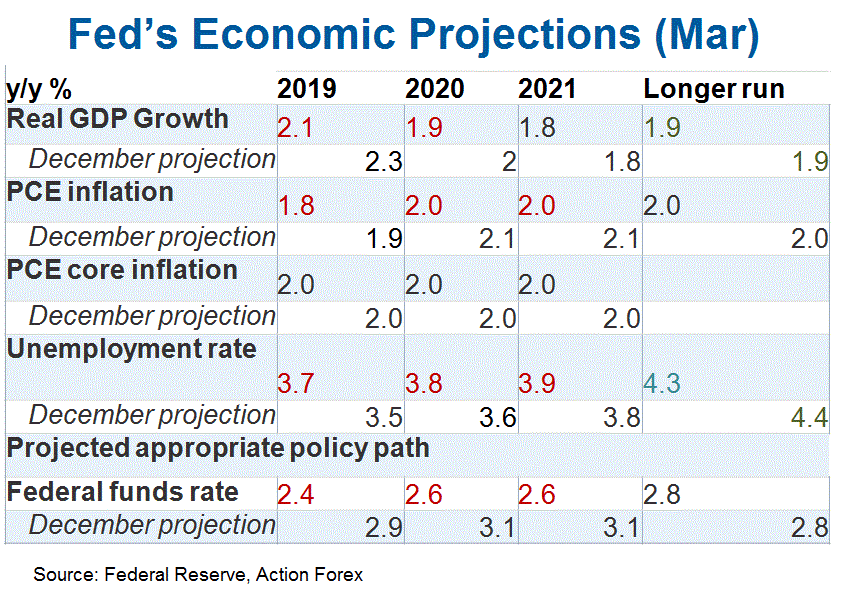
As noted in the accompanying statement, the inter-meeting economic data showed that “the labor market remains strong but that growth of economic activity has slowed from its solid rate in the fourth quarter. Payroll employment was little changed in February, but job gains have been solid, on average, in recent months, and the unemployment rate has remained low”. In January, the members judged that the “labor market has continued to strengthen and that economic activity has been rising at a solid rate”. They added that “job gains have been strong, on average, in recent months, and the unemployment rate has remained low”. On consumption and investment, the members acknowledged that “slower growth of household spending and business fixed investment in the first quarter”. This was compared with the optimism displayed in January: “Household spending has continued to grow strongly, while growth of business fixed investment has moderated from its rapid pace earlier last year”. On inflation, the members this month acknowledged the moderation in headline inflation due to “lower energy prices”. The downgrades in economic assessment were reflected in the updated projections:
Median Dot Plots
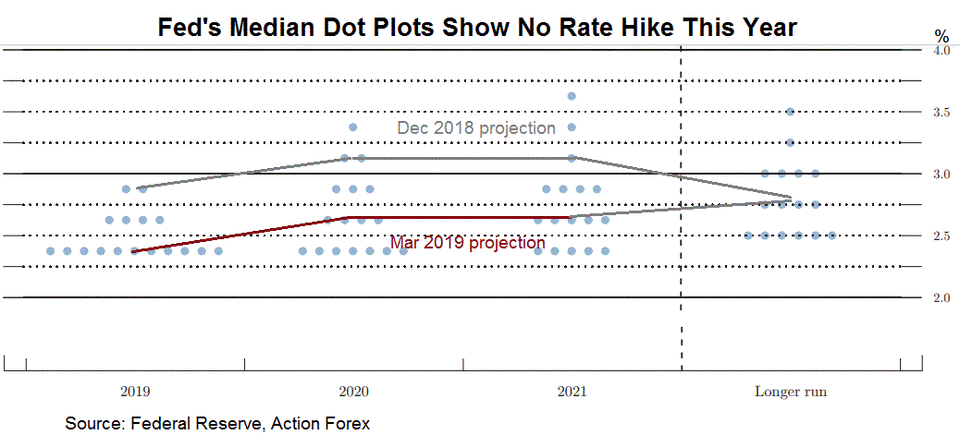
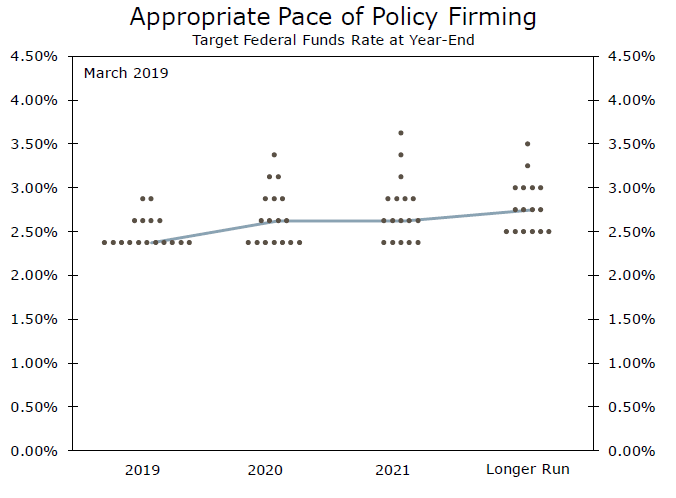
The quarterly median dot plots show that the majority of members (11 out of 17) expect the median policy rate to stay at 2.375% (i.e. no rate hike) this year, compared with 2.875% in December. For 2020, the members forecast the median policy rate to rise to 2.625% (one rate hike). Although the members retained the view of having one rate hike in 2020, their projected level of interest rate is actually lower than December’s estimate of 3.125%.
Balance Sheet Reduction
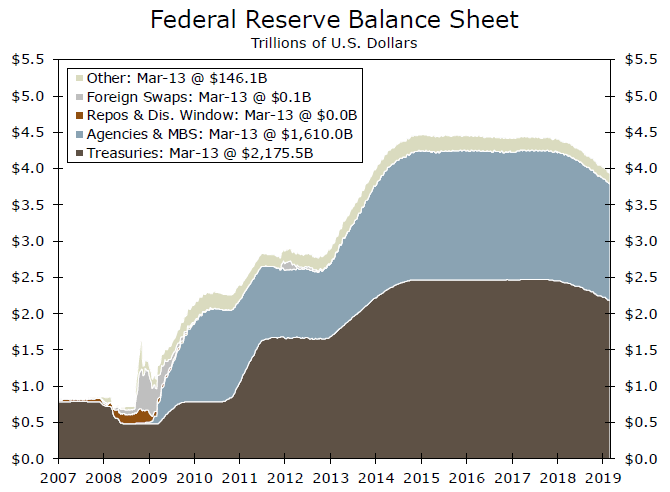
There is an abrupt change in Fed’s balance sheet reduction plan. From May to September, the Fed would cut the size of Treasury securities reduction by half, to US$15B/ month, while the size of mortgage-backed securities (MBS) reduction stays unchanged at US$ 20B/ month. From October onward, the Fed would stop reducing its Treasury position. Rather it would take up to US$20B/ month in maturing mortgage securities and roll them into Treasury debts.
UK May to work night and day to secure support for her Brexit deal again
UK Prime Minister Theresa May said at her Downing Street residence that the Brexit delay is "a matter of great personal regret". She added "I passionately hope that (MPs) will find a way to back the deal I have negotiated with the EU, a deal that delivers on the referendum and is the very best deal negotiable, and I will continue to work night and day to secure the support" for the deal. Though, she emphasized she's not preferred t delay Brexit any further than June 30.
European Council President Donald Tusk offered to approve Article 50 extension. But that would be "conditional on a positive vote on the withdrawal agreement in the House of Commons." If his proposal is approved by all other 27 EU members, and there is a positive vote in the House of Commons next week, the EU can "finalize and formalize the decision on extension in the written procedure". Tusk is ready to call for another EU summit next week if needed.
This position is rather unified in the EU as officials repeated emphasized that there much be a purpose for the extension, be it until May 23 or June 30. But then, the question remains on whether May could secure enough support for her deal. It remains a developing story.
Daily Markets Broadcast
Wall Street slides despite extra-dovish Fed
The knee-jerk reaction to a more dovish outlook from the Fed was for Wall Street indices to rally, but that proved fleeting and indices closed lower yesterday. Trump said China tariffs will stay until a trade deal is in place. Australia’s unemployment rate drops to a near-eight year low.
US30USD Daily Chart
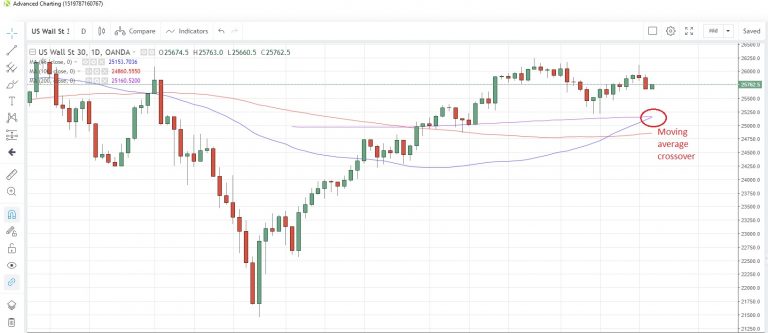
The US30 index closed lower for a second straight day yesterday as the Fed said there were no plans for further rate hikes this year and that its balance sheet run-off would end in September
The 55-day moving average at 25,153 is about to cross above the 200-day moving average at 25,160, having moved above the 100-day moving average on March 13
Having downgraded its growth, unemployment and inflation forecasts, the Fed sees no need to move rates to what it called a “restrictive” level. The “dot plot” last December had looked for two rates hikes this year.
DE30EUR Daily Chart
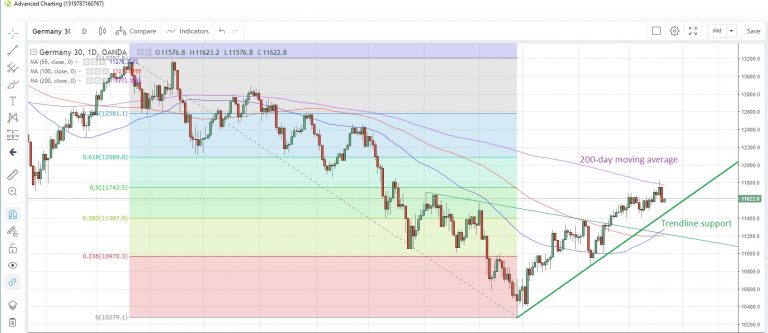
The Germany30 index fell the most since February 7 yesterday on disappointing corporate results/announcements and early weakness on Wall Street
The index failed to close above the 200-day moving average at 11,773. Rising trendline support has shifted to near 11,455
EU leaders start a two-day summit. EU says it will not ask UK for a 2nd Brexit referendum but have yet to receive PM May’s Brexit letter or received a request for any extension of Article 50.
AU200AUD Daily Chart
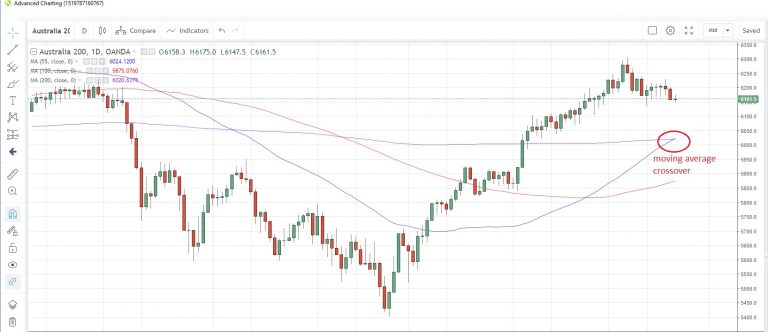
The Australia200 index is edging lower this morning amid a drop in the unemployment rate but with a smaller number of jobs added in February
The 55-day moving average at 6,024 is above the 200-day moving average at 6,020 for the first time since November 7
Australia’s unemployment rate hit 4.9% in February, below forecasts and the lowest since May 2011. The economy added a net 4.6k jobs in the month but lost 7.3k full-time ones.
A Not So Bad Look, NZ GDP, December Quarter 2018
- GDP rose by 0.6% in the December quarter, a stronger rebound than we expected after a weak 0.3% rise in September.
- Household spending and construction were highlights for the quarter, while personal and business services were mixed. Energy sector disruptions were a temporary drag on growth.
- Today’s results give us more comfort around our view that growth will regain some momentum over 2019.
- Growth was a little below the Reserve Bank’s forecast, but not enough to warrant a change of tone in next week’s OCR review.
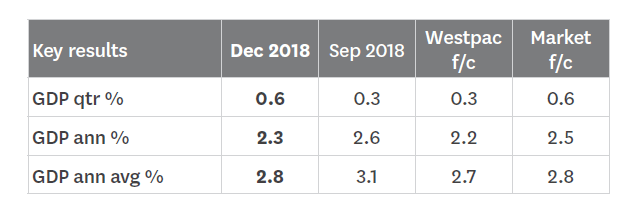
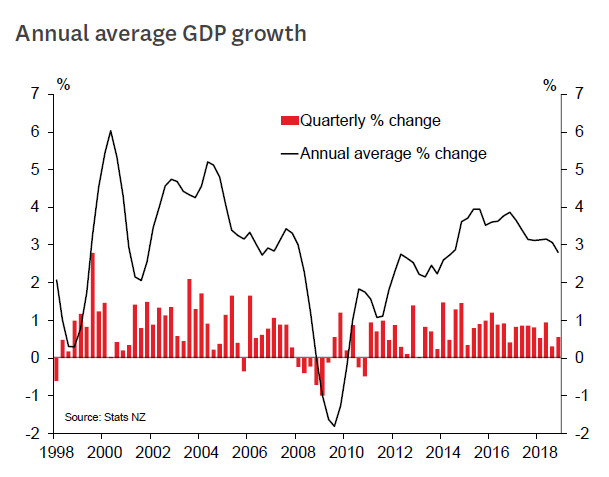
New Zealand’s GDP rose by 0.6% in the December quarter, a result that was stronger than we expected but was in line with market forecasts. Growth for the year as a whole slowed to 2.8%, slipping below the 3% mark for the first time since September 2014.
Today’s GDP figures come as something of a relief. It’s clear that the economy lost some momentum over the second half of last year – just not as much as we thought, and in particular the weak 0.3% gain in the September quarter looks to have understated the true picture. That gives us a bit more comfort about our view that the pace of growth will pick up again in 2019, with support from government spending, construction, and rising household incomes.
The results also provide some food for thought ahead of next Wednesday’s Reserve Bank OCR review. Previously we’d said that the RBNZ was ‘preloaded’ for a dovish shift in its language in March, given the downside risks that were already apparent at the February Monetary Policy Statement. But that’s no longer shaping up to be the case. GDP was only modestly below the RBNZ’s forecast of 0.8%, and other recent developments – softer house prices, stronger commodity prices – have been more balanced. It seems more likely now that the RBNZ will hold its line in next week’s statement.
The GDP figures are even more of a challenge to financial markets, which have gone beyond anticipating a change of tone from the RBNZ and have been pricing in the possibility of OCR cuts over the next year. There certainly has been a dovish shift among central banks around the world in recent months. But ultimately the RBNZ sets monetary policy based on local conditions, not what the rest of the pack is doing. There just isn’t a strong case for interest rate cuts in an economy that is trundling along at about its potential.
Details
The production measure of GDP rose by 0.6%, following a 0.3% increase in the September quarter. There were some minor revisions to previous quarters, which affected the annual growth rate a little but made no real difference to the level of GDP.
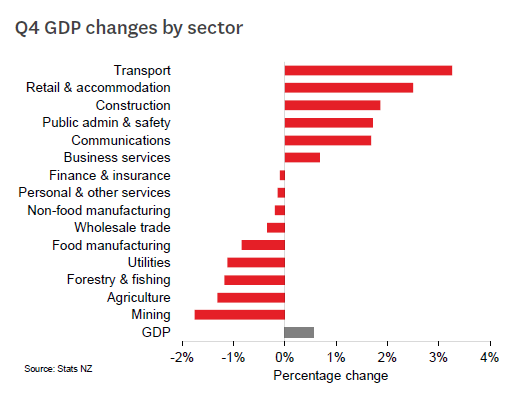
As expected, strong gains in retail spending (up 2.5%) and construction (up 1.8%) were among the highlights for the quarter. Government services (up 1.8%) and healthcare (up 0.9%) also made solid contributions.
Relative to our forecast, the main surprise was a strong rebound in transport (up 3.2%) and communications (up 1.6%). Both of these sectors were surprisingly soft in the September quarter, and we expected some rebound this time – it just proved to be even larger than we anticipated.
On the weaker side, the disruptions in the energy sector over the quarter were apparent. Supply disruptions from the Pohokura gas field weighed on mining, chemical manufacturing and electricity generation. The latter was also affected by low hydro lake levels during the quarter. These disruptions will eventually disappear, although the Pohokura field saw a further maintenance shutdown during the March quarter.
Growth in the service sectors was mixed. As mentioned above, retail, transport and healthcare saw strong gains. But there were declines in finance, wholesaling, recreation and personal services. Real estate services recorded strong growth in both of the last two quarters, though that seems out of step with house sales which were broadly flat over that time.
The expenditure measure of GDP rose by 0.5%. While this measure is considered less reliable on a quarterly basis, it perhaps sheds more light on the nature of the slowdown in growth over the second half of last year.
Household spending has continued to grow at a robust pace, supported by Government transfers from the Families Package and rising household incomes. Spending was boosted further by the easing in petrol prices during the December quarter. Construction activity grew modestly, though it’s likely that capacity constraints have been an ongoing factor.
In contrast, the slowdown has largely been a business-led one. Investment in capital equipment rose strongly over 2017, but more or less flatlined over 2018. This may be a delayed reflection of low business confidence after the change of government in late 2017; if so, we don’t expect it to be a lasting drag on activity.
The growth slowdown also partly reflects the fact that government consumption hasn’t stepped up in the way that we would have expected, given the fiscal projections. We still expect spending to ramp up as planned, and that plays an important role in our forecasts of GDP growth for the next couple of years.
Australian Employment: A February Pause Before We See a New Direction in 2019
February Labour Force Survey: Total employment: 4.6k from 38.3k (revised from 39.1k), unemployment rate: 4.9% from 5.0% (unrevised 5.0%), participation rate: 65.6% from 65.7% (unrevised 65.7%).
Employment growth slowed in February lifting 4.6k less than what the market was looking for (median +15k) but a touch better than Westpac's forecast of –5k. So far 2019 has had a sound start for the labour market with a three month average gain of 21.1k/per month. Through 2018 total employment grew 274.5k, or 2.2%yr, with a solid momentum into year end with a six month annualised pace of 2.3%yr. While it is just second month into the year, employment grew 284k in the year to February (2.3%yr) but the six month annualised pace has moderated from 2.9%yr in January to 2.3%yr in February.
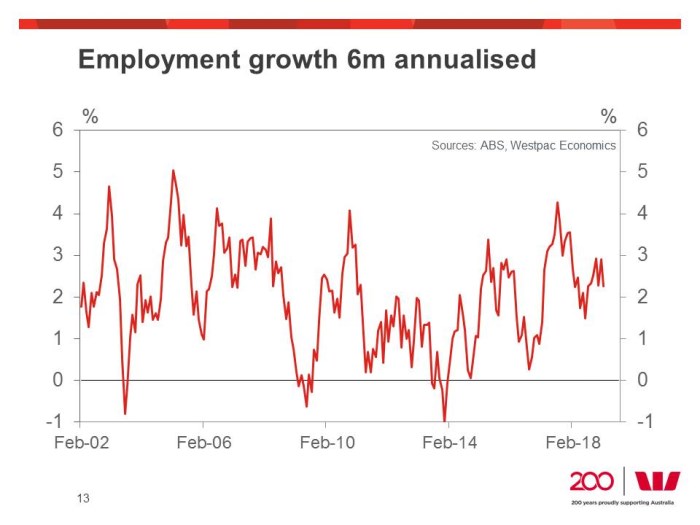
As highlighted in our preview we are very cautious about making too much of the January/February releases given the large underlying seasonality in these months. However, what we can say is that it does appear that the momentum in employment has slowed. As such, there is nothing in this release to make us change our view that employment growth will take a breather through the first half of 2019 leading to a lift in unemployment. But, to be fair, the fall in the unemployment rate to 4.9% also means that at this point in time, the RBA will also feel little pressure to change their forecast for the unemployment rate to fall to 4¾%. It will all come down to who is the better forecaster.
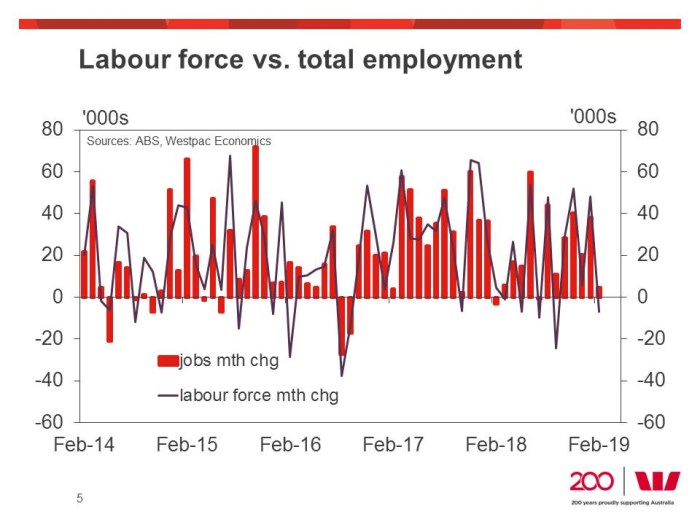
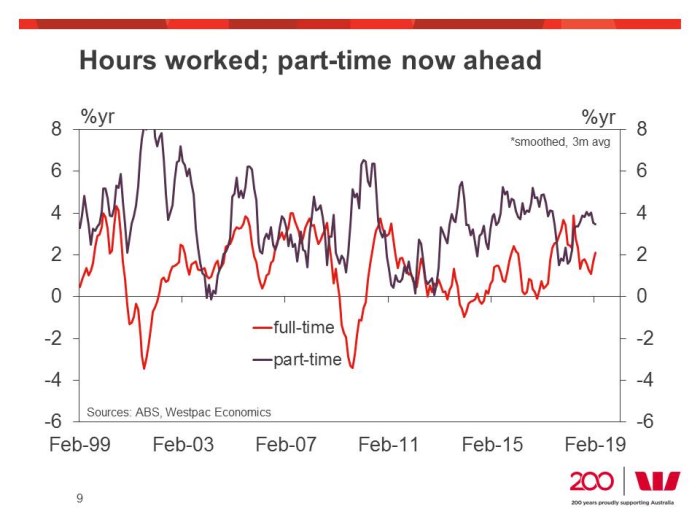
In February, in reverse to the January result, the mix of employment gains painted a soft picture with a 7.3k loss in full-time employment offset by an 11.9k gain in part-time employment. However, hours worked was a bit more upbeat in the month with total hours worked up 0.2% (total employment was flat in the month) as hours worked per person gained 0.1% due to average hours worked rising for both full-time and part-time employees. In the year to February total hours worked has lifted 2.2%yr which is on par with the 2.3%yr pace for employment.
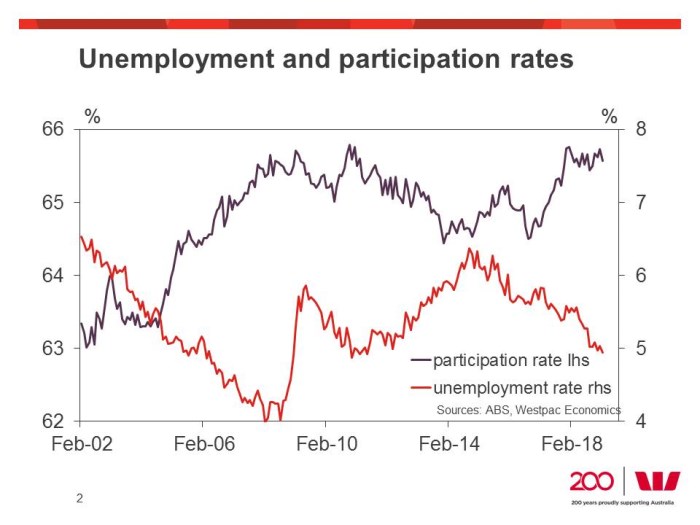
Despite the soft print on employment, the unemployment rate fell to 4.9% (market median was 5.0%) as a 0.1ppt decline in the participation rate to 65.6% (65.57% at two decimal places) resulted in a –7.1k decline in the labour force. At this stage it appears that both male and female participation is levelling out in a trend sense and we are closely watching where they go next. We do expect both to edge lower though 2019 H1 as employment growth stalls.
February was a soft month for employment growth across the states. Employment fell 5.8k in NSW (+128.9k in the year) and the unemployment rate lifted to 4.3% from 3.9% which was a 30 year low in unemployment for that state. In Victoria, employment lifted 5.7k (+136.7k in the year) but with a lift in participation, the unemployment rate lifted to 4.8% from 4.6%. Queensland employment lifted in February 6.4k (+20.4k in the year) but a decline in participation saw the unemployment rate dip to 5.4% from 6.1%. In WA employment rose 2.8k (+7.7k in the year) with the 1ppt fall in unemployment to 5.9% being supported by a 0.6ppt fall in participation. Meanwhile in SA a lift in employment 3.8k (–0.1k in the year) in February saw the unemployment rate ease back 0.6ppt to 5.7%.
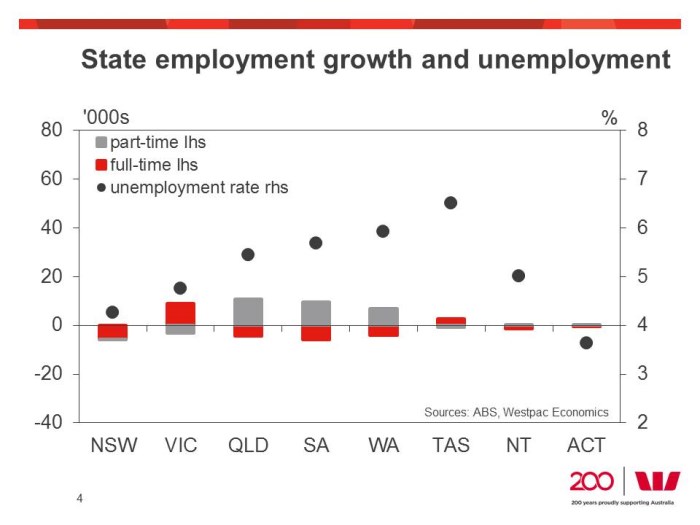
Overall, while the annual pace of employment growth has picked up in Victoria, and eased back in NSW, NSW can still claim the mantle of having the lowest unemployment rate.
Victoria was the state showing the greatest improvement through 2018 with the unemployment rate down 2ppts to 4.2% in December while in NSW unemployment fell just 0.5ppts to 4.3%.
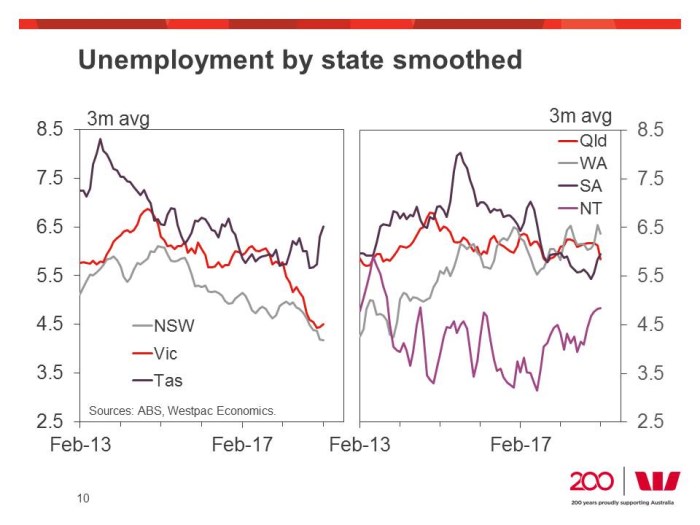
We are closely watching how these trends continue through 2019 – NSW did surprise in January by dipping below 4%, but it has since bounced back to 4.3%, while Victoria's improvement does look to be cooling with the unemployment rate holding above 4.5%. It is these two states, and how their labour markets will respond to falling house prices, a contraction in construction activity and weak retail sales, that is behind our expectation for the unemployment rate to rise through the first half of this year. While we are cautious about interpreting too much from the January/February releases, we see nothing in them that makes us nervous about our forecasts.
It is also worth noting that in 2018, for all the strength in the labour market, the underemployment rate only declined 0.2ppt. So far there has been a further improvement with the rate falling from 8.3% in December to 8.1% in February. Again, we would caution that so far we have only see the January and February prints, so would not project that this improvement can be sustained, but nevertheless, it is another indicator of just how robust the labour market was at the end of 2018.
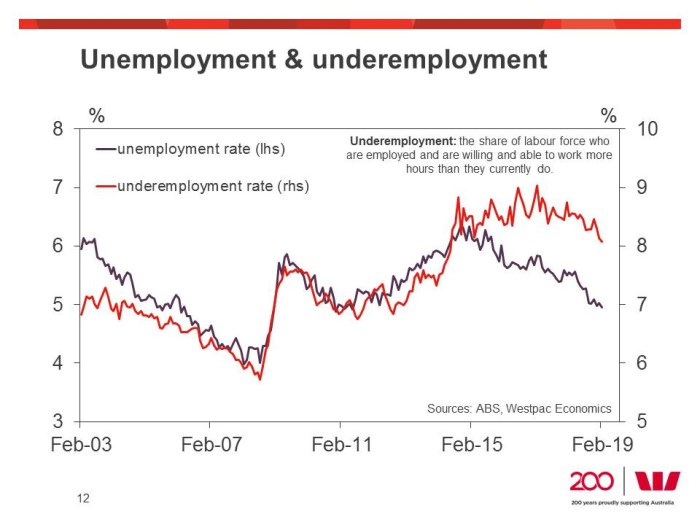
For 2019, we are looking for a pause in the pace in employment growth due to the economic uncertainties surrounding the Federal Election at the same time as we expect to see a moderation in momentum in NSW and Victoria on the back of a moderation in housing activity. With reasonable estimates for the participation rate, our weaker jobs growth profile has the unemployment rate lifting to 5.5% in the second half of 2019 and further by end 2020.
FOMC Thinks It Will Be On Hold Throughout 2019
As widely expected, the FOMC kept rates on hold today, but it now thinks that it will not need to tighten any further this year
Rates Remain Unchanged But…
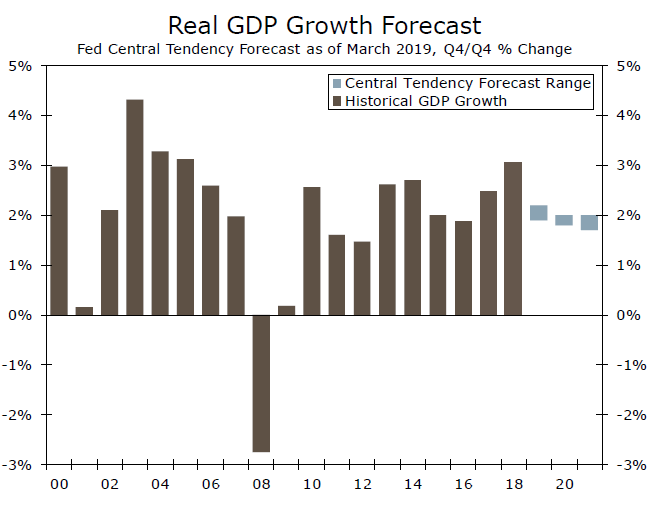
As universally expected, the Federal Open Market Committee (FOMC) voted unanimously today to keep the range for the fed funds rate between 2.25% and 2.50%. That said, today’s announcement was not without consequence. For starters, the committee downgraded its assessment of the economy, saying that “growth of economic activity has slowed from its solid rate in the fourth quarter.” More formally, the median FOMC member now forecasts that real GDP will grow 2.1% in 2019 (top chart), which is down from the 2.3% rate that the median projected in December (the last time the forecast was made public). The median GDP forecast for 2020 has edged down to 1.9% from 2.0% previously. The FOMC also trimmed its PCE inflation forecast for 2019 and 2020, and it now does not see unemployment receding much further from its current rate of 3.8%. (In December, the median forecaster looked for the unemployment rate to decline to 3.5% in 2019.)
Given this more sober forecast, the FOMC scaled back the amount of tightening that it believes will be necessary. In December, the median FOMC forecaster projected 50 bps of tightening in 2019 and another 25 bps rate hike in 2020. The median forecaster now believes that the FOMC will be on hold for the rest of 2019 (middle chart). The median forecast of one 25 bps rate hike next year remains in the forecast, but 7 of the 17 FOMC members think that rates will be on hold next year as well. In other words, the forecast of a rate hike next year is a close call.
Furthermore, the committee made some decisions regarding its balance sheet (bottom chart). At present, the Fed is allowing a maximum of $30 billion of Treasury securities to roll off its balance sheet every month. Starting in May, the maximum amount of Treasury securities that will be allowed to roll off will be reduced to $15 billion per month. Starting in October the overall size of the balance sheet will remain unchanged, for an unspecified period of time. The Fed, however, will continue to allow a maximum amount of $20 billion of mortgage-backed securities (MBS) to roll off the balance sheet every month, to be replaced by Treasury securities. As we have been writing for some time, the Fed’s balance sheet will be elevated for the foreseeable future, and it will continue to hold trillions of dollars of Treasury securities.
Our most recent forecast, which was compiled earlier this month, looks for the Fed to hike rates 25 bps later this year. We then looked for the FOMC to remain on hold until the end of 2020, when we forecasted that it would cut rates 25 bps. Although another rate hike in 2019 is still possible, the FOMC’s announcement today means that the risk to our current forecast is skewed to the downside. We will continue to monitor incoming data to determine whether we need to adjust our forecast for the fed funds rate
Northern Exposure: FOMC in a Good Place
Downwardly revised forecasts point to the FOMC remaining on hold in coming months. One more hike is still expected.
In 2019 to date, the FOMC have been cautious on the economic outlook and the need for any further tightening of policy – a stark contrast to the optimistic view put forward at the December 2018 meeting, and the Committee’s expectation then of 3 further hikes.
At their March 2019 meeting, the Committee formally confirmed this shift in stance, with downward revisions to their forecasts for the US’ real economy and their federal funds rate profile. Chair Powell also announced that balance sheet reduction would slow from May and end in September 2019.
Beginning first with the real economy, the decision statement presented a more downbeat view on both the labour market and the activity pulse.
While the labour market is still characterised as “strong” overall, employment growth is now described as only “solid”. The forward view provided in the accompanying Committee forecasts points to only a short-term (very marginal) decline in the unemployment rate hence, with the end-19 through end-21 forecasts respectively 3.7%; 3.8%; and 3.9% compared to its February 2019 level of 3.8%. This implies that the Committee believe employment growth will slow further through 2019, to a month-average nonfarm payrolls pace closer to 100k than the 200k average of recent years.
Coincident to the softening of the labour market is a modest downtrend in activity growth. “Recent indicators point to slower growth [in] household spending and business fixed investment”, with “growth of economic activity... slow[ing] from its solid rate in the fourth quarter”. The Committee’s forecasts make clear that this trend is set to continue, with growth of 2.1% seen in 2019 followed by 1.9% and 1.8% in 2020 and 2021 respectively – the latter outcomes broadly in line with trend or potential growth.
On the back of softer activity growth and a decelerating labour market, headline and core inflation is now seen at or below 2.0%yr over the forecast period.
Given the above domestic views, lingering global risks and with the federal funds rate “now in the broad range of estimates of neutral”, Chair Powell highlighted very clearly in the press conference that he and his colleagues “think that this setting is well-suited to the current outlook, and believe that we should be patient in assessing the need for any change in the stance of policy”.
To that end, the Committee’s projected policy path sees no hikes in 2019 (the view of 11 of 17 Committee members), and only one more hike to a mid-point of 2.625% in 2020.
While the Committee’s longer-run view on the federal funds rate is a touch higher at 2.75%, this is best regarded as being consistent with one further hike (2.75% being the upper bound of the 2.50–2.75% range that gives the 2.625% mid-point).
Marrying the growth and interest rate forecasts presented by the Committee, it is apparent that, to their mind, the risks to the one-more hike view are skewed to the downside. At the same time that the Committee is forecasting the last hike, activity growth is expected to be slowing to trend and the unemployment rate edging higher. These are not circumstances that typically warrant a hike – particularly with little-to-no inflation risk.
Support for this idea can also be found in the dot plot. In 2020 and 2021, 7 and 5 Committee members respectively believe that the federal funds rate will be unchanged – up from just 1 member at the time of the December meeting. While it is clear that the Committee believe external risks will subside from 2020 on, this is not a given. Further, US’ fiscal risks could grow into year end, as the extraordinary stimulus of 2018 comes to an end, and Congress has to decide on the appropriate level of spending from then on.
Our growth and inflation forecasts are broadly in line with those of the Committee at March 2019. And we have regularly highlighted the risks to both consumption and investment from higher interest rates and global uncertainties. However, to our mind, there is still the potential for accelerating wages growth to offset these negatives, with potential consequences for inflation.
As a result, we continue to forecast 1 more hike, most likely in December 2019, after which rates will remain on hold. We will continue to assess momentum and the Committee’s tone hence.
Fed Keeps Rates Steady as the Dots Fall
As broadly expected, the Federal Open Market Committee (FOMC) unanimously decided to maintain the target range for the federal funds rate at 2.25-2.50%.
FOMC officials downgraded their assessment of current economic conditions. They characterized the labor market as strong, but that the growth of economic activity has "slowed from its solid rate in the fourth quarter". Also that household spending and business investment has slowed in the first quarter.
Assessment on future policy changes remained unchanged from January. The Committee "will be patient as it determines what future adjustments to the target range may be appropriate".
FOMC members' expectations for rate hikes, or rather no hikes, shifted lower from December. The majority (and median) of FOMC members (11 of 17) do not expect to raise rates in 2019, down from a median expectation of two hikes in December. For 2020, the median expectation is for one hike. That is 50 basis points lower than their December outlook. The longer-run expected level of the fed funds rate is 2.8%, unchanged from December.
- The median projection for real GDP growth was downgraded in 2019 (to 2.1% from 2.3%) and 2020 (1.9% from 2.0%). The expectation for growth over the longer run was unchanged at 1.9%.
- The median unemployment rate forecast was raised two-tenths in 2019 and 2020, and one tenth in 2021. The longer-run estimate of the unemployment rate was also moved down a tick 4.3% (from 4.4%)
- On inflation, the median estimate for core PCE was unchanged at 2.0% through 2021.
The Federal Reserve announced details on adjustments to its $4 tn balance sheet normalization process. The Committee is slowing the runoff of Treasury securities from $30 bn a month to $15 bn, starting in May 2019 and will end the reduction in the System Open Market Account at the end of September 2019. The Federal Reserve is attempting to determine the appropriate level of reserves necessary to maintain efficient and effective monetary policy. With the effective fed funds rate pushed right up against the upper bound of IOER, it is assumed that demand for reserves by banks is nearing the steep part of the demand curve. To ensure the effective rate falls in the range desired by the Federal Reserve, it is slowing the reduction of reserves in order to determine this appropriate level.
Key Implications
Given Fed communications, a stand-pat decision today was a done deal, but markets were holding their breath for the Fed's latest dot plot, and it didn't disappoint. The majority of FOMC members do not expect to raise rates in 2019, 50 basis points lower than in December. Further out the median expectation is for one hike in 2020, and another at some point between 2021 and the "longer run", where the rate expectation is unchanged at 2.8%
Given the shift in the Fed's stance from a hiking bias to patience since December, there was little doubt the dot plot would shift lower versus December, the question was by how much. The answer is pretty clear, given a muted inflation backdrop and global economic and financial developments, the Fed expects this period of patience will last into next year. Treasuries have rallied since the statement. The FOMC median expectation for the path of the fed funds rate is now closer to our own forecast. We await the press conference to get more color from Chair Powell on the thinking behind the downgrade in view and the length of the policy pause.
Huge Decline in US Crude Oil Inventory Supports Prices
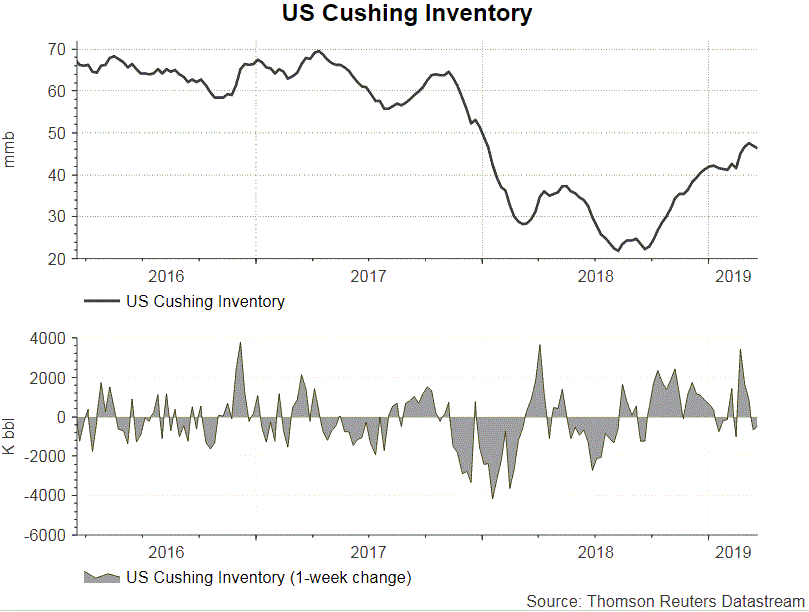
The report from the US Energy Information Administration (EIA) shows that total crude oil and petroleum products (ex. SPR) stocks declined 12.64 mmb to 1221.85 mmb in the week ended March 15. Crude oil inventory plunged -9.59 mmb to 439.48 mmb (consensus: +0.31 mmb). Inventories declined in 2 out of 5 PADDs with PADD 3 (Gulf Coast) seen remarkable -8.62 mmb withdrawal. Meanwhile, Cushing stock dropped -0.47 mmb to 46.38 mmb. Utilization rate gained +1.3% to 88.9% while crude production climbed +0.1 mmb higher to 12.1M bpd for the week. Crude oil imports increased +0.19M bpd to 6.93M bpd in the prior week. The front-month WTI crude oil contract extended recent gains to the highest level since November 12, 2018.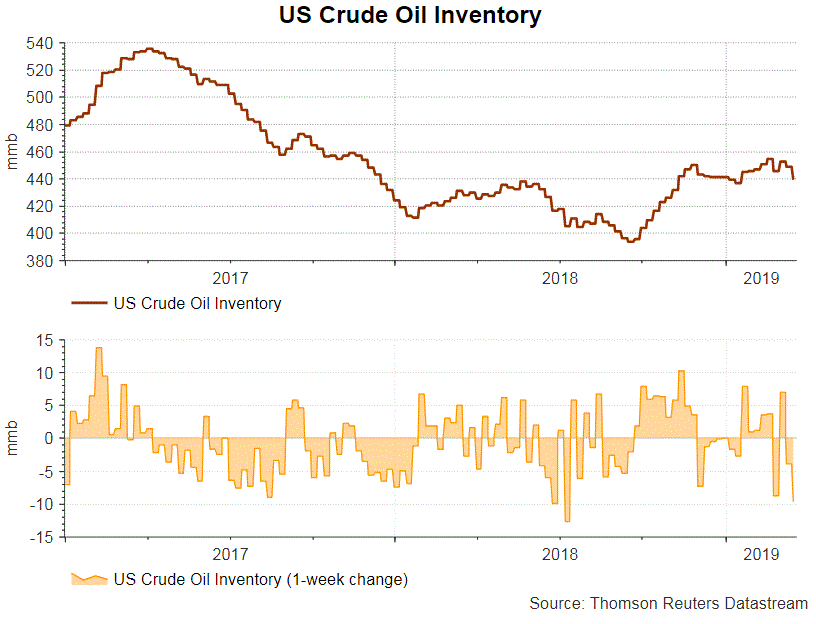
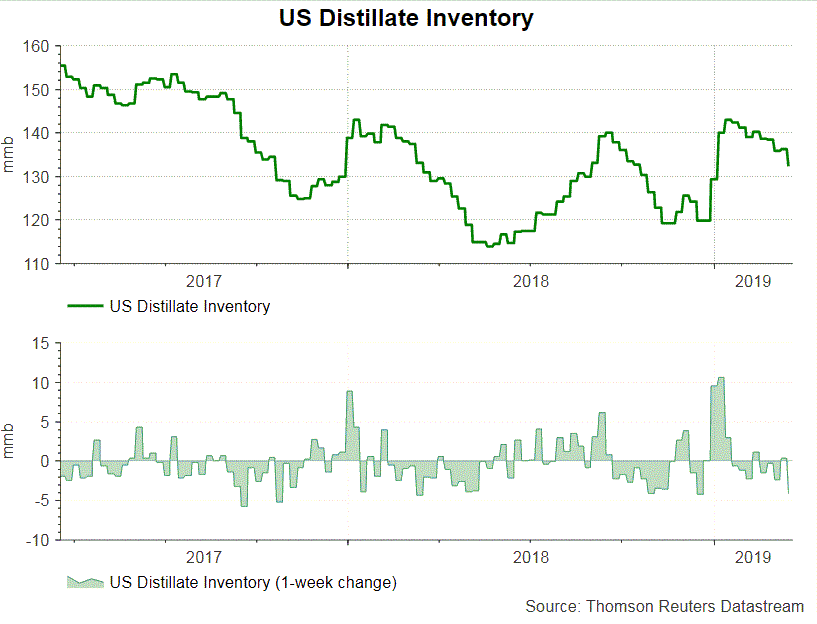
 Concerning refined oil product inventories, gasoline inventory declined -4.59 mmb to 241.5 mmb as demand added +2.94% to 9.41M bpd. The market had anticipated a -2.41 mmb drop in stockpile. Production slid -1.27% to 9.93 bpd while imports soared +38.39% to 0.79M bpd during the week. Distillate inventory fell -4.13 mmb to 132.24 mmb. Demand rose +19.05% to 4.71M bpd. The market had anticipated a -1.09 mmb decline in inventory. Imports slumped -57.14% to 0.1M bpd while production added +1.38% to 4.92M bpd during the week.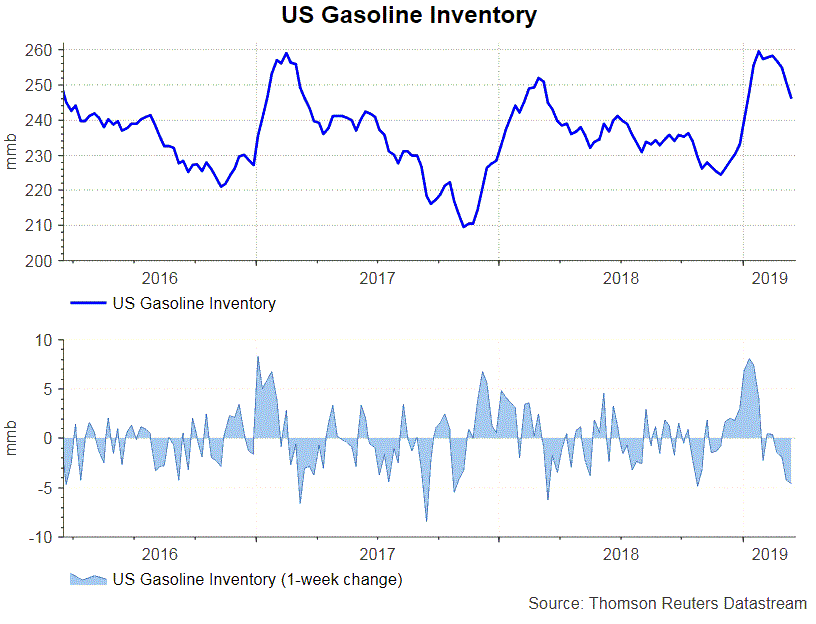
 Released after market close on Wednesday, the industry- sponsored API estimated that crude oil inventory declined -2.13 mmb during the week. For refined oil products, gasoline stockpile drew -2.79 mmb while distillate decreased -1.61 mmb.
USD/CHF Tumbles Below Key Supports
Key Highlights
- The US Dollar topped at 1.0124 and declined below 1.0000 against the Swiss Franc.
- USD/CHF traded below a key bullish trend line with support at 1.0045 on the 4-hours chart.
- The Federal Reserve made no change in interest rates from 2.5%.
- The US Initial Jobless Claims for the week ending March 16, 2019 will be released today, which could decline from 229K to 225K.
USDCHF Technical Analysis
This past week, the US Dollar climbed above 1.0100 resistance area against the Swiss Franc. The USD/CHF pair failed to break the 1.0125 level and later started a strong downward move.
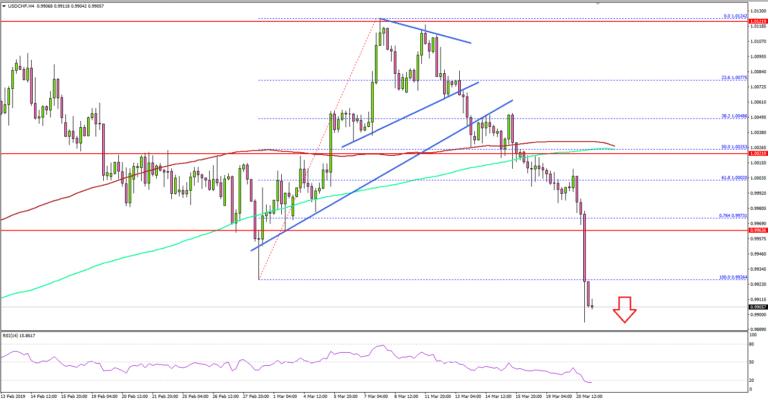
Looking at the 4-hours chart, the pair topped at 1.0124 and later declined below the 1.0080 and 1.0050 support levels. The recent decline was strong as the pair broke the 61.8% Fib retracement level of the last wave from the 0.9926 low to 1.0124 high.
There was a break below a key bullish trend line with support at 1.0045. Besides, the pair declined below the 1.0000 support, the 200 simple moving average (green, 4-hours), and 100 simple moving average (red, 4-hours).
Clearly, the pair is trading in a bearish zone and it broke a few important supports near 0.9950. If sellers clear the 0.9900 support level, there is a risk of an extended drop towards 0.9880 or 0.9865.
On the upside, the previous support near 0.9980 and the 100 SMA are likely to act as hurdles if the pair starts a recovery from the current levels.
Looking at the other major pairs, EUR/USD extended gains above the 1.1320 level and GBP/USD seems to be facing a strong resistance near the 1.3300 zone.
Economic Releases to Watch Today
- UK Retail Sales for Feb 2019 (YoY) – Forecast +3.3%, versus +4.2% previous.
- UK Retail Sales for Feb 2019 (MoM) – Forecast -0.4%, versus +1.2% previous.
- BoE Interest Rate Decision – Forecast 0.75%, versus 0.75% previous.
- US Initial Jobless Claims – Forecast 225K, versus 229K previous.