Sample Category Title
EUR/CHF Daily Outlook
Daily Pivots: (S1) 1.1334; (P) 1.1350; (R1) 1.1365; More...
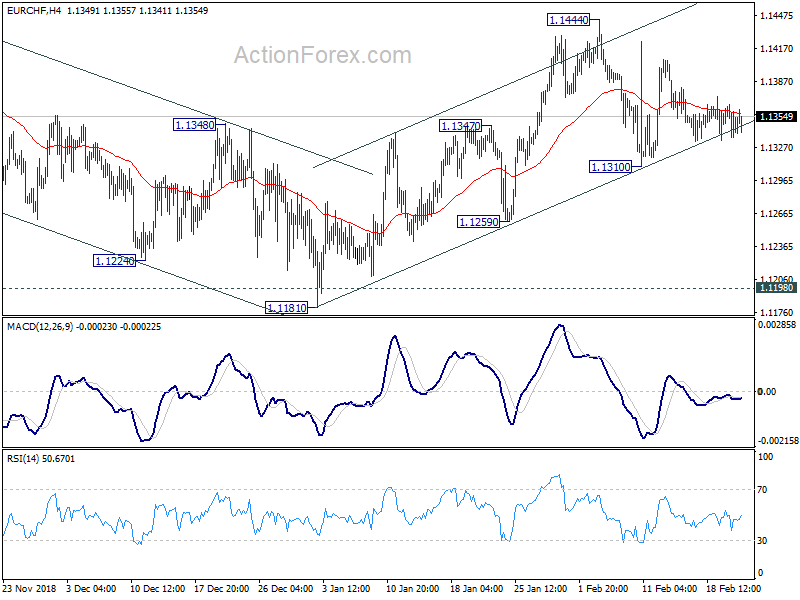
No change in EUR/CHF's outlook as it's still bounded in range of 1.1310/1.1444. Intraday bias remains neutral first. With 1.1310 intact, further rise is in favor. On the upside, break of 1.1444 will resume whole rally from 1.1181 for 1.1501 key resistance next. However, break of 1.1310 will argue that the rebound from 1.1181 might be completed. Intraday bias will be turned back to the downside for 1.1181 low again.
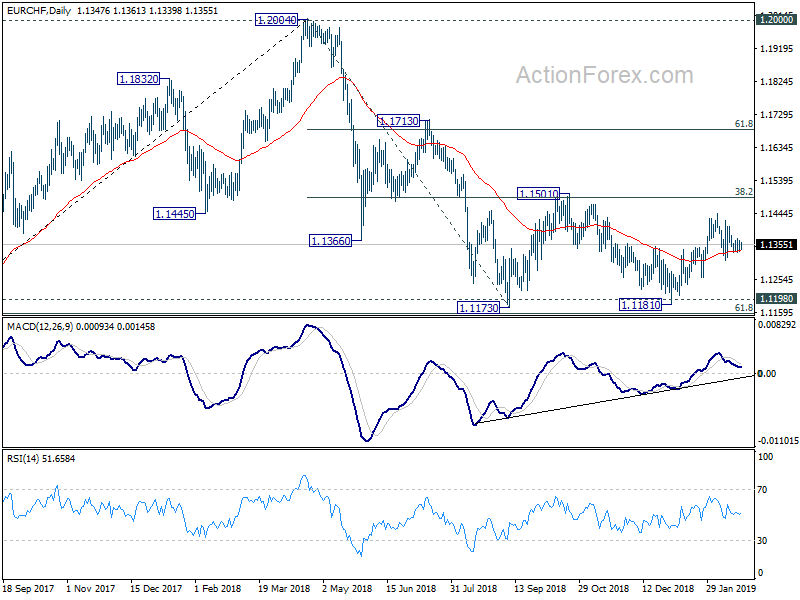
In the bigger picture, price actions from 1.2004 medium term top is seen as a correction only. Downside should be contained by 1.1154/98 support zone to complete it and bring rebound. Decisive break of 1.1501 (38.2% retracement of 1.2004 to 1.1173 at 1.1490) will confirm completion of the correction, on bullish convergence condition in daily MACD. Further rise should be seen to 61.8% retracement at 1.1687 and above next.
Elliott Wave View: DAX Bullish Sequence Favors More Upside
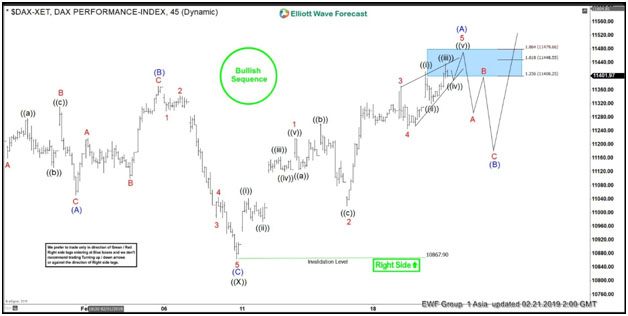
DAX has broken above February 6, 2019 high (11371.74) and shows a bullish sequence from December 28, 2018 low (10279.20). On the chart below, we put a bullish sequence stamp and right side higher to indicate the direction that we prefer to trade. The correction to 10867.9 low ended wave ((X)) as an Expanded Flat Elliott Wave. A Flat is a 3-3-5 structure with ABC label. Decline to 11051.11 ended wave (A), wave (B) bounce ended at 11371.74, and wave (C) of ((X)) ended at 10863.56.
After ending wave ((X)) at 10863.56, the Index has rallied and broken above the previous wave (B) high at 11371.74. This suggests that the next leg higher has likely started. The rally from 10867.9 low is unfolding as an Impulse Elliott Wave structure. Up from 10867.9, wave 1 ended at 11217.3, wave 2 ended at 11018.95, wave 3 ended at 11371.44, and wave 4 ended at 11244.52. Expect DAX to end the 5 waves move with 1 more leg higher at the blue box area of 11400.25 – 11479.66. Afterwards, the Index should pullback in wave (B) in the sequence of 3, 7, or 11 swing to correct the cycle from February 9, 2019 low. As far as the pullback stays above 10867.9, expect the Index to resume higher again. We do not like selling the proposed pullback.
1 hour DAX Elliott Wave chart
NZDUSD Declines Considerably, Negative To Neutral Outlook
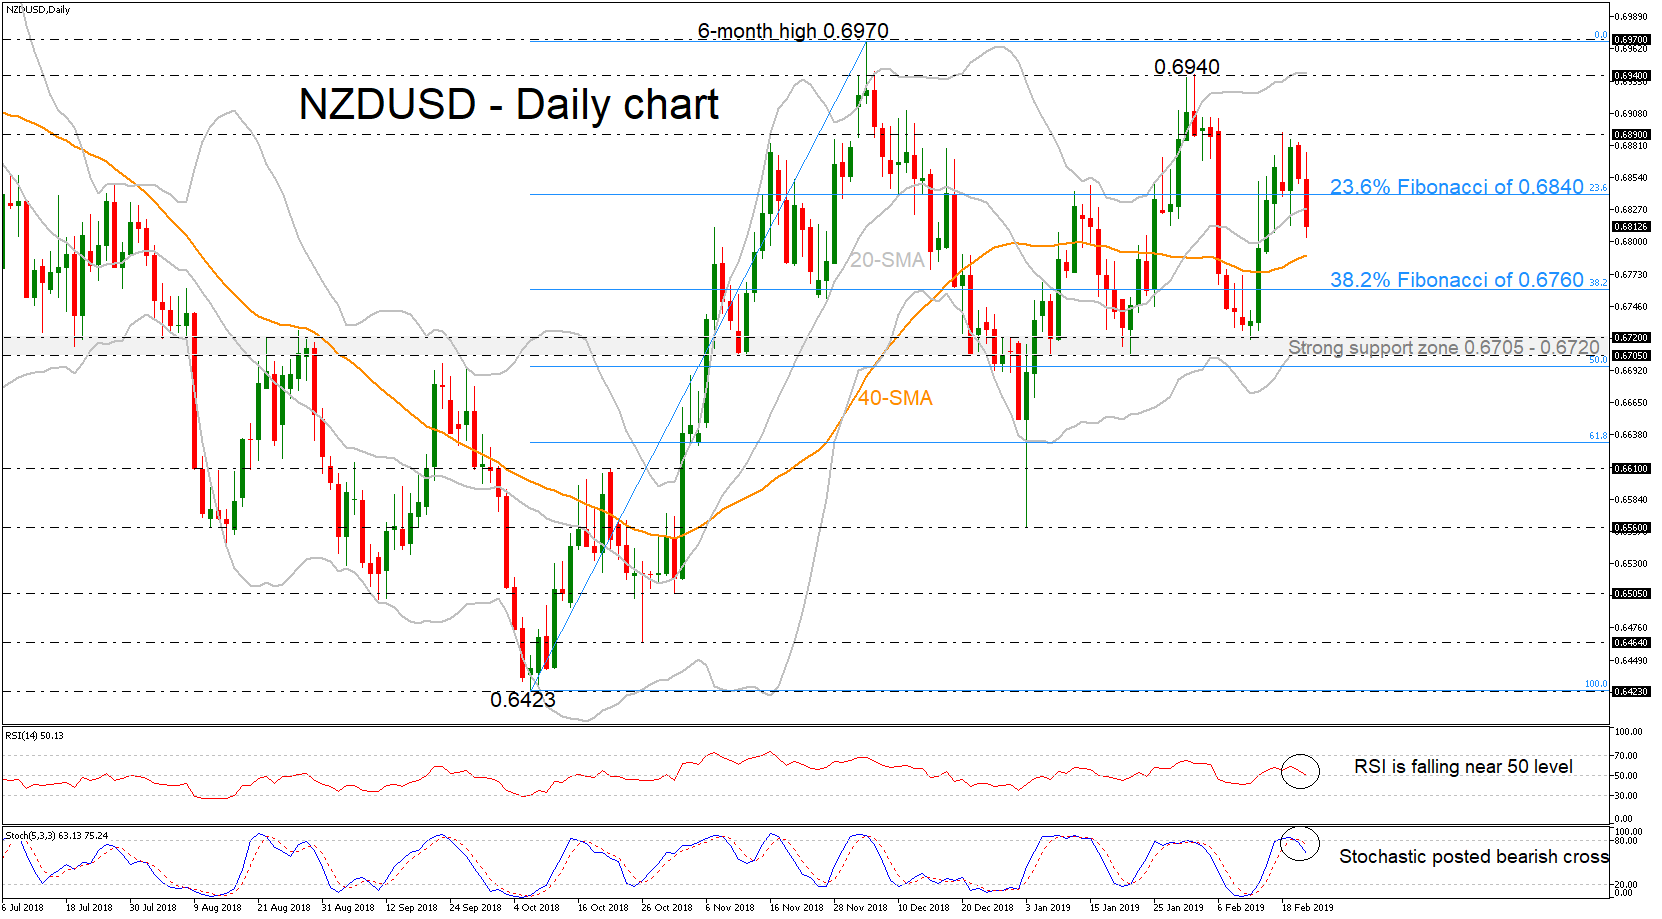
NZDUSD has aggressively reversed back to the downside, dropping below the 23.6% Fibonacci retracement level of the upleg from 0.6423 to 0.6970, around 0.6840, and the mid-level of the Bollinger Band currently at 0.6830.
Momentum indicators are pointing to a negative bias in the short term with the RSI trying to fall below the 50 level and the stochastic oscillator is declining from the overbought area. The stochastics have posted a bearish crossover within the %K and %D lines, suggesting further losses in the market.
More downside pressures would find immediate support level near the 40-day simple moving average (SMA), which holds near 0.6790, before moving even lower until the 38.2% Fibonacci mark of 0.6760. If there is a successful break below this zone, the 0.6705 – 0.6720 support region, could be the next levels for traders to look for, which encapsulates the lower Bollinger Band as well.
Alternatively, in case of an upward move, immediate resistance could come from the 23.6% Fibonacci of 0.6840 and the 0.6890 peak, taken from the latest highs. Should this prove a weak obstacle, the buying interest could pick up speed until the 0.6940 hurdle, which coincides with the upper Bollinger Band in the near term.
In the medium-term picture, the bounce off the six-month high of 0.6970 turned the outlook to a more negative to neutral again. Chances for another bullish move would rise in case of climb above the aforementioned peak.
GBPUSD Weakness Expected Below 1.3000
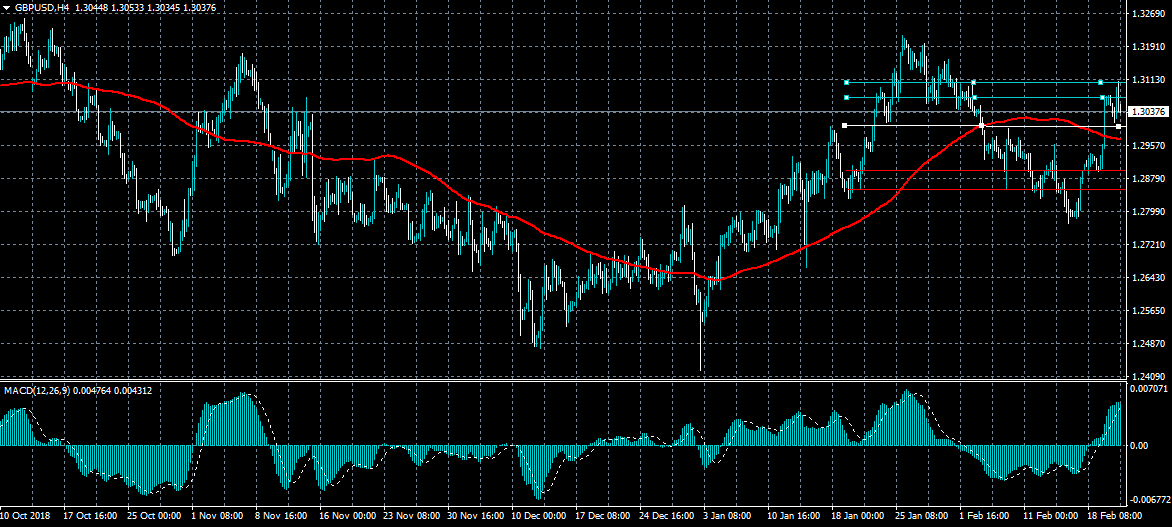
The British pound is starting to lose bullish momentum against the US dollar after the pair failed to hold price above the important 1.3095 resistance level. If sellers move price below the 1.3000 support level, a deeper intraday technical correction towards the 1.2965 level may occur. Technical indicators on the key four-hour time frame are also starting to appear overstretched.
The GBPUSD pair is only bullish while trading above the 1.3000 level, key technical resistance is found at the 1.3095 and 1.3200 levels
If the GBPUSD pair trades below the 1.3000 level, sellers may test towards the 1.2965 and 1.2900 support levels.
EURUSD Trendline Resistance Holds
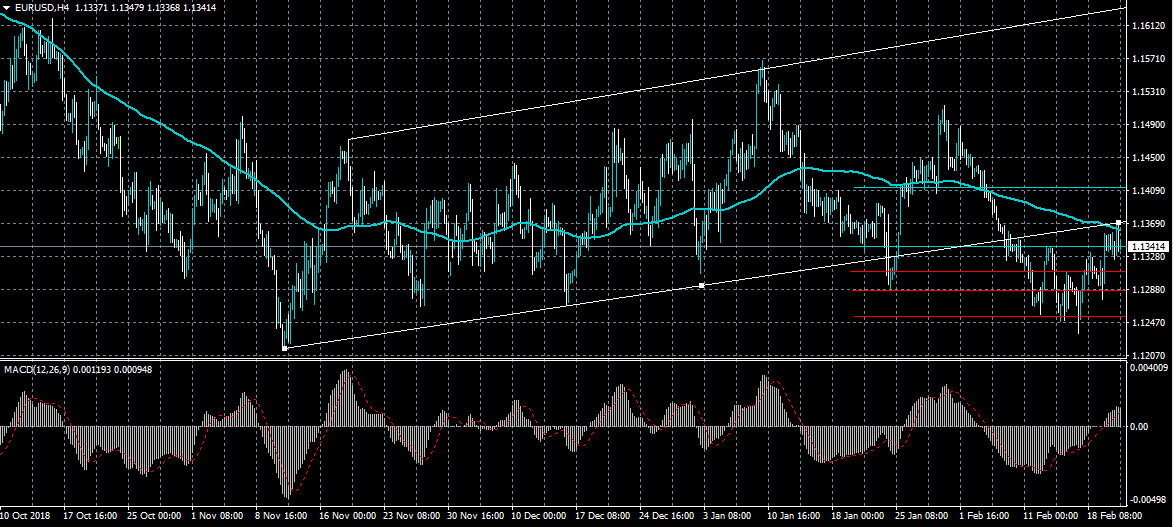
The euro currency is under slight downward pressure against the US dollar on Thursday after the pair was strongly rejected from key trendline resistance, at 1.1370. The EURUSD pair currently has a neutral intraday bias and will only turn bearish once trading below the 1.1337 level. Traders now await the release of key PMI Manufacturing and Services data for the eurozone economy.
If the EURUSD pair falls below the 1.1337 level, sellers may test towards the 1.1300 and 1.1280 support levels.
A breakout above the 1.1370 level may provoke technical buying towards the 1.1410 and 1.1450 resistance levels.
BTCUSD Bullish Breakout Looms
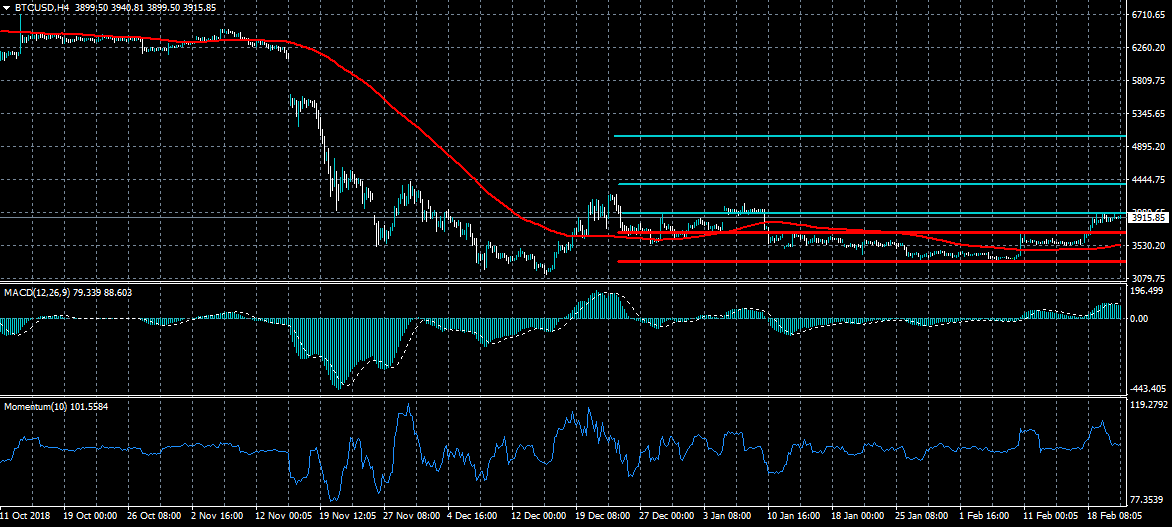
Bitcoin is starting to consolidate recent gains just below the $4,000 level on Thursday, with the BTCUSD pairs price-action becoming increasingly bullish. If buyers can force price above the $4,400 level, a breakout towards the $5,000 level appears likely. Only a sustained loss of the key $3,700 support level can negate the short-term bullish outlook currently surrounding the number one cryptocurrency.
The BTCUSD pair is strongly bullish while trading above the $4,000 level, key technical resistance is found at the $4,400 and $5,000 levels.
If the BTCUSD pair trades below the $3,700 level, key support is found at the $3,450 and $3,330 levels.
Crude Oil Price’s Rally Likely Short-lived. Outlook Dim as Global Growth Slowdown Persists
Crude oil prices rallied, sending the WTI and Brent benchmarks to the highest level since November 2017. Investors shrugged off rising US shale rig counts and higher inventory, but focused on hopes of resolution to US-China trade war. Adding to the optimism was OPEC compliance and ongoing sanctions against Venezuela and Iran. we expect the recent rally to be short-lived. We do not see structural change in the fundamentals of crude oil market to sustain the price strength. Rather, we expect global economic slowdown would drag crude oil demand. On the supply side, while the latest data suggest that OPEC compliance appeared high in January, the actual cut remained below the pledged cut. Meanwhile, US shale production has over the past year replaced OPEC (or Saudi Arabia) as the swing producer that could affect price. US shale investment could ramp up rather rapidly as oil prices increase. Meanwhile, higher exports from the US in coming years would also put a lid on the price.
In summary, OPEC+ did trimmed output in January. Yet, looking into details, the production reduced was not as substantial as news headlines suggested. According to official OPEC report, OPEC-11 produced 26.05M bpd last month, down from 26.73M bpd in December. The compliance level was 85.6%. According to the deal, these members should have lowered output by -0.812M bpd to 25.94M bpd. As such, the actual production in January was indeed higher, by +0.11M bpd, than what is agreed upon. However, OPEC’s data could be subject to exaggeration. If we take a look at Reuter’s estimate, OPEC-11’s output was 26.18M bpd last month, exceeding the target by 0.24M bpd and with a compliance level of 70%. If we use the average of the above two sources and include the data of the ten non-OPEC countries that agreed to reduce output, the overall compliance level was about 61%.
US shale gas boom since 2015 has great improved self-sufficiency of the country’s oil demand. While remaining net importer of crude oil, the amount has declined significantly from above 8M bpd in 2017 to 3.85M bpd in the week ended February 8. Meanwhile, US’ crude oil exports have soared after the government lifted the exports ban in 2015. Although the export size is still limited when compared with oil giant Saudi Arabia, more supply in the market is still negative for prices.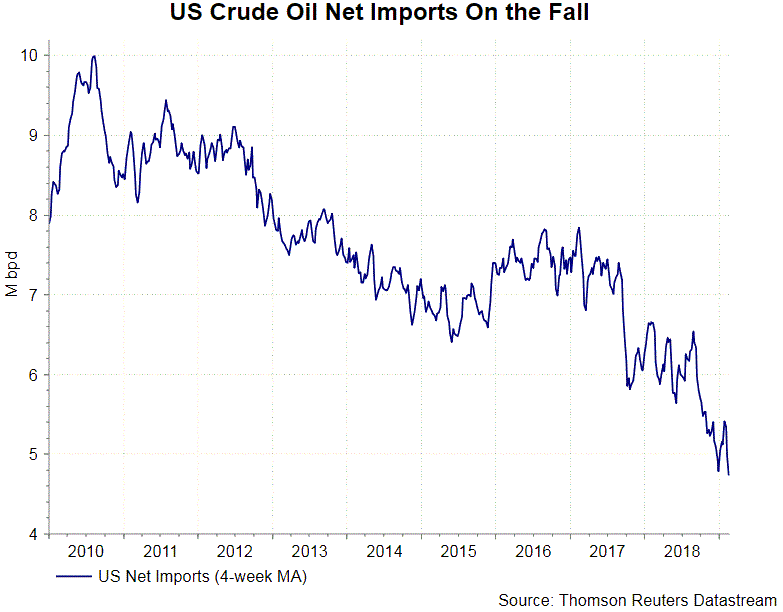
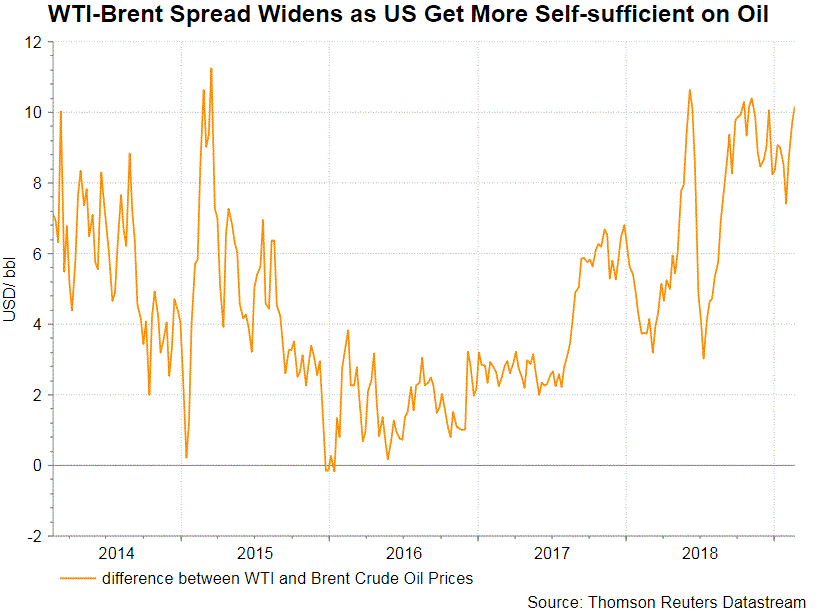
On the demand side, global economic slowdown would still continue even after the US and China resolves their trade disputes. As we mentioned in the previous report, while China might eventually agree to import significantly import more goods from the US, it takes much longer time to deal with conflicts regarding technologies, cyber security and intellectual property rights. As such, uncertainty in global economies should linger. Country- specific data in the US and China, the two largest oil consumers in the world, have evidenced weakness in growth. Headline CPI in China eased to +1.7% y/y in January, missing consensus of and December’s +1.9%. The slowdown was mainly driven by food price which fell -0.6 percentage point to +1.9%. Non-food inflation steadied at +1.7%. PPI decelerated sharply to +0.1% y/y, from +0.9% a month ago. The market had already anticipated a significant slowdown of +0.2% but the actual figure was even worse. More activity data would be due in coming weeks. The market has revised lower their forecasts on US GDP growth in 4Q18. following a strong second and third quarter, at 4.2% and +3.4% respectively, growth in the last quarter of last year likely faltered below +3%. Growth is expected to decelerate further this year. Risks are thus skewed to the downside for their demand on oil.
OPEC+ Output and Compliance to Reduction (January 2019)
| M bpd | Crude Oil Output in January 2019 | Baseline for cut | Pledged cut | ||
| Opec-11 | Opec | Reuters | average | ||
| Algeria | 1.04 | 1.06 | 1.05 | 1.057 | 32 |
| Angola | 1.42 | 1.45 | 1.43 | 1.528 | 47 |
| Congo | 0.31 | 0.32 | 0.32 | 0.325 | 10 |
| Ecuador | 0.52 | 0.52 | 0.52 | 0.524 | 16 |
| Equatorial Guinea | 0.12 | 0.12 | 0.12 | 0.127 | 4 |
| Gabon | 0.19 | 0.19 | 0.19 | 0.187 | 6 |
| Iraq | 4.67 | 4.65 | 4.66 | 4.653 | 141 |
| Kuwait | 2.71 | 2.71 | 2.71 | 2.809 | 85 |
| Nigeria | 1.79 | 1.84 | 1.82 | 1.738 | 53 |
| Saudi | 10.21 | 10.25 | 10.23 | 10.633 | 322 |
| UAE | 3.08 | 3.07 | 3.07 | 3.168 | 96 |
| opec 11 - total | 26.05 | 26.18 | 26.12 | 26.749 | 812 |
| Non-opec | 0 | ||||
| Azerbaijan | 0.79 | 0.797 | -20 | ||
| Bahrain | 0.21 | 0.217 | -5 | ||
| Brunei | 0.11 | 0.115 | -3 | ||
| Kazakhstan | 2.08 | 2.028 | -40 | ||
| Malaysia | 0.69 | 0.698 | -15 | ||
| Mexico | 1.94 | 1.993 | -40 | ||
| Oman | 0.98 | 1.003 | -25 | ||
| Russia | 11.71 | 11.747 | -230 | ||
| South Sudan | 0.12 | 0.124 | -3 | ||
| Sudan | 0.07 | 0.074 | -2 | ||
| Non-OPEC total | 18.702 | 18.796 | -383 | ||
| 'OPEC+' (OPEC 11 and non-OPEC-10) | 45 | 46 | 1195 | ||
| Average compliance level | 60.70% | ||||
Wall Street Cheers Fed Decision To End Balance Sheet Reduction
The US dollar index was little moved in overnight trading following the release of Federal Reserve meeting minutes. The bank’s officials signaled that they will complete the job of reducing the balance sheet this year. As a result of quantitative easing, the bank’s balance sheet increased from under $1 trillion to above $4 trillion. The minutes provided a boost to the market, which was unnerved by the process. In the meeting, the officials left interest rates unchanged at 2.25%-2.50%. They also signaled that there was need for patience before more rate hikes this year.
The Australian dollar was a bit volatile in overnight trading. This came after the Fed minutes showed the need for patience in rate hikes and after Australia released key data. The unemployment rate remained at 5.0% while the participation rate increased to 65.7%. This was higher than the expected 65.6%. The employment change for January was 39.1K, which was more than double than what investors were expecting. On the downside, the manufacturing and services PMIs fell below expectations. The two numbers were 53.1 and 49.3 respectively. The services PMI’s reading is an indication that the industry is contracting.
Investors will focus on the euro today ahead of key data from the European Union. The German headline CPI is expected to remain unchanged at 1.4%. The harmonized CPI too is expected to remain unchanged at 1.7%. Similarly, in France, the CPI number is expected to remain unchanged at 1.2%. In Germany, the manufacturing PMI is expected to improve to 50, from January’s level of 49.7. The services PMI is expected to slow to 52.8. Investors will also receive the minutes for the past meeting by the ECB.
EUR/USD
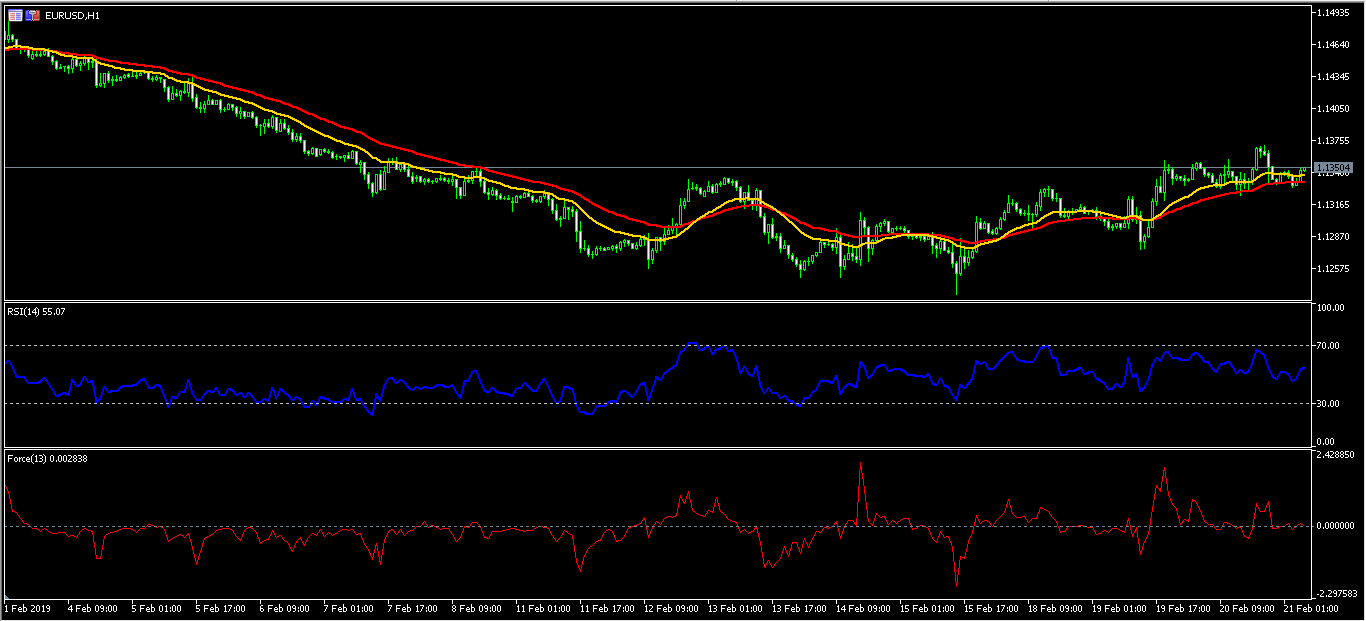
The EUR/USD pair was relatively unchanged in overnight trading. The pair is now trading at the 1.1350 level. On the hourly chart, the pair’s price is along the 21-day and 42-day EMAs, while the RSI is at the 53 level. The Force Index is along the neutral level too. As a result of all this, the pair could move in either direction.
AUD/USD
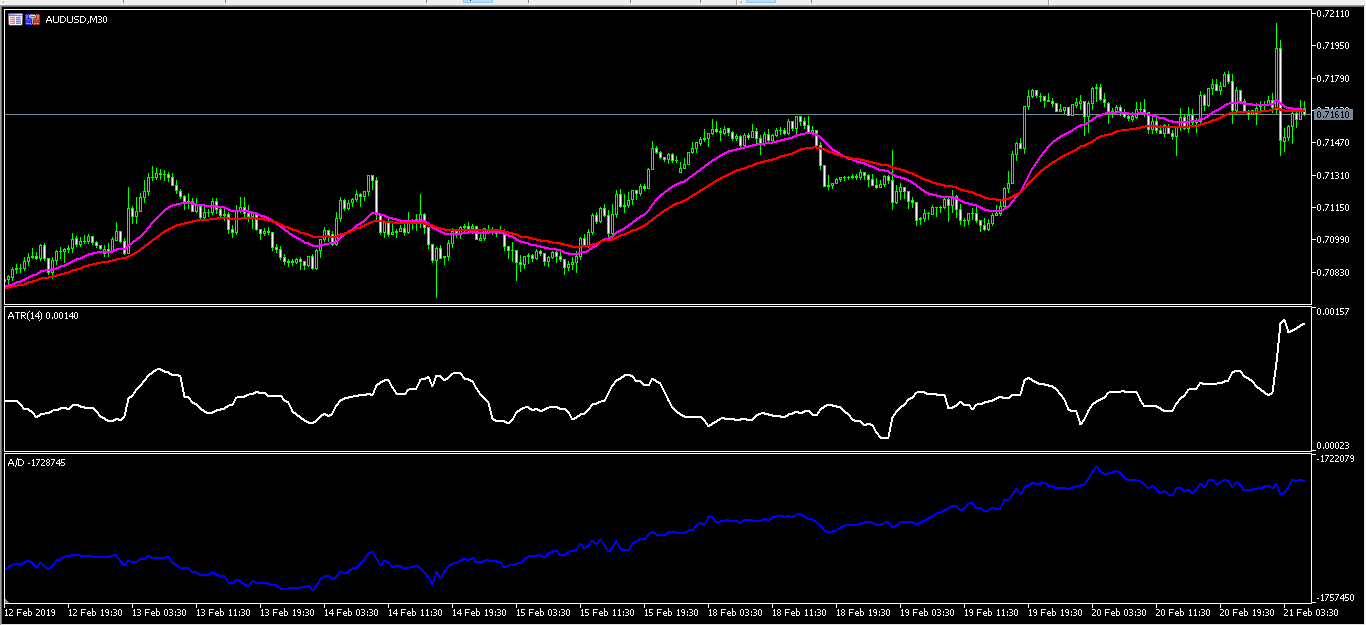
The AUD/USD pair was relatively volatile in overnight trading as investors parsed through key data from the US and Australia. Initially, the pair jumped to a high of 0.7206 and then pared those gains by declining to the 0.7140 level. It then started moving up and is currently at 0.7161. This volatility is evidenced by the Average True Range indicator, which has jumped as shown below. The accumulation and distribution indicator has also been rising. The price is currently along the 21-day and 42-day EMAs. The pair’s movements today will be influenced by the US durable order numbers.
XTI/USD
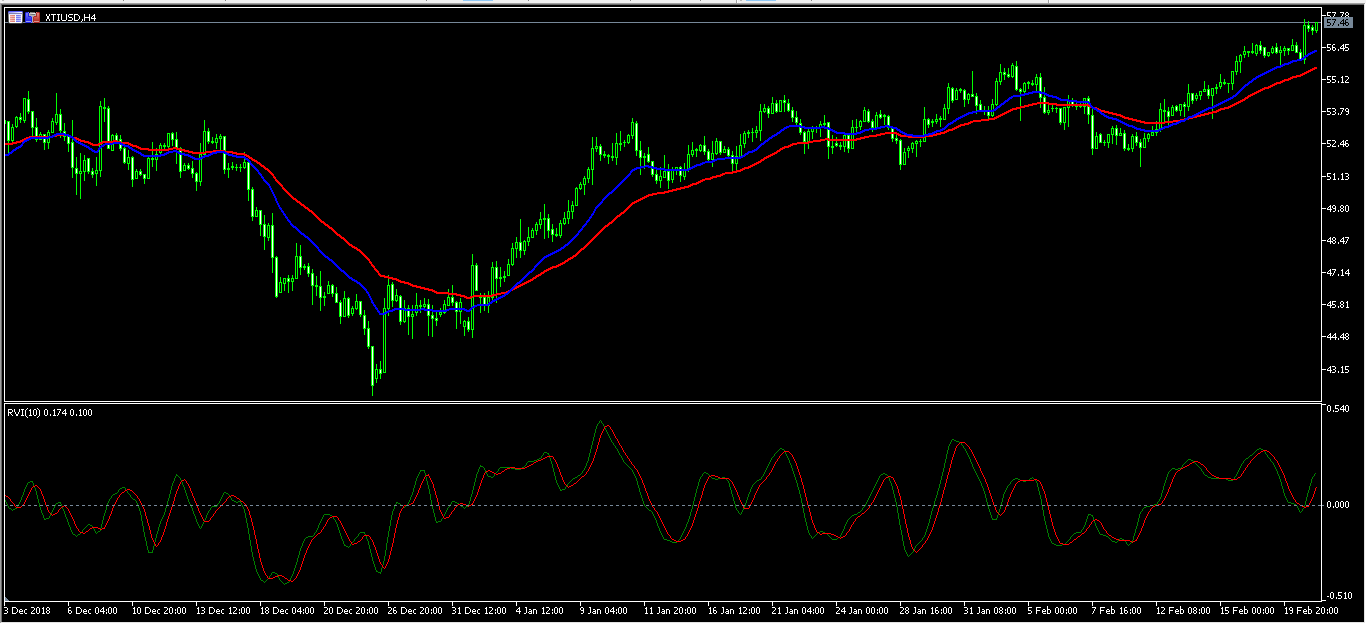
The price of crude oil continued to rise after the release of US inventory numbers by the American Petroleum Institute (API). The XTI/USD pair reached a high of 57.45, as it continued towards the important resistance level of 60. On the four-hour chart, the pair’s price is above the 21-day and 42-day EMAs. It is also above all the other important EMAs. The Relative Vigor Index has moved up from the neutral level. The pair could continue moving up, although traders should pay close attention to and near the 60 level.
EUR/USD Daily Outlook
Daily Pivots: (S1) 1.1318; (P) 1.1344; (R1) 1.1364; More.....
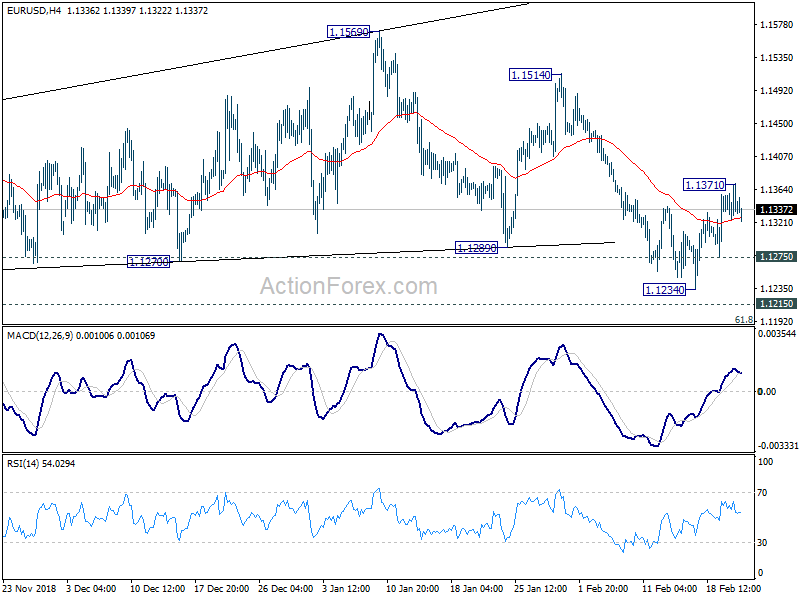
EUR/USD lost momentum after hitting 1.1371 and intraday bias is turned neutral first. On the upside, above 1.1371 will extend the rebound from 1.1234, towards 1.1514 resistance. On the downside, though, break of 1.1275 minor support will turn bias back to the downside for 1.1215 low instead. Decisive break there will confirm completion of consolidation from 1.1215, and resumption of down trend from 1.2555.
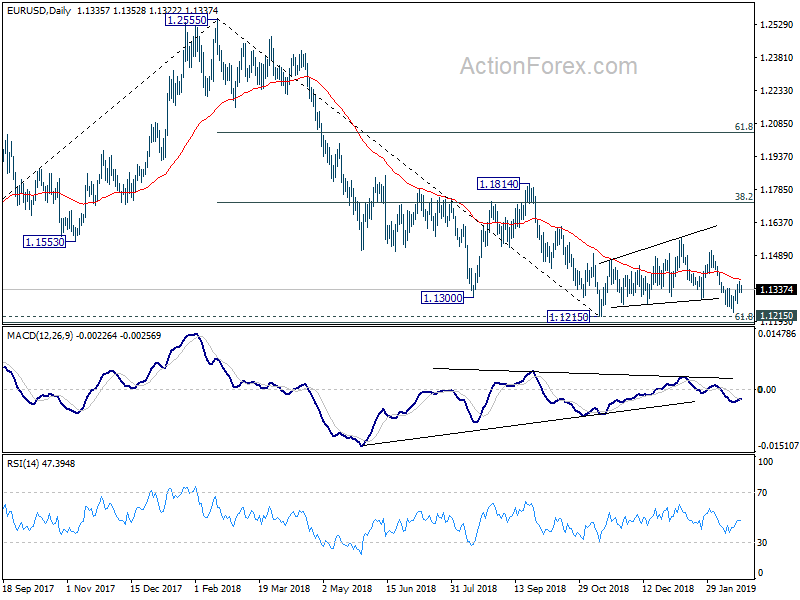
In the bigger picture, as long as 1.1814 resistance holds, down trend down trend from 1.2555 medium term top is still in progress and should target 61.8% retracement of 1.0339 (2017 low) to 1.2555 at 1.1186 next. Sustained break there will pave the way to retest 1.0339. However, break of 1.1814 will confirm completion of such down trend and turn medium term outlook bullish.
GBP/USD Daily Outlook
Daily Pivots: (S1) 1.3004; (P) 1.3057; (R1) 1.3101; More....
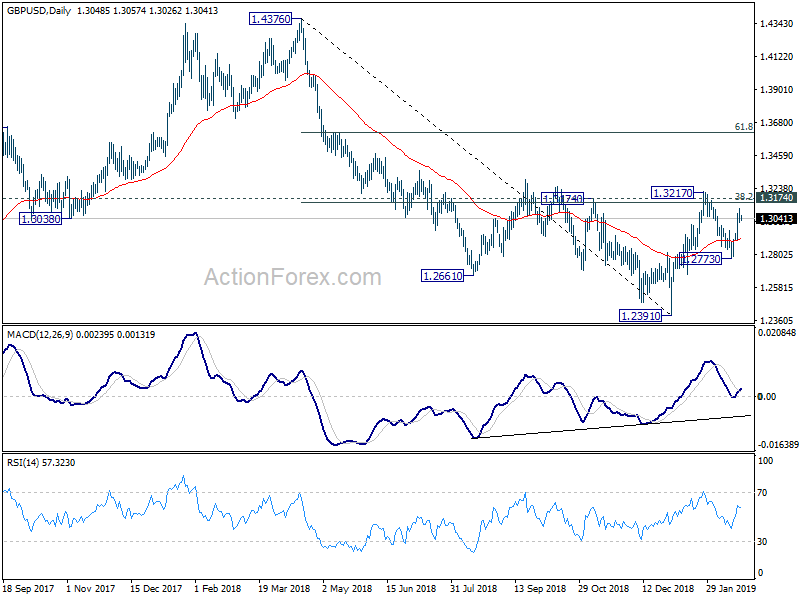
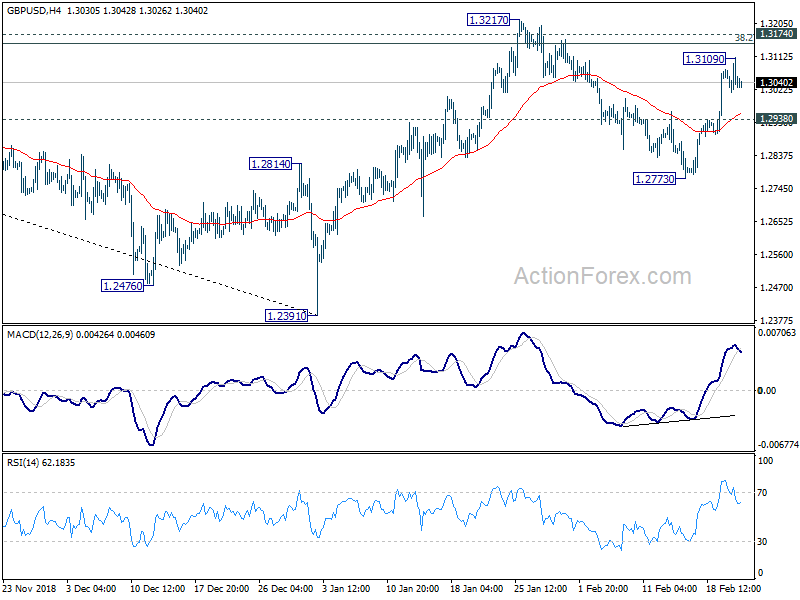
GBP/USD's recovery lost momentum after hitting 1.3109. Intraday bias is turned neutral first. Above 1.3109 will target 1.3174/3217 resistance zone. Decisive break there will complete a head and shoulder bottom pattern (ls: 1.2661, h: 1.2391, rs: 1.2773). That would indicate bullish reversal for 61.8% retracement of 1.4376 to 1.2391 at 1.3618 next. On the downside, break of 1.2935 minor support will turn bias back to the downside for 1.2773 instead.
In the bigger picture, focus is back on 1.3174 resistance with current rebound. Break will indicate completion of decline from 1.4376. Rise from 1.2391 would then be seen as the third leg of the corrective pattern from 1.1946 (2016 low). In that case, further rise could be seen through 1.4376 resistance. Nevertheless, rejection by 1.3174 again will extend the decline from 1.4376 through 1.2391 to 1.1946 low.