

Sample Category Title
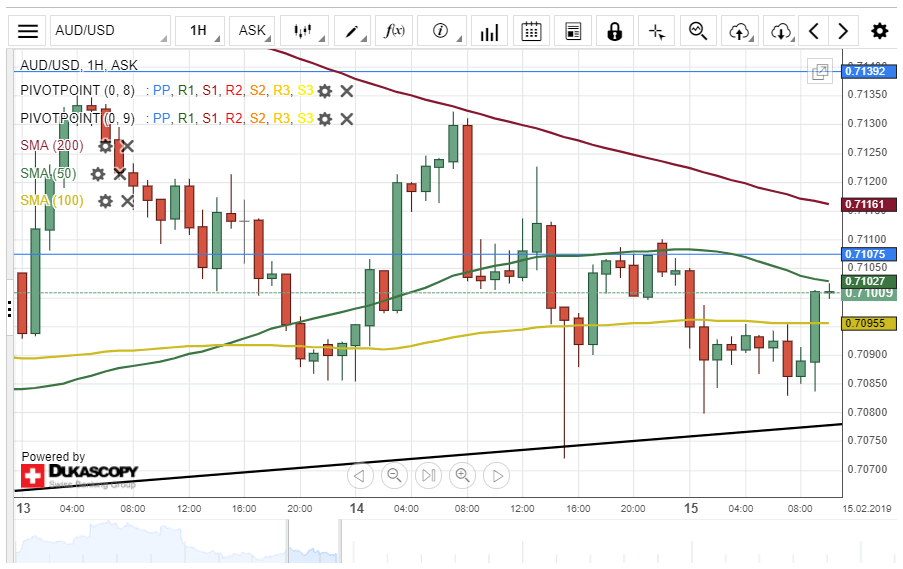
AUD/USD Decline Insight
The Australian Dollar depreciated about 60 base points against the US Dollar on Thursday. The decline was stopped by the lower boundary of an ascending channel pattern at 0.7072.
Technical indicators flash sell signals on both the 4(H) and the daily chart. Therefore, it is likely that the decline of the currency exchange rate could continue during the following trading session.
The potential downside target for bearish traders within this session will be near a swing low of 0.7060
EUR/JPY Breakout Occurs
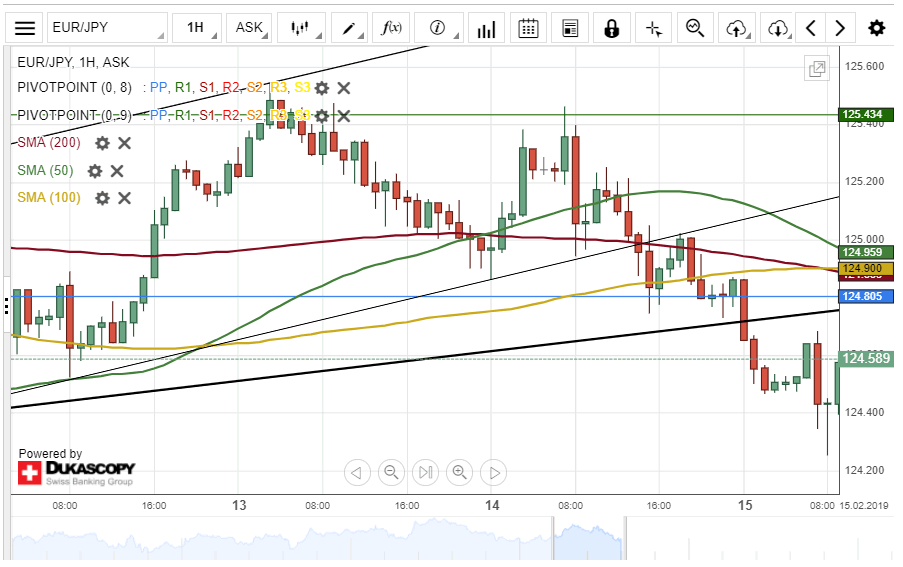
Downside risks prevailed in the market on Thursday. As a result, the common European currency broke both the short and the medium-term ascending channel pattern.
As for the near future, it is possible that the currency exchange rate makes a brief retracement towards the 50-hour simple moving average at 125.01 during the following trade session.
However, it is important to note that a resistance cluster formed by the combination of the 100– and 200-hour SMAs at 124.90 could hinder such movement.
Meanwhile, technical indicators suggest that the overall market sentiment could remain bearish.
The Analytical Overview Of The Main Currency Pairs
The EUR/USD currency pair
Technical indicators of the currency pair:
Prev Open: 1.12602
Open: 1.12939
% chg. over the last day: +0.25
Day's range: 1.12715 – 1.12969
52 wk range: 1.1214 – 1.2557
EUR/USD has an ambiguous technical picture. Right now the quotes are consolidating after a long fall. The demand for USD remains high. The investors are waiting for additional drivers. The US/China negotiations and Donald Trump`s edicts regarding the White House operations are in the spotlight. The local support and resistance levels are 1.12700 and 1.13000. You should open positions from these levels.
At 15:30 (GMT+2:00) the US will publish an array of economic reports. Keep an eye on the difference between the real and forecasted data.
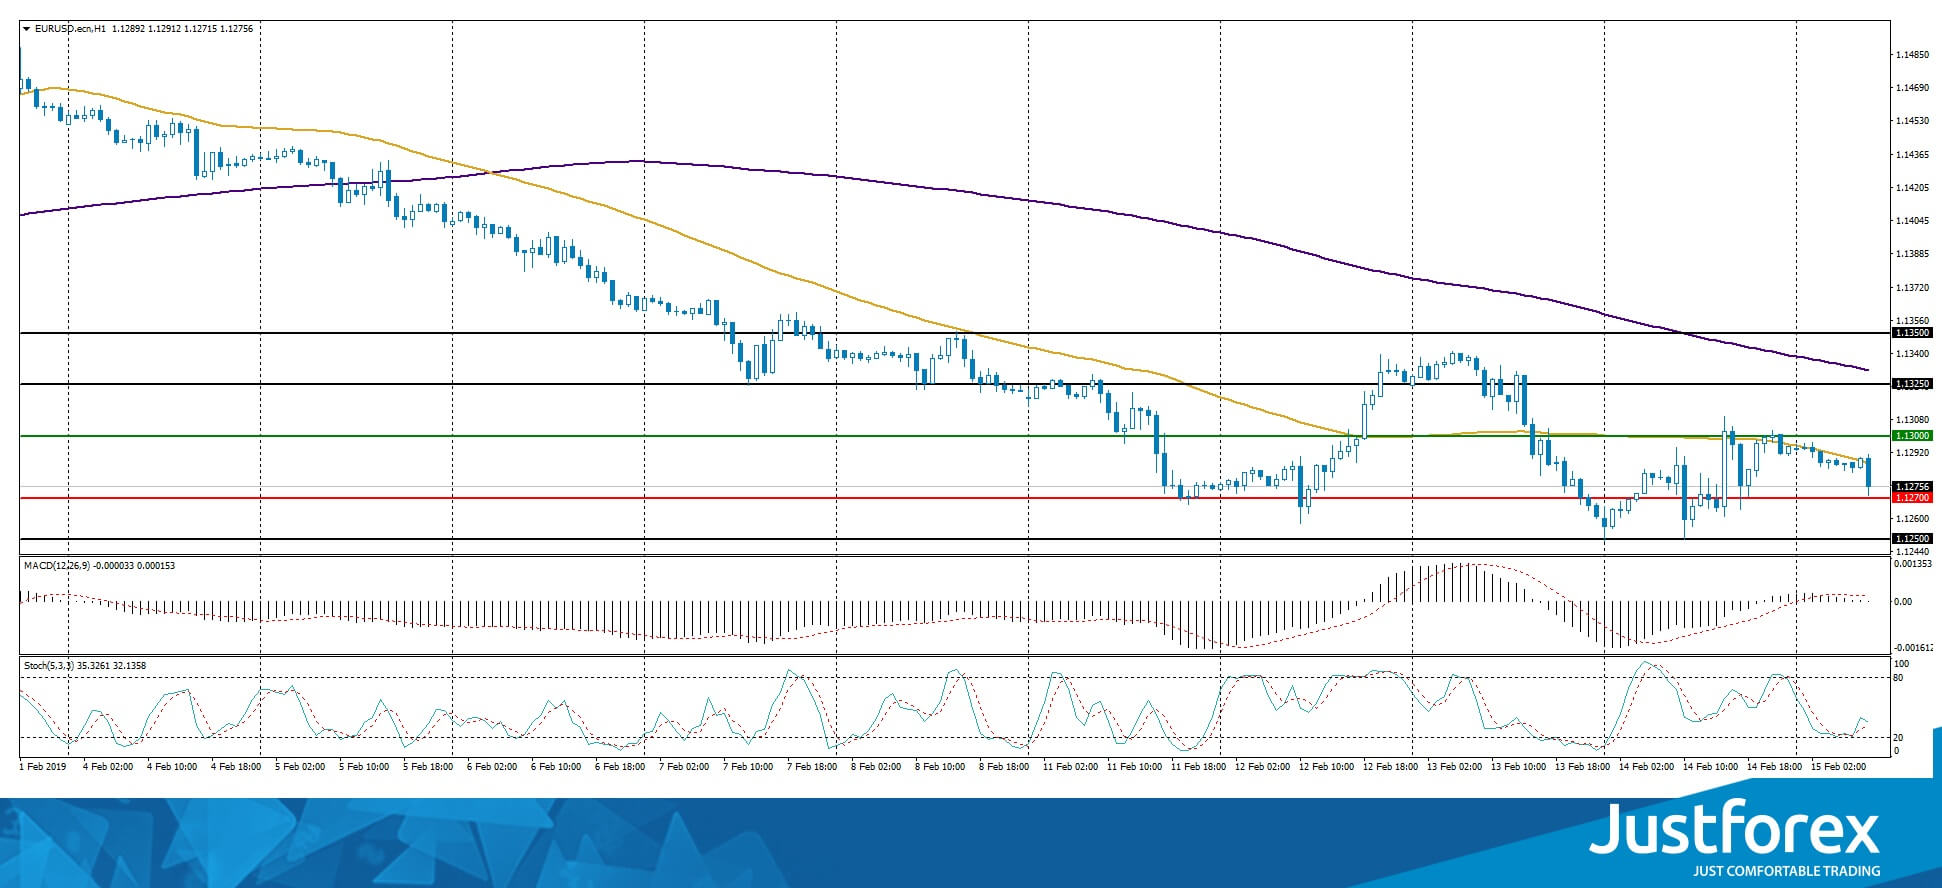
The indicators do not provide precise signals, the price has crossed 50 MA.
The MACD is close to 0
The Stochastic Oscillator is in the neutral zone, the %K line has started to cross the %D line. There are no signals at the moment.
Trading recommendations
Support levels: 1.12700, 1.12500, 1.12000
Resistance levels: 1.13000, 1.13250, 1.13500
If the price fixes below 1.12700 expect the quotes to fall toward 1.12300-1.12000.
Alternatively, the quotes can recover toward 1.13250-1.13500.
The GBP/USD currency pair
Technical indicators of the currency pair:
Prev Open: 1.28444
Open: 1.27972
% chg. over the last day: -0.37
Day's range: 1.27891 – 1.28226
52 wk range: 1.2438 – 1.4378
The pound remains under pressure due to the Brexit conundrum and weak economic reports. Yesterday, the parliament of the UK refused Theresa May's proposal to move the Brexit date. Right now the quotes are consolidating at 1.27800-1.28200. You should open positions from these levels.
At 11:30 (GMT+2:00) the UK will publish the retail sales report.
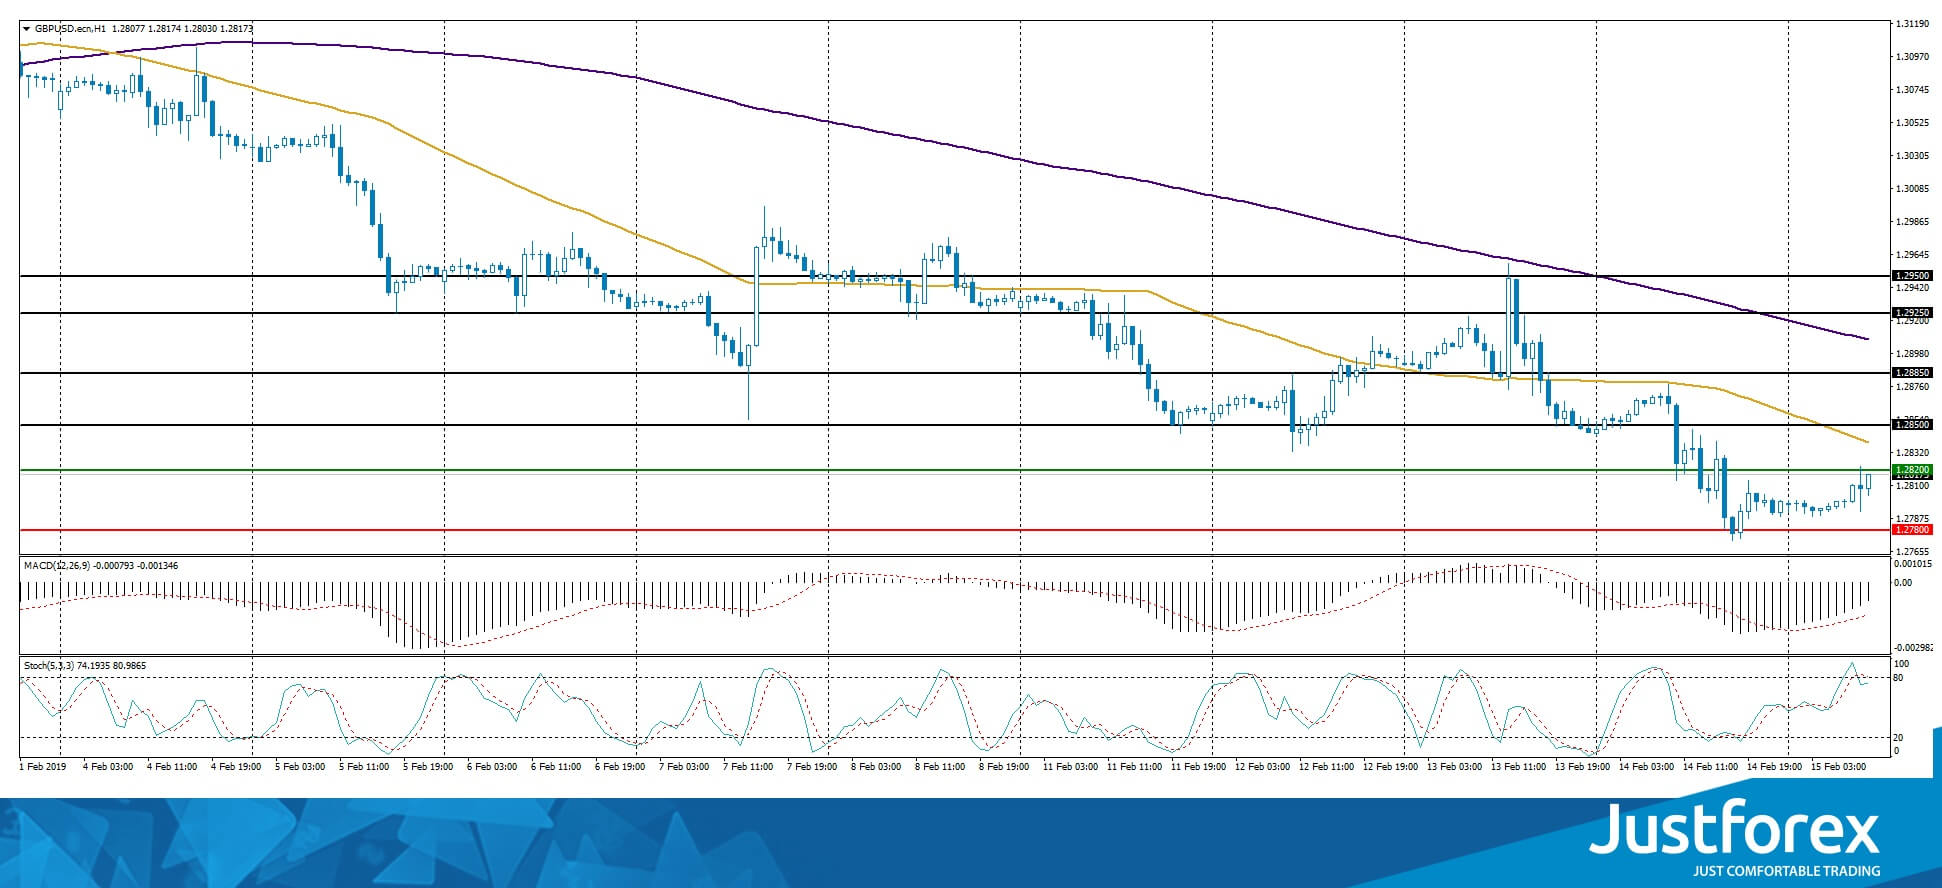
The price fixed below 50 MA and 200 MA which points to the power of they buyers.
The MACD histogram is in the negative zone but above the signal line which gives a weak signal to sell GBP/USD.
The Stochastic Oscillator is close the the overbought zone, the %K line is crossing the %D line. There are no signals at the moment.
Trading recommendations
Support levels: 1.27800, 1.27500, 1.27000
Resistance levels: 1.28200, 1.28500, 1.28850
If the price fixes below 1.27800 expect the quotes to fall toward 1.27500-1.27300.
Alternatively, the quotes can recover toward 1.28600-1.28900.
The USD/CAD currency pair
Technical indicators of the currency pair:
Prev Open: 1.32520
Open: 1.32905
% chg. over the last day: +0.30
Day's range: 1.32878 – 1.33128
52 wk range: 1.2248 – 1.3664
USD/CAD is consolidating close to the monthly maximums. The technical picture is ambigous. The local support and resistance levels are 1.32900 and 1.33250. You should open positions from these levels. Keep an eye on the US economic reports and the oil quotes dynamics.
The Economic News Feed for 15.02.2019 is calm.
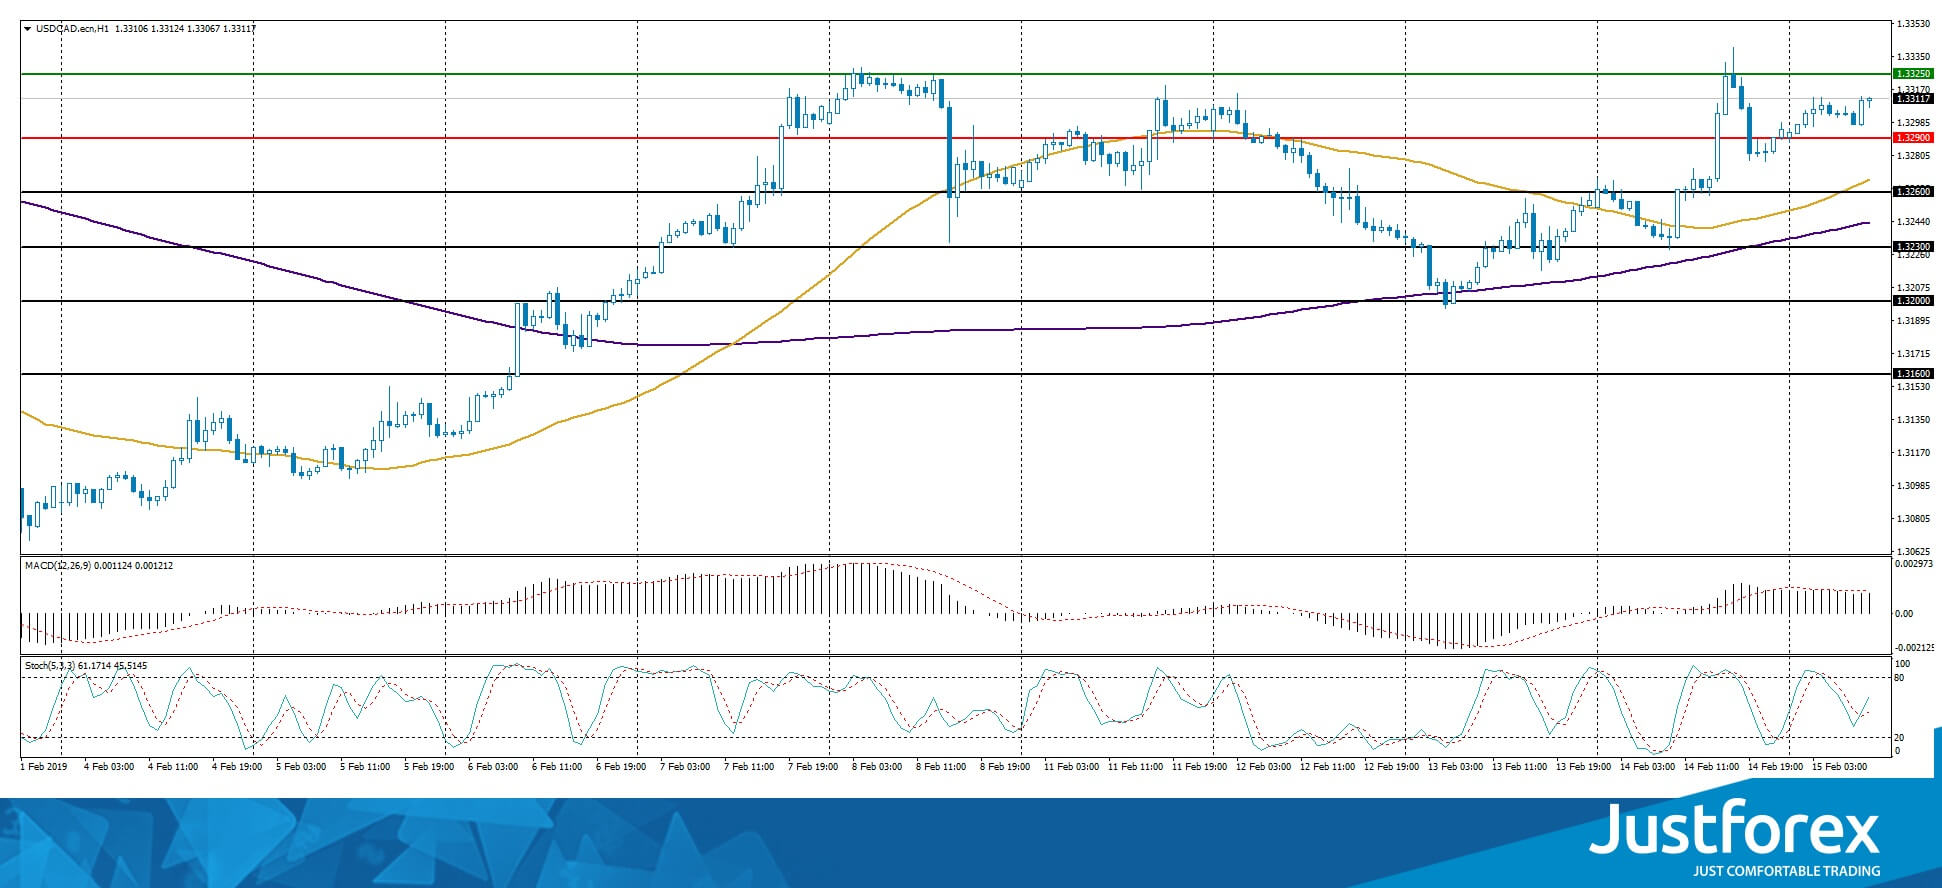
The indicators point to the power of the buyers, the price fixed above 50 MA and 200 MA.
The MACD histogram is in the positive zone, but below the signal line which gives a weak signal to sell USD/CAD.
The Stochastic Oscillator is in the negative zone, the %K line is above the %D line which points to a bullish mood.
Trading recommendations
Support levels: 1.32900, 1.32600, 1.32300
Resistance levels: 1.33250, 1.33600
If the price fixes above 1.33250, expect the quotes to grow toward 1.33600-1.33800.
Alternatively, the quotes can fall toward 1.32600-1.32300.
The USD/JPY currency pair
Technical indicators of the currency pair:
Prev Open: 110.972
Open: 110.440
% chg. over the last day: -0.41
Day's range: 110.257 – 110.550
52 wk range: 104.56 – 114.56
The USD/JPY started to descend. During the last tow days of trading, the quotes fell by 60 points. The safe haven currency updated the key extremums and is consolidating around 110.250-110.500. The quotes have a tendency to descend further. Keep an eye on the US news feed and open positions from the key levels.
The Economic News Feed for 15.02.2019 is calm.
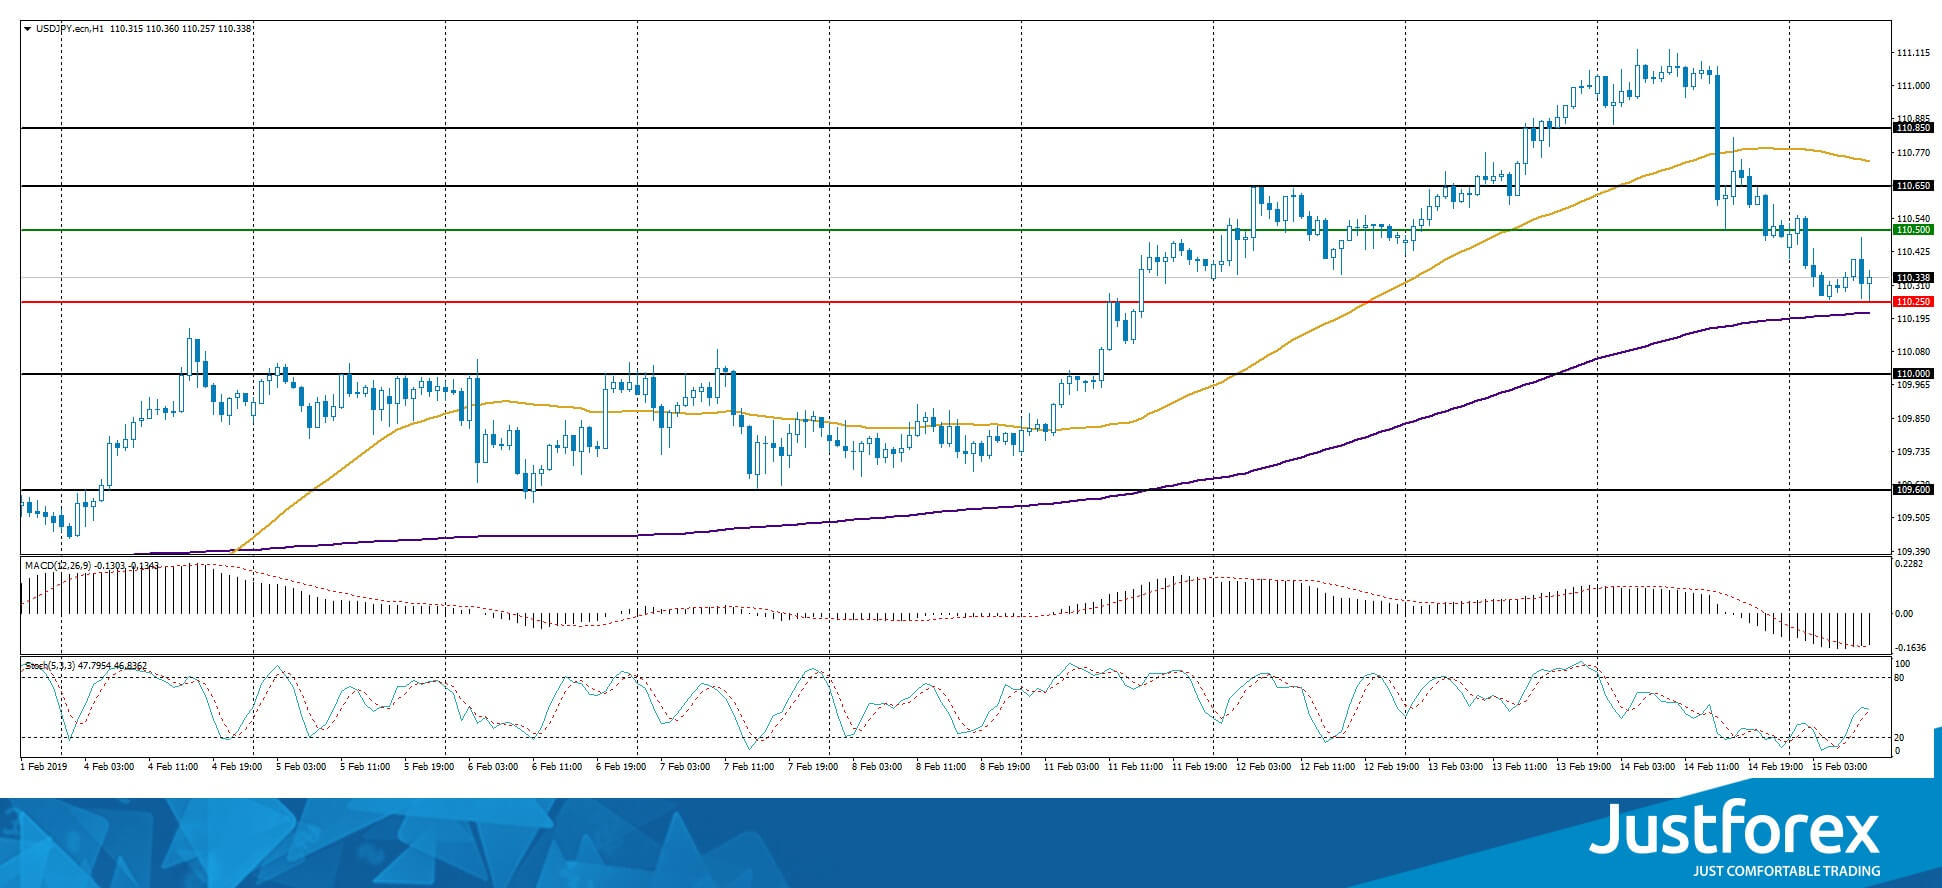
The indicators do not provide precise signals, the price fixed between 50 MA and 200 MA.
The MACD histogram is in the negative zone but above the signal line, which gives a weak signal to sell USD/JPY.
The Stochastic Oscillator is in the neutral zone the %K line is crossing the %D line. There are no signals at the moment.
Trading recommendations
Support levels: 110.250, 110.000, 109.600
Resistance levels: 110.500, 110.650, 110.850
If the price fixes below 110.250, expect the quotes to fall toward 110.000-109.800.
Alternatively, the quotes can grow toward 110.700-110.900.
Currency Majors Are Consolidating
Yesterday, the US dollar weakened slightly against a basket of major currencies. At the moment, the dollar index (#DX) is consolidating near monthly highs. The US published weak economic reports. Thus, core retail sales declined by 1.8% in December, although experts expected the figure to remain unchanged. The producer price index also dropped by 0.1%, while the growth by 0.1% was forecasted. Retail sales also fell by 1.2% in December instead of the expected growth by 0.3%. Today, financial market participants closely monitor negotiations between Beijing and Washington, as well as expect Donald Trump to sign budget documents.
The British pound weakened again after members of the UK House of Commons did not support the idea by Theresa May to agree with Brussels on the rescheduling of Brexit. Parliament voted against the amendment, which offered to postpone the Brexit deadline for at least three months. All this greatly undermines the authority of the British Prime Minister, Theresa May. Today, we expect important economic statistics from the UK.
The "black gold" prices are consolidating after growth the day before. At the moment, futures for the WTI crude oil are testing the mark of $54.50 per barrel.
Market Indicators
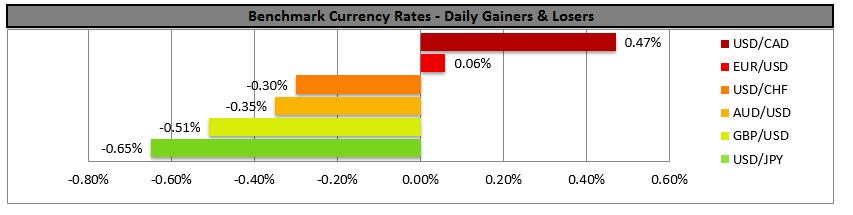
- Yesterday, there was a variety of trends in the US stock market: #SPY (-0.22%), #DIA (-0.25%), #QQQ (+0.12%).
- The 10-year US government bonds yield fell again. Currently, the indicator is at the level of 2.64-2.65%.
The news feed on 15.02.2019:
- Retail sales in the UK at 11:30 (GMT+2:00);
- A number of important statistics from the US at 15:30 (GMT+2:00).
UK Jan retail sales blew expectations, but store price slowed to lowest since 2016
UK January retail sales came in much stronger than expected.
- Including auto and fuel, sales rose 1.0% mom, 4.2% yoy versus expectation of 0.2% mom, 3.4% yoy.
- Excluding auto and fuel, sales rose 1.2% mom, 4.1% yoy versus expectation of 0.2% mom, 3.1% yoy.
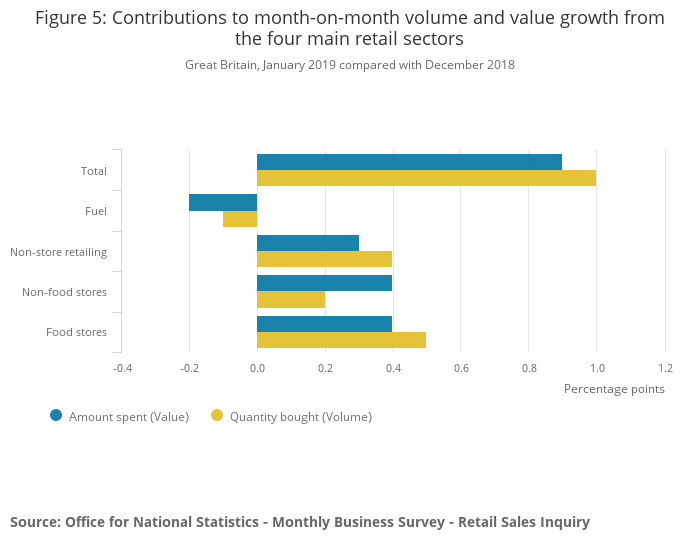
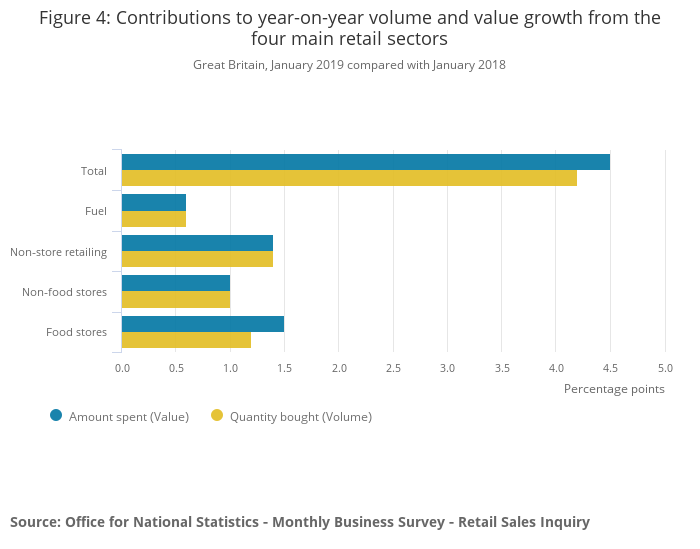
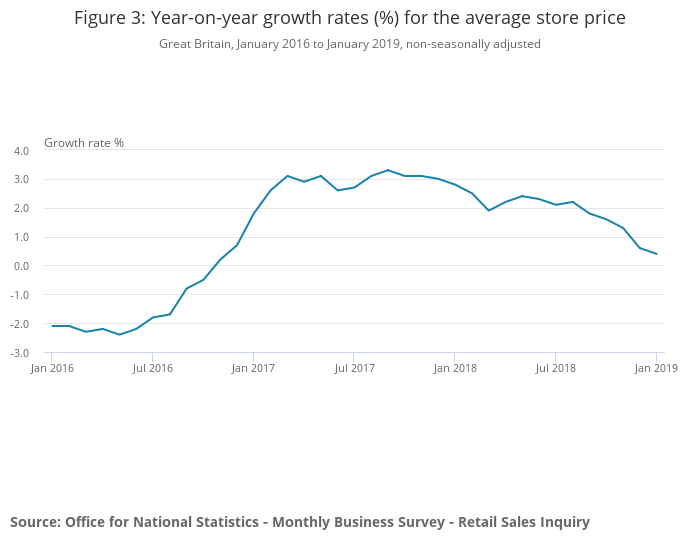
However, year-on-year average store prices growth slowed to 0.4%, lowest price increase since November 2016.
Forex Technical Analysis: EUR/USD, USD/JPY, GBP/USD
EUR/USD
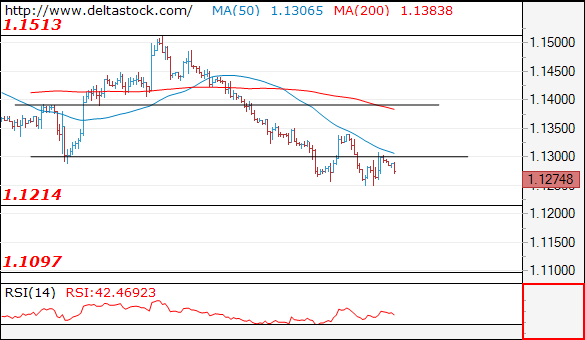
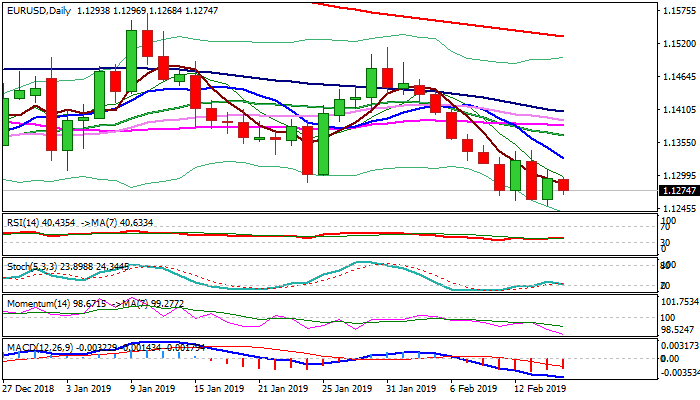
Current level - 1.1274
The intraday bias is neutral above 1.1250, but the overall outlook on the senior frames is bearish, for a break through 1.1214, en route to 1.1100 zone.
| Resistance | Support | ||
| intraday | intraweek | intraday | intraweek |
| 1.1300 | 1.1630 | 1.1250 | 1.1214 |
| 1.1350 | 1.1820 | 1.1214 | 1.1100 |
USD/JPY
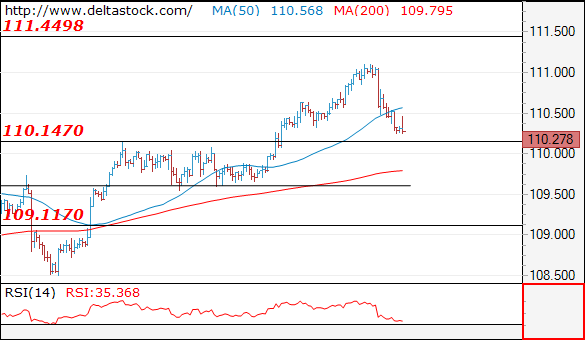
Current level - 111.27
The reversal at 111.10 led to a slide to 110.20 support area and a break here will challenge 109.10 and 108.40.
| Resistance | Support | ||
| intraday | intraweek | intraday | intraweek |
| 110.80 | 111.45 | 110.20 | 106.70 |
| 111.45 | 114.50 | 109.10 | 104.60 |
GBP/USD
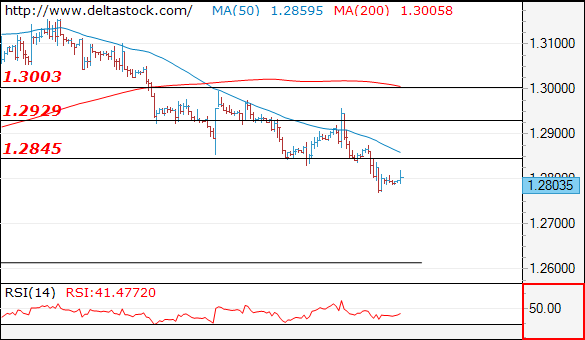
Current level - 1.2803
The overall bias remains negative below 1.2845, for a slide towards 1.2620 area. Crucial on the upside is 1.2950 high.
| Resistance | Support | ||
| intraday | intraweek | intraday | intraweek |
| 1.2845 | 1.3000 | 1.2800 | 1.2800 |
| 1.2950 | 1.3290 | 1.2700 | 1.2610 |
EUR/USD Outlok: Weekly Close Below 200WMA To Confirm Bearish Stance And Risk Test Of 1.1215/1.1186 Pivots
The Euro stands at the back foot in early European trading on Friday and reverses gains of the previous day, when weaker than expected US retail sales (data showed the biggest drop in more than nine years) pressured dollar.
The greenback regained traction after weaker than expected Chinese inflation data, released overnight, reiterated concerns about global growth.
Choppy trading in past few sessions suggests that larger bears hesitate on approach to key support at 1.1215 (12/13 Nov lows, the lowest since Jun 2017).
Bearish daily studies favor further weakness, with confirmation of negative stance expected on weekly close below 200WMA, which kept the downside protected since Nov 2017.
The pair is also on track for the second bearish weekly close that adds to negative outlook.
Violation of Thursday’s low at 1.1249 would open way towards 1.1215 pivot and would risk extension towards 1.1186 (Fibo 61.8% of 1.0340/1.2555, Jan 2017/Feb 2018 rally).
Only break above 1.1329/41 (falling 10SMA / Wed’s high) would sideline bears and allow for stronger correction.
Res: 1.1296, 1.1329, 1.1341, 1.1366
Sup: 1.1268, 1.1249, 1.1215, 1.1186
Pound Weakens As UK Parliament Throws Theresa May’s Pan Out The Window
The UK parliament defeated Theresa May in a symbolic vote as it refused to back her Brexit plan, as hard Brexiteers refused to back her. The UK government still has the chance to renegotiate Brexit, yet her position against her EU counterparts may have been undermined. The defeat, enhances worries on her ability to persuade the UK parliament of her plan or to convince the EU for further concessions. The next big date for Theresa May would be the 27th of February when she is expected to return to the UK Parliament for another vote. Markets seem to grow more and more anxious about Brexit as time passes by and there seems to be no light at the end of the tunnel. The pound weakened on the result and we expect uncertainty to continue to weigh on the pound. Cable albeit breaking the downward trendline incepted since the end of January for a short while, ultimately dropped below it, breaking the 1.2830 (R1) support line (now turned to resistance). It would seem as the bearish momentum continues for the pound, albeit we could see today’s financial releases affecting the pairs’ direction, as well as any further Brexit headlines. Should the bears continue to be in control of the pair’s direction, we could see it aiming if not breaking the 1.2710 (S1) support line. On the other hand should the bulls take over, we could see the pair breaking the prementioned downward trendline, the 1.2830 (R1) resistance line and aim for higher grounds
USD weakens on soft retail sales.
The USD weakened yesterday as the US retail sales for December marked their sharpest drop in over 9 years reaching -1.2% mom. The contraction suggested also a considerable slowdown in US economic activity at the end of 2018, magnifying the effect. Analysts point out that the poor retail sales data has reinforced the view that the Fed could keep interest rates unchanged for 2019. We also expect that the outcome of the US-Sino negotiations, due out today, could influence USD’s direction. The top two US negotiators are expected to meet with Chinese President Xi today and some announcements could be expected. Despite lots of ink being spilled of a possible extension of the US tariff deadline of 1st of March, such intentions were not made official. We could see further developments on the issue over the weekend and President’s day on Monday to influence the USD’s direction. EUR/USD spiked yesterday at the release of the US retail sales growth rate for December, testing the 1.1300 (R1) resistance line, yet failing to clearly break it and ultimately correcting lower during the Asian session today. We could see the pair trading in a sideways manner yet the US financial releases as well as any headlines regarding the US-Sino negotiations could affect the pair’s direction. Should the pair come under selling interest of the market, we could see the pair breaking the 1.1260 (S1) support line and aim for lower grounds. Should on the other hand the pair find fresh buying orders along its path, we could see it breaking the 1.1300 (R1) resistance line and aim for the 1.1345 (R2) resistance level.
Today’s other economic highlights
In today’s European session, we get from the UK the retail sales growth rates for January and from the Eurozone the trade balance figure for December. In the American session, from the US we get the NY Fed Mfg Index, the industrial and manufacturing production growth rates for January, the preliminary University of Michigan Consumer Sentiment for February, and the Baker Hughes oil rig count. As for speakers, please note that Atlanta Fed President Raphael Bostic will be speaking.
GBP/USD H4
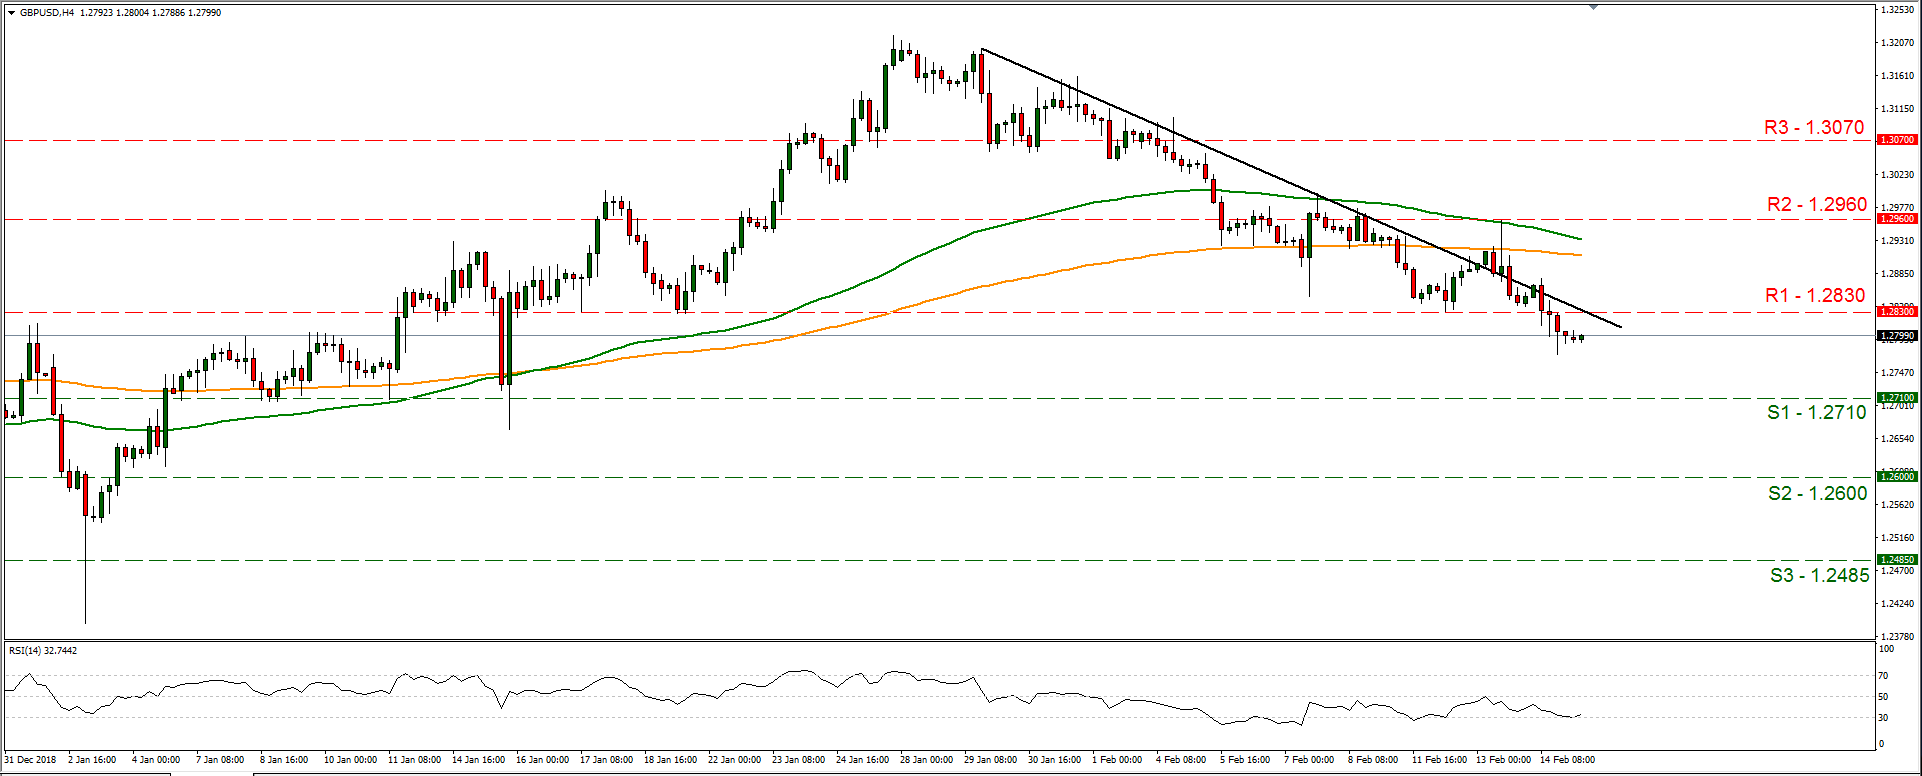
Support: 1.2710 (S1), 1.2600 (S2), 1.2485 (S3)
Resistance: 1.2830 (R1), 1.2960 (R2), 1.3070 (R3)
EUR/USD H4
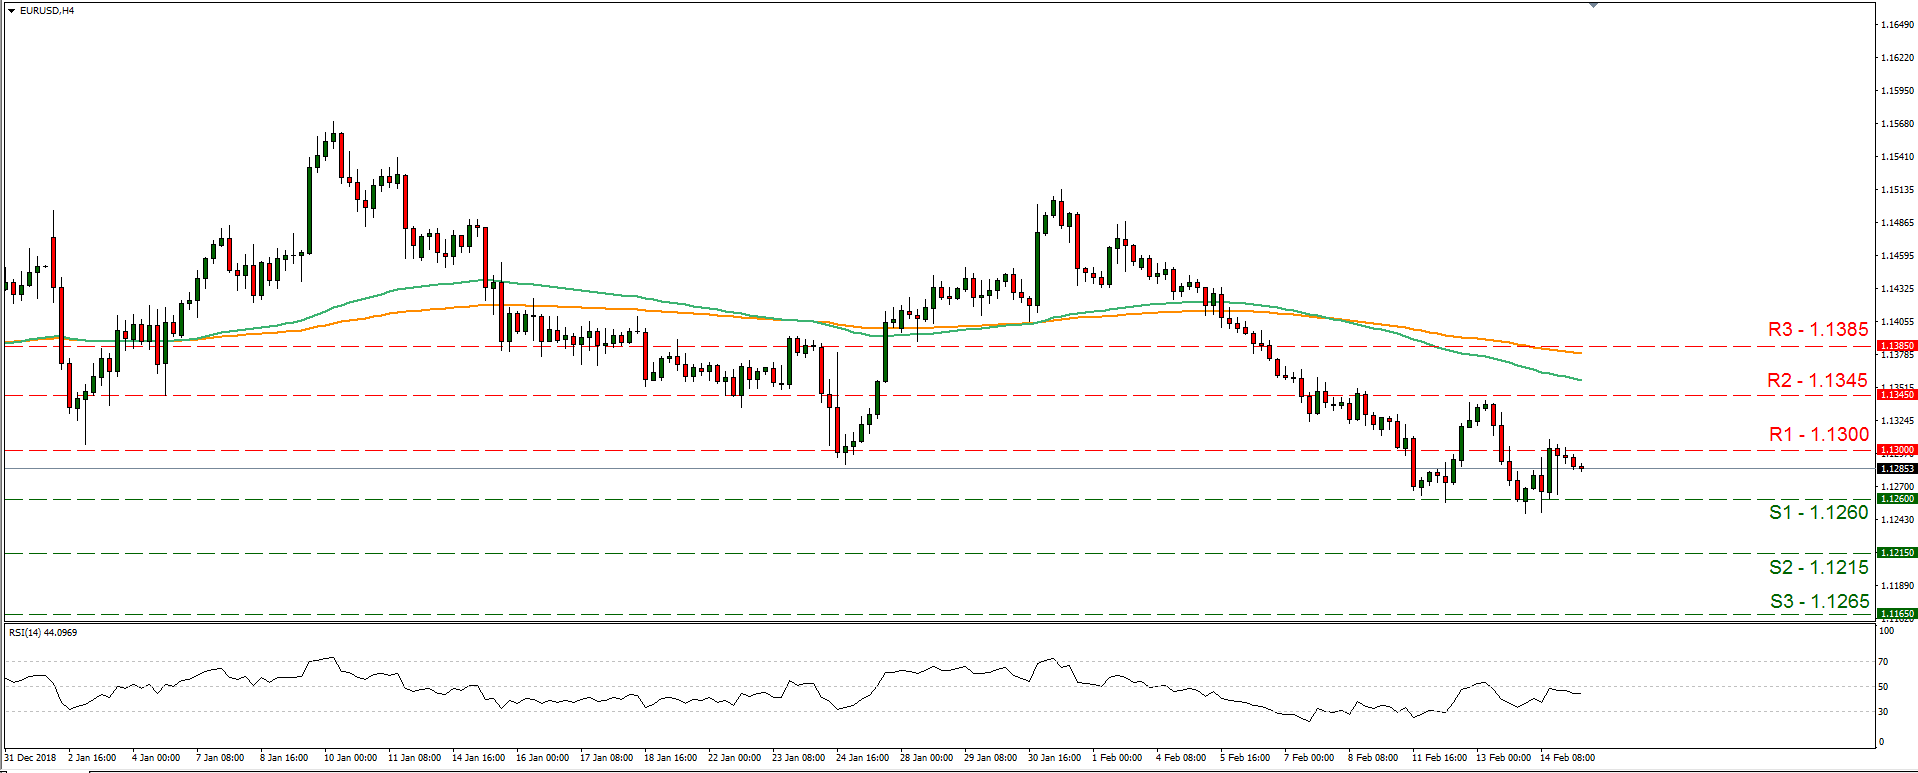
Support: 1.1260 (S1), 1.1215 (S2), 1.1265 (S3)
Resistance: 1.1300 (R1), 1.1345 (R2), 1.1385 (R3)
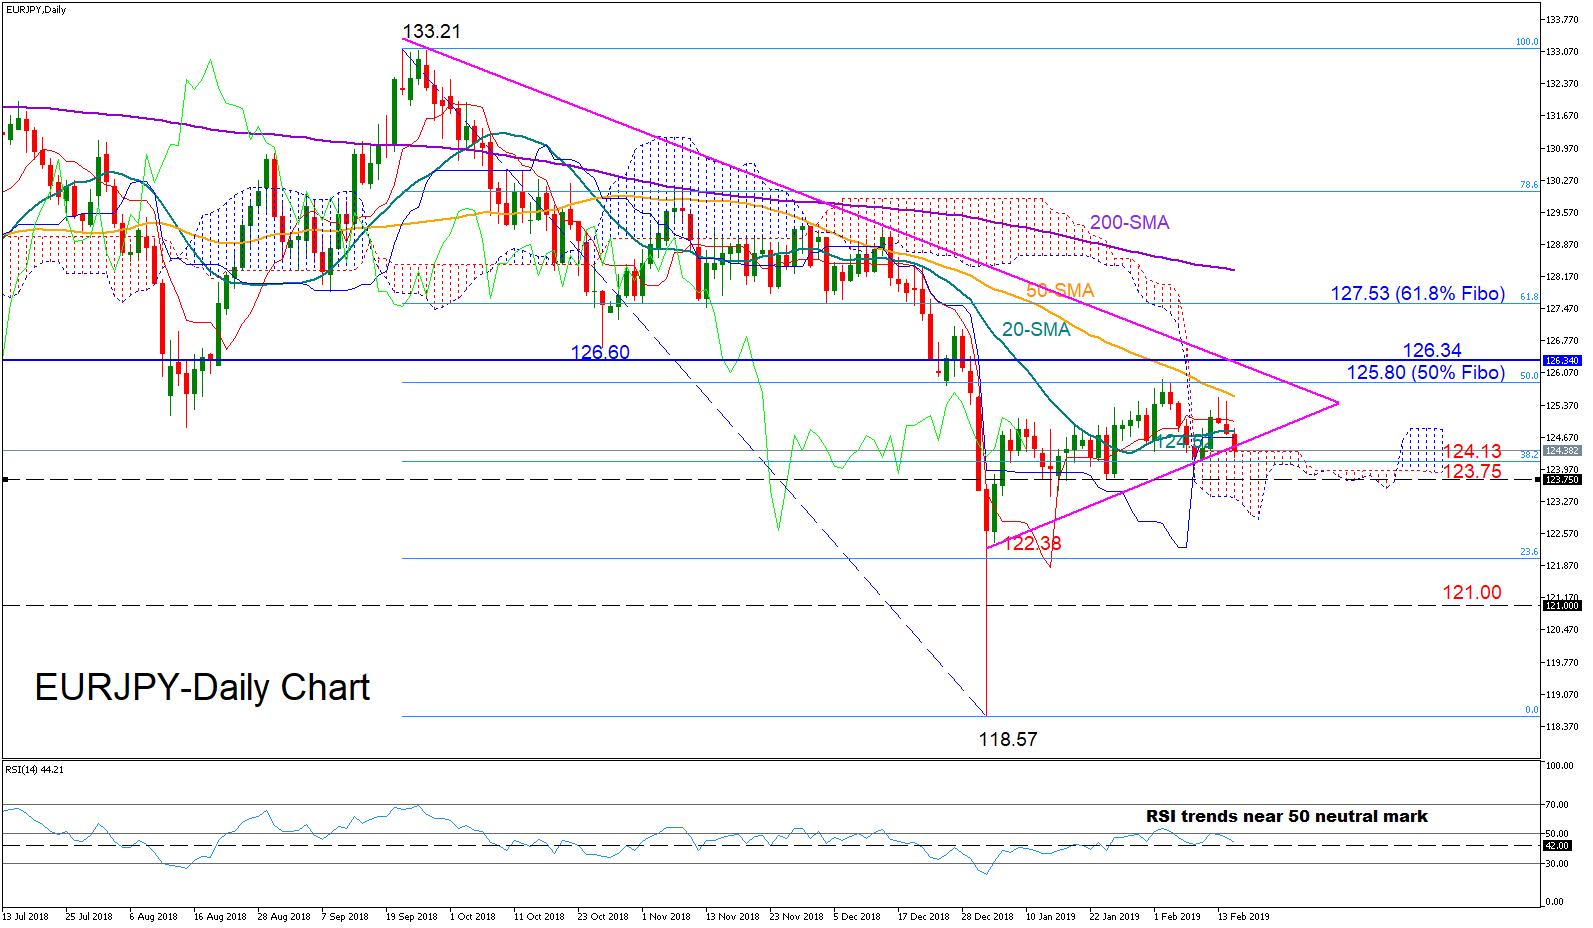
EURJPY Consolidates Within Symmetrical Triangle
EURJPY is trapped within the 124-126 area as the 50% and the 38.2% Fibonacci levels of the downleg from 133.21 to 118.57 seem to be keeping price movements under control and within the symmetrical triangle which appeared more clearly after the rebound on the 38.2% Fibonacci last week.
Momentum indicators suggest a neutral-to-bearish bias for the short term as the red Tenkan-sen line continues to move sideways, while the RSI is marginally below its 50 neutral mark but is heading towards the 42 area, where it has tended to bounce off in recent months.
In the negative scenario, the pair could significantly pierce the lower line of the symmetrical triangle to retest the 38.2% Fibonacci of 124.13. A successful break lower and more importantly below the 123.75 support area could potentially strengthen negative momentum towards the January 4 low of 122.38, while under that barrier the 121 key level could also provide support in case of a more dynamic sell-off.
On the upside, the 50% Fibonacci of 125.80 will be closely watched if bullish pressure comes back into play. A more important resistance, however, is expected to arise around 126.34 as any decisive close above that region and therefore above the upper line of the asymmetrical triangle, could bring more buying interest to the market, with the price probably rallying next towards the 61.8% Fibonacci of 127.58.
Turning to the medium-term picture, EURJPY remains bearish as long as it holds below 126.60. A rise above 130 would turn the outlook positive, though, with the 50-day MA distancing itself below the 200-day MA chances for such a move are very low.
Volatility Spike Could Continue
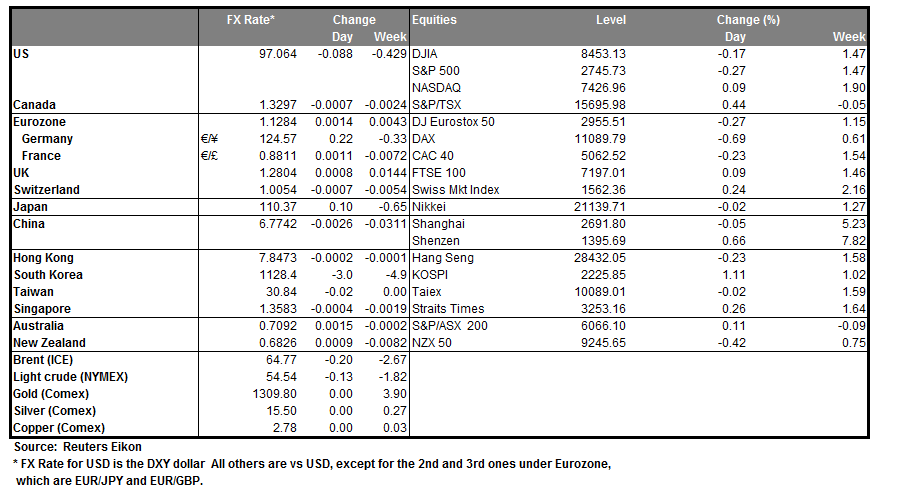
US futures and European markets are trading lower due to the trade pessimism and the rotten US retail sales number. Global equity markets have retreated from their highs and the theme is the same across all markets. Basically, investors aren’t sure if there is enough progress made on the US-China trade dispute, a factor which has been impacting the markets for months now. As for the US retail sales number, no matter how you look at it, and whatever reason you may choose to blame this, the fact is: if December’s number is this much weak, January number is going to have even nasty smell, because of the US government shutdown.
Nonetheless, the S&P 500 index is still up 9.53% year-to-date and the theme is similar for the Dow Jones and the Nasdaq, both of them have recorded solid gains of 9.05% and 11.93% YTD.
The biggest move which we have seen yesterday was in the volatility index, the SPX volatility jumped by 3.64% touching the level of 16.22. It was the volatility of the VSTOXX index which deserves the most amount of attention, it jumped more than 12% and closed at 15.75. We are expecting this trend to continue today and this may help both of the indices to erase some of their year-to-date losses of -36.19% and -33.97% respectively.
According to yesterday’s report, both sides: the US and China are still far apart on reforming any kind of trade deal. This makes it clear why Donald Trump has shifted his stance; he is weighing on the option of extending the deadline of the trade deal by 60 days. The fact is that if both Washington and Beijing continue to disappoint the markets in this manner, market participants will have no option but to radiate their anger.
Further pessimism in the markets comes from the fact that the Chinese economy continues to disappoint. The Chinese factory inflation took another nose dive today- reflecting softening demand in the country- a message which investors are highly sensitive to. It appears that there is no shortage of feeble economic numbers no matter where you look; Yesterday, the German GDP number showed the growth is stagnating, the US retail sales number also painted a horrible picture about the state of the consumer health. All these developments are only adding to the ongoing pessimism we are experiencing in the markets today.
Closer to home, after another humiliating defeat which Theresa May suffered in the parliament yesterday, the message to the EU is even more clear: the prime minister doesn’t have any support and there is even more divide in the parliament. This Brexit chaos is keeping sterling below the 1.28 mark against the dollar, and if the upcoming UK retail sales number miss the forecast of 0.2%, we could see some serious plunge in the currency, because it is only consumer spending which is holding the economy in reasonable shape.