Sample Category Title
USDCHF Edges Higher; Bullish Phase Remains Intact
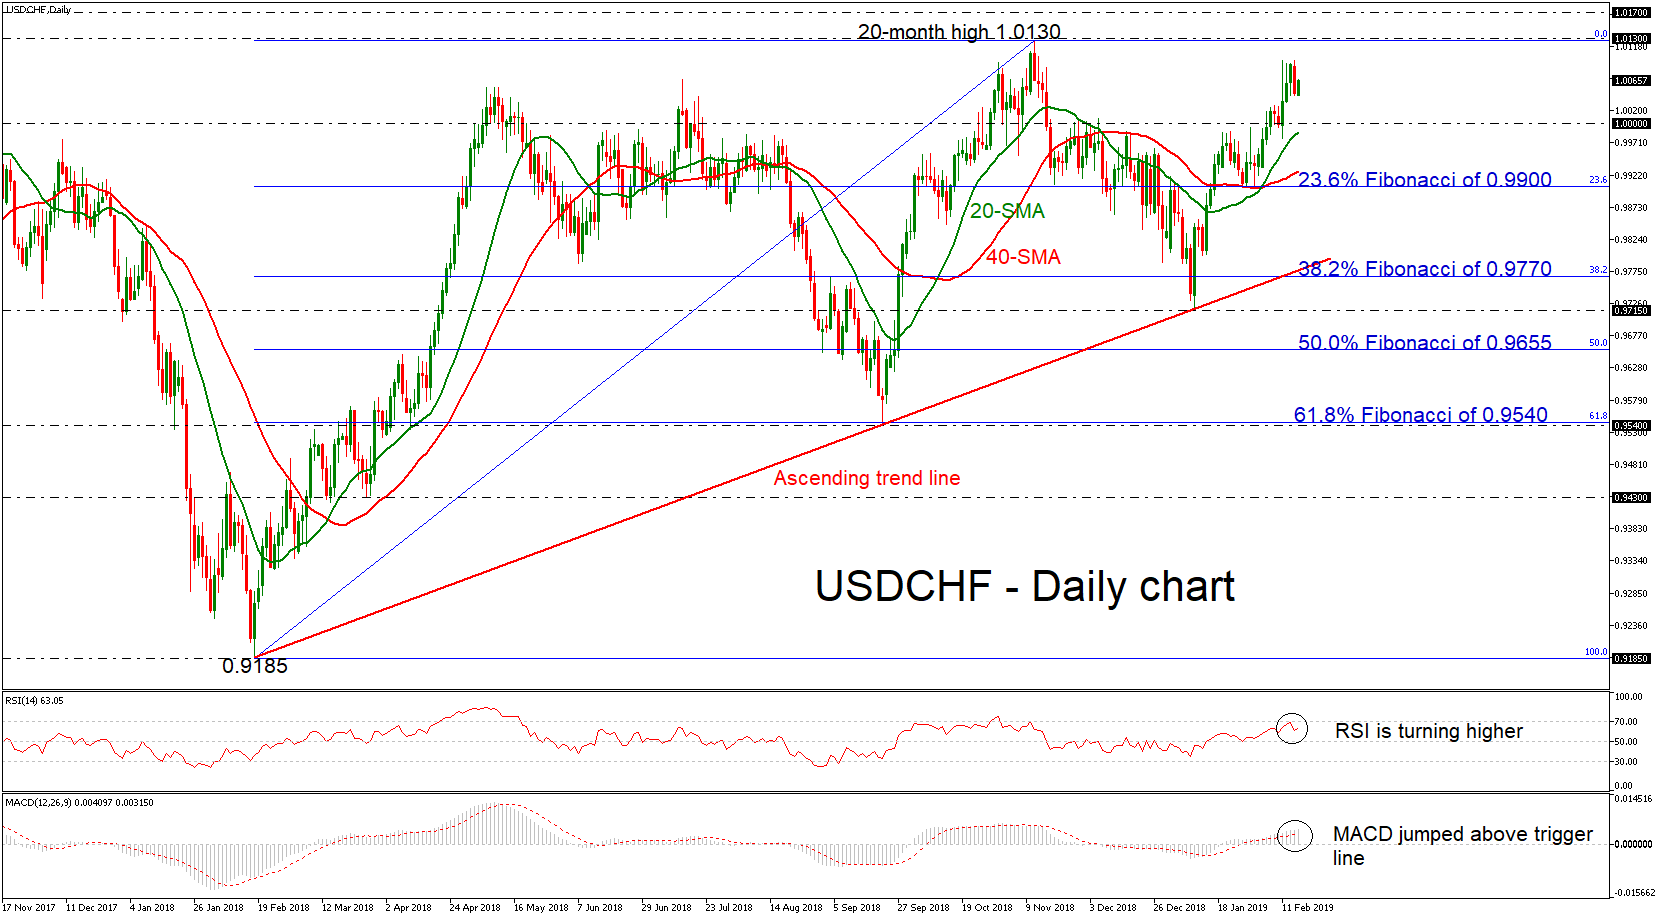
USDCHF has moved considerably higher after the touch on the ascending trend line, recording a new three-month high of 1.0097 on Thursday. The price climbed well above the 20- and 40-simple moving averages (SMAs) in the daily timeframe, while the RSI is sloping marginally up in the positive zone and the MACD oscillator is strengthening its momentum above the trigger and zero lines.
Should the pair continue to head higher the next level to have in mind is the 20-month high of 1.0130, achieved on November 13. A successful break of this barrier would endorse the bullish tendency and open the way towards 1.0170, identified by the peak on March 2017, while steeper increases could open the way towards the 1.0340 resistance, taken from the highs on December 2016.
On the flipside, if the price slips below the strong psychological level of 1.0000, this could endorse chances for downside movements until the immediate support of the 20-day SMA currently at 0.9990. Below this level, the pair could stop around the 40-day SMA around 0.9925 and then at the 23.6% Fibonacci region of 0.9900.
In the medium-term, the outlook should remain strongly bullish if the price fails to slip beneath the significant diagonal line, which has been standing since February 2018.
GBPJPY Tests the Lower Boundary of the Descending Channel
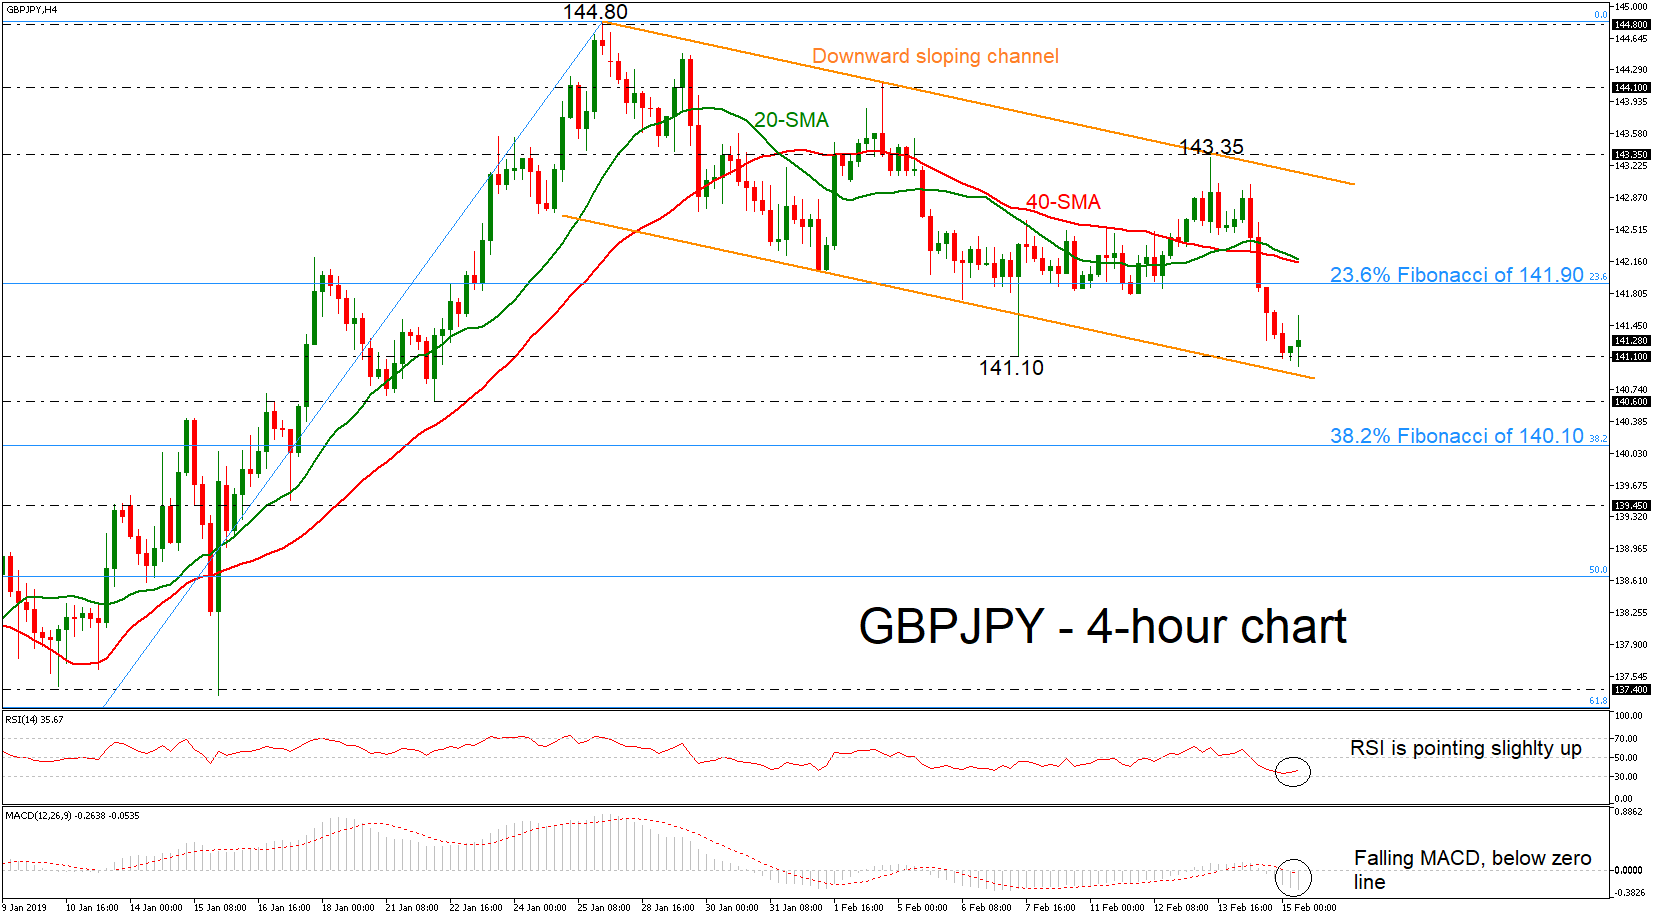
GBPJPY has been trading within a negatively sloping channel over the last three weeks, with the bears challenging the lower boundary today. Currently, the price holds well below the 20-and 40-simple moving averages (SMAs) in the 4-hour chart, which are ready to post a bearish crossover.
Having a look at the technical indicators, the RSI is sloping slightly up in the bearish area, suggesting an upside retracement in the short-term. However, as long as the indicator holds below 50 and the MACD oscillator keeps strengthening to the downside and below its red trigger line, negative risks remain in the background.
In case the pair drops below the 141.10 support and the diagonal line, the bears may pick up steam towards the 140.60 barrier, taken from the low on January 22. A break lower, would endorse the recent negative structure, pushing the pair towards 140.10, the 38.2% Fibonacci retracement level of the upleg from 132.48 to 144.80.
Alternatively, a recovery could open the way towards the 23.6% Fibonacci of 141.90 resistance zone before the focus shifts to 142.15, where the simple moving averages are currently located. Above the latter, the 143.35 resistance could act as significant obstacle. Prior that, however, the bulls need to break the descending trend line currently seen at 143.
The market’s structure remains negative this month and only a jump above the ascending channel would change the outlook to a more bullish one.
DAX Jumps As Investors Remain Hopeful On US-China Trade Rift
The DAX has posted strong gains in the Friday session. Currently, the DAX is at 11,192, up 0.92% on the day. It’s a light day on the fundamental calendar, with no major releases. The eurozone trade surplus widened to EUR 15.6 billion, matching the estimate.
Economic growth in German and the eurozone has slowed, as underscored by disappointing GDP numbers this week. Nonetheless, investors remain optimistic, as the DAX has posted strong gains of 2.4% this week, erasing the losses from the previous week. German Preliminary GDP was flat at 0.0% in the fourth quarter, after a decline of 0.2% in the third quarter. The eurozone’s largest economy managed to avoid a technical recession, which is two consecutive declines in quarterly growth. Germany’s manufacturing industry is limping, with factory orders and industry production posting declines in December. Eurozone Flash GDP remained stuck at 0.2 in Q4%, shy of the forecast of 0.3%. On an annualized basis, fourth quarter growth was 0.9% in Germany and 1.2% in eurozone, both weaker than the third quarter numbers. If eurozone and German data remains soft in the first quarter, the DAX could lose ground.
The trade conflict between the U.S. and China has taken a toll on global growth and world stock markets, but investors are feeling more optimistic. A third round of talks ended in Beijing on Thursday, with Treasury Secretary Mnuchin calling them “productive”. Still, with no breakthrough in the offing, the big question is will President Trump suspend the March 1 deadline to impose new tariffs on China. The U.S. has threatened to raise tariffs on some $200 billion of Chinese goods from 10% to 25%, but Trump has said he could let the deadline pass if there is progress in the talks. On Thursday, China announced that exports had jumped 9.1% in January on an annualized basis, compared to the forecast of -3.2%. This was a strong rebound from December, when exports fell 4.4%.
EUR/USD – Euro Calm On Light Calendar
EUR/USD has posted small losses in the Friday session. Currently, the pair is trading at 1.1273, down 0.19% on the day. On the release front, the eurozone trade surplus widened to EUR 15.6 billion, matching the estimate. In the U.S., the Empire State Manufacturing Index is expected to rise to 7.1 and UoM consumer sentiment is projected to climb to 93.3 points.
Economic activity in the eurozone remains weak, which has weighed on the euro. EUR/USD dipped to 1.1249 on Thursday, its lowest level since mid-November. On Thursday, Germany and the eurozone released fourth quarter GDP data, and the numbers were a disappointment. German Preliminary GDP was flat at 0.0%, after a decline of 0.2% in the third quarter. The eurozone’s largest economy managed to avoid a technical recession, which is two consecutive declines in quarterly growth. Germany’s manufacturing industry is limping, with factory orders and industry production posting declines in December. Eurozone Flash GDP remained stuck at 0.2%, shy of the forecast of 0.3%. On an annualized basis, fourth quarter growth was 0.9% in Germany and 1.2% in eurozone, both weaker than the third quarter numbers. If eurozone and German data continues to sag, traders can expect the euro to lose ground in the near term.
In the U.S., consumer data has been dismal in January. Retail sales and core retail sales showed sharp contraction, and these numbers came on the heels of soft inflation indicators. Inflation remains low, despite a solid U.S. economy and strong labor market. CPI showed no change in January, and has failed to post a gain since November. Core CPI has recorded weak gains of 0.2% for four successive months. On an annualized basis, CPI gained 1.6% in January, the weakest year-over-year gain since mid-2017. The soft inflation numbers were a result of low energy prices, which fell 3.1% in January as oil prices remain under pressure
Futures Continue To Pare Gains
Futures lower again after weak spending figures
US futures are looking a little soft ahead of the open on Wall Street, with sentiment appearing to have taken a small hit from the surprisingly weak retail sales data on Thursday.
I always find it a little strange when traders overreact to single economic releases and think that there's likely more behind the move, even if this appears to be the catalyst. The markets have been on a very good run this year and I think it's natural that we're maybe seeing some profit taking.
We're still around 5% off the highs prior to the sell-off in the fourth quarter but compared to where we were around Christmas, that's a positive not a negative. We're seeing progress in trade talks between the US and China, another shutdown has been averted and the Fed has become considerably less hawkish. I don't see reason to panic over one piece of bad data. Of course, people will now be more vigilant though, looking for further signs that all is not well on main street and it appears on Wall Street.
USD stalls and gold capitalises on weakness
The data on Thursday has clearly taken some of the spark out of the US dollar rally, a rally that prior to Thursday had suffered only one losing day in 10. Today the dollar is back trading in the green but only marginally. The dollar faces numerous headwinds now, including extra scrutiny of the data, a more dovish Fed and, of course, the trade talks between Washington and Beijing.
As we've seen on numerous occasions recently, gold was not so much dragged lower by the dollar rally but it did consolidate. As soon as the dollar displayed some weakness though, the yellow metal was on the rise again, finding itself back at the top end of the $1,300/$1,320 range. Gold bulls must feel very encouraged by this response having failed to see a real test of $1,300 throughout a challenging 10-day period.
Oil bulls getting excited?
Gold isn't the only commodity that capitalised on the weaker dollar, with oil also seizing the opportunity to drive towards previous peaks and an area that could once again offer strong resistance. WTI crude is facing significant potential resistance around $55, a break of which could be the catalyst for a substantial move higher.
There's a very mixed picture for oil on the fundamentals side, with record US output, slower global growth expectations and question marks around Russian compliance with the output cut acting as a major barrier to the upside for prices. The flipside of that though is the falling US oil rig numbers, commitment by OPEC+ to cut – which has been successful in the past – and Saudi Arabia's commitment to go further and cut an extra 500,000 barrels. On top of that, risk appetite has been on the mend, which is supportive for prices. I guess we'll see shortly which side the broader market is on.
EURUSD Further Weakness Expected
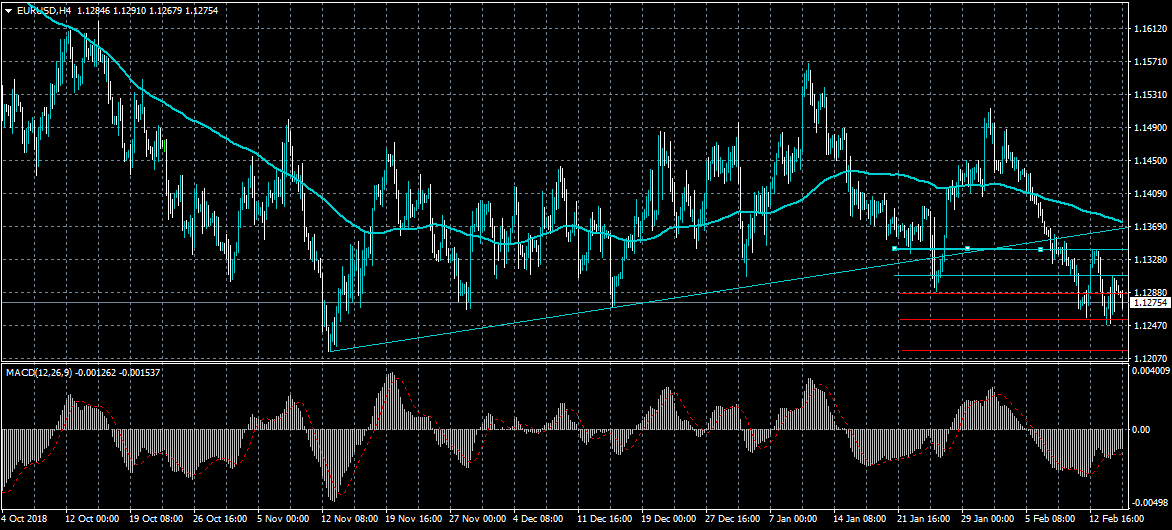
The euro continues to edge lower against the US dollar on Friday, with the single currency coming under selling pressure over fears about possible US trade tariff on German imports. The key technical support region to watch is 1.1260 level, sustained weakness below this area is likely to provoke selling towards the 1.1215 level. The 1.1310 level is currently proving strong resistance on any short-term technical corrections higher.
The EURUSD pair is heavily bearish while trading below the 1.1260 level, key technical support is found at the 1.1248 and 1.1215 levels.
If the EURUSD pair moves above the 1.1290 level, buyers may test towards the 1.1310 and 1.1330 resistance levels.
GBPUSD 1.2830 Level Key Resistance
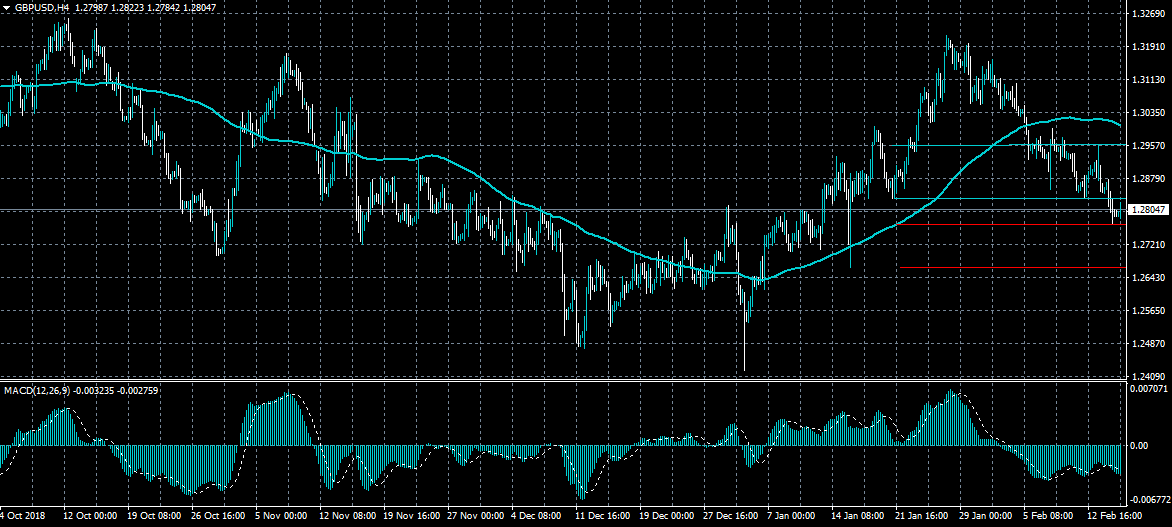
The British pound has started to trade above the 1.2800 level against the US dollar after UK Retail Sales data came in much better than markets had been expecting. GBPUSD buyers need to move price above the 1.2830 level to negate the bearish intraday outlook surrounding the pair. If sellers move price below the 1.2790 level, a further decline towards the 1.2740 level remains possible.
The GBPUSD pair is only bearish while trading below the 1.2830 level, key technical support is found at the 1.2790 and 1.2740 levels
If the GBPUSD pair moves above the 1.2830 level, buyers may test towards the 1.2880 and 1.2960 levels.
Brent Oil Outlook: Brent Hits New 2019 High
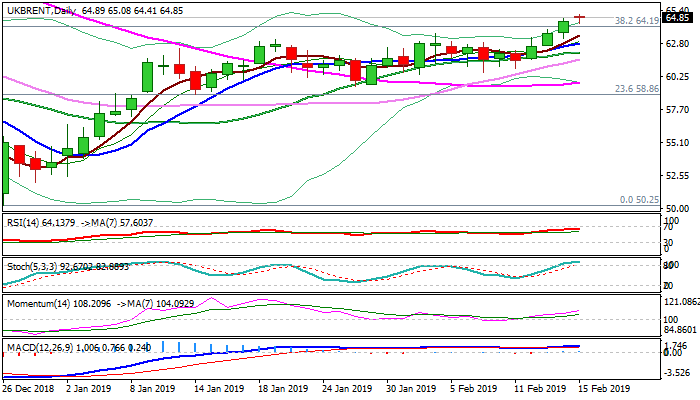
Brent oil cracked psychological $65.00 barrier on Friday and hit new 2019, in extension of the rally in past three days which generated bullish signal on Thursday's close above pivotal barriers at $64.12/19 (daily cloud top / Fibo 38.2% of $86.73/$50.25 fall). Weekly close above these barriers is needed to confirm break and expose next strong barriers at $65.47 (weekly cloud base) and $66.33 (falling 100SMA). Output reduction by world top oil exporters, which aims to tighten oil markets, boosts the price and for now offsets negative impact on concerns about global growth slowdown. Overbought conditions on both, daily and weekly chart, warn that bulls my lose traction ahead of strong barriers. Consolidative action should ideally hold above daily cloud, however, deeper dips are expected to find ground above rising daily Tenkan-sen ($62.80) to keep immediate bulls in play.
Res: 65.08, 65.47, 66.84, 68.35
Sup: 64.41, 64.12, 63.25, 62.80
China Xi: Trade talks to continue in Washington next week
Chinese President Xi Jinping met US Trade Representative Robert Lighthizer and Treasury Secretary Steven Mnuchin at the Great Hall of the People in Beijing today, as the week-long trade negotiations conclude.
According to a report by the official Xinhua, Xi said that the talks will continue in Washington next week. And he hoped that both sides would reach a mutually beneficial deal.
Xinhua also reported that Lighthizer and Mnuchin said in-depth discussions were held in the past two days. New progress has been made on difficult issues. But there is still a lot of work to be done.
WTI Oil Outlook: Bulls Probe Above Daily Cloud As OPEC Production Cut Underpins Oil Prices
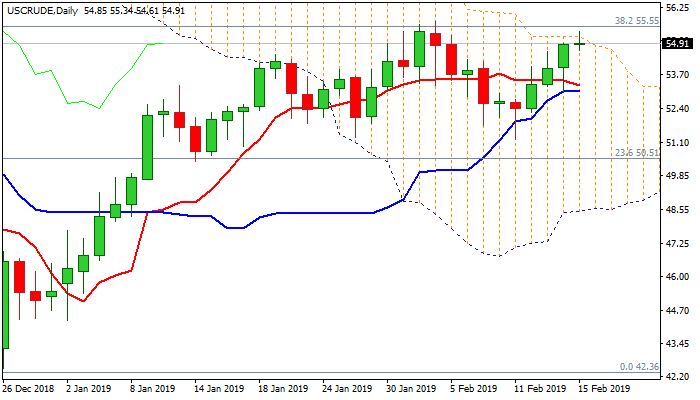
WTI oil price cracked the top of falling daily cloud ($55.15) on Friday, extending advance into fourth straight day.
Voluntary production cut by OPEC members and their allies in order to tighten oil market, started giving results, with signals for increased reduction by over half a million bpd in March, adding to positive outlook.
Also, partial closure Saudi Arabia’s biggest offshore oilfield, provided additional boost to oil prices.
Bullish daily techs remain supportive for renewed attack at $55.55 Fibo barrier and $55.73 (2019 high posted on 4 Feb), break of which would expose falling 100SMA ($57.24).
Initial bullish signal could be expected from close above cloud top, however, bulls may show hesitation on approach to $55.55/73 barriers as daily stochastic is overbought.
Converged daily 10/20SMA’s ($53.71/53) offer solid support, which is expected to contain extended downticks and keep immediate bulls intact.
Res: 55.15, 55.55, 55.73, 57.24
Sup: 54.61, 53.71, 53.53, 53.07