

Sample Category Title
EUR/JPY Builds Bearish ABC Correction In Wave 2
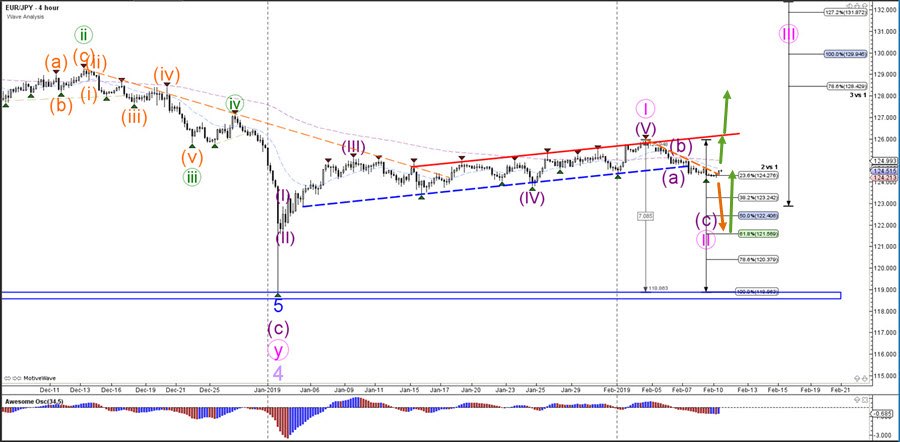
EUR/JPY seems to be building a bearish pullback towards the Fibonacci retracement levels of wave 2 (pink). A break below the 100% Fibonacci level of wave 2 vs 1 (pink) would invalidate the wave 2 (pink) pattern.
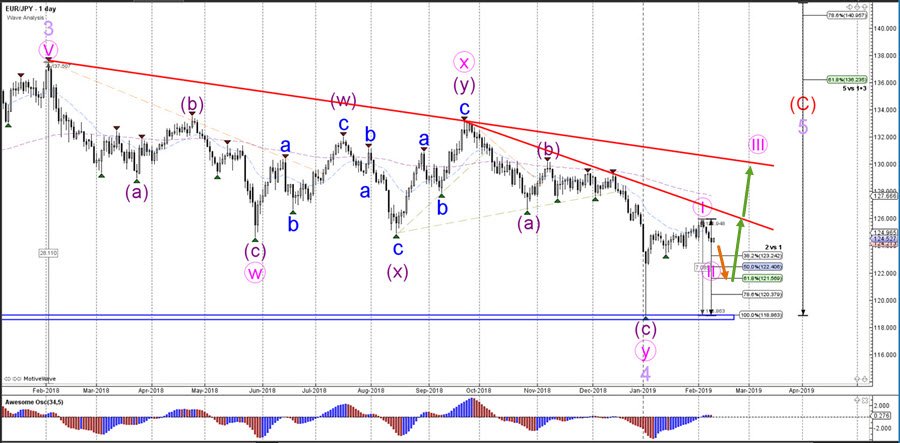
EUR/JPY seems to be completing a bearish ABC (purple) corrective pattern back to the Fibonacci levels of wave 2 (pink). A bullish reversal could take place at one of these Fibonacci levels as long as price stays above the support zone (blue box).
$IBM Long Term Bullish Trend And Elliott Wave Cycles
Firstly I would like to mention Big Blue has been around for over 100 years since it was founded. I have price data that goes back to the 1960’s when the stock price was around three dollars. The point of this article is to show what Elliott Wave technical analysis suggests will happen before the stock price resumes the larger uptrend.
Secondly from the early beginnings of the company up to the March 2013 highs was simply a series of higher highs and higher lows. The weekly chart shown below is where this wave analysis begins. This decline appears to be a zig zag Elliott wave corrective structure. These structures subdivide into what wave analysts call a 5-3-5 structure. This means the first cycle ((A)) lower from the March 2013 highs to the February 2016 lows was a five wave impulse. This impulse had some overlap in between the wave (1) and wave (4). Thus it would be considered a diagonal. The bounce in the ((B)) wave connector subdivides into three corrective swings.
The analysis continues below the weekly chart.
IBM Weekly Chart
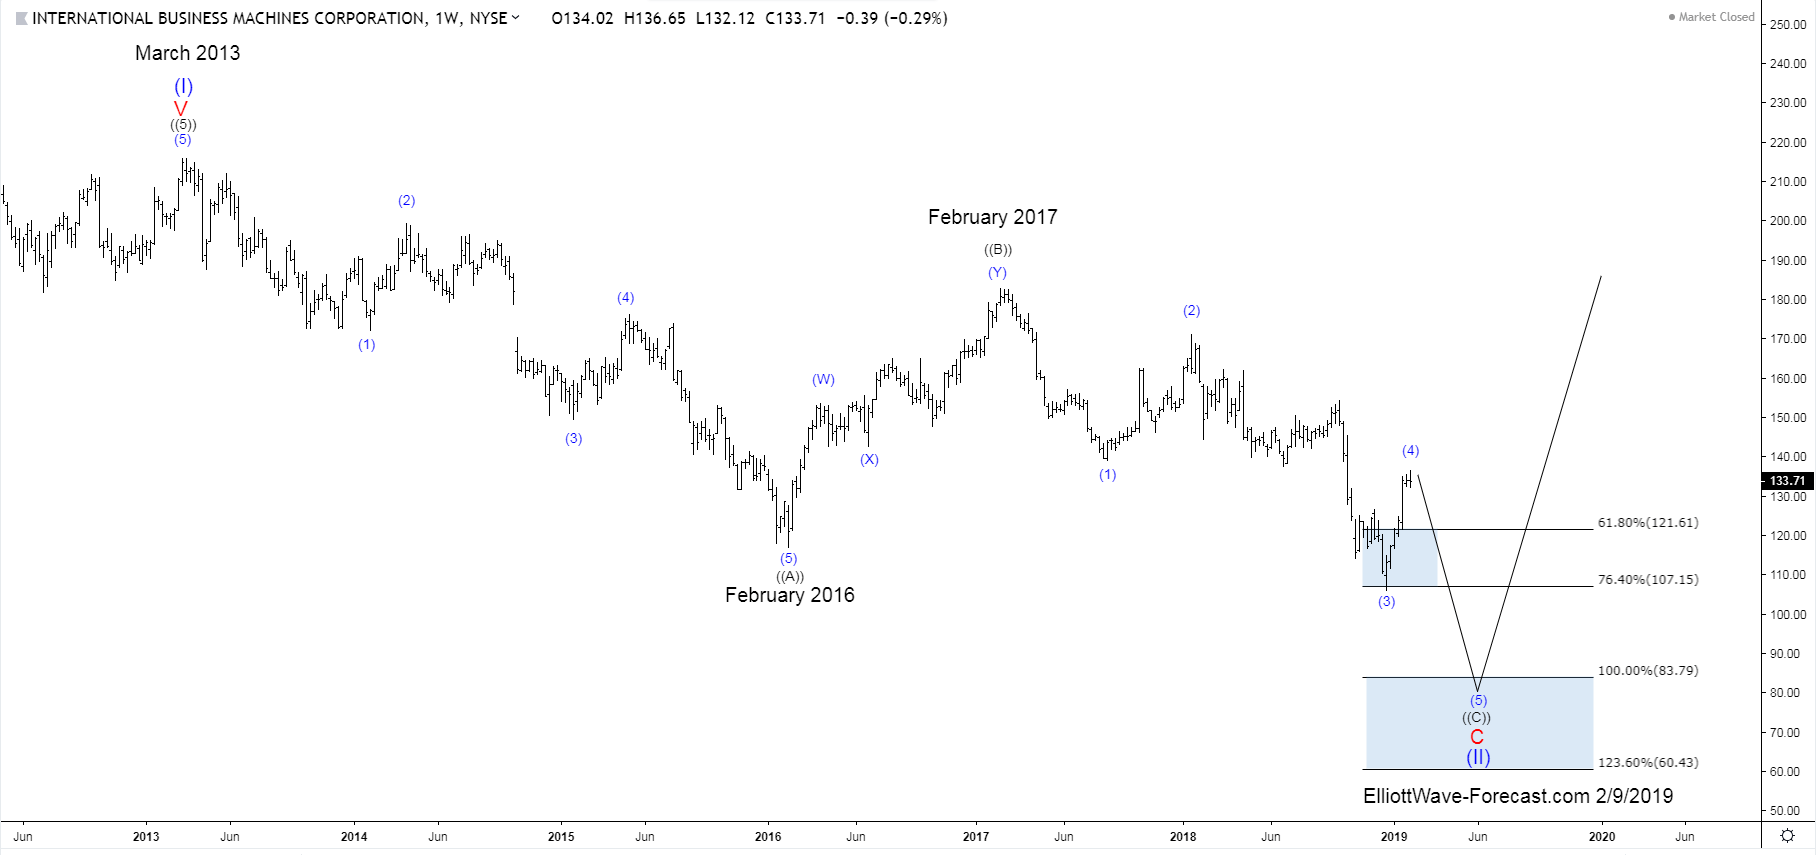
Thirdly from the February 2017 ((B)) highs price has declined in two smaller degree blue (1) & (3) impulse waves. By all means, this is an incomplete larger degree black ((C)) impulse. Currently the wave (4) in blue is correcting the cycle lower from the wave (2) highs. Momentum indicators like RSI should ideally continue showing a lower reading in the wave (4) when compared to the wave (2). Considering the previous impulse wave ((A)) diagonal had some overlap between the wave (1) & (4) it could happen again in the current wave (4) of ((C)). This not a rule requirement. As of right now it appears it may turn back lower without any overlap.
In conclusion as earlier mentioned the sequence lower from February 2017 is incomplete. It is only missing another swing lower under 105.94, the 12/24/18 lows in the impulse ((C)) to finish the zig zag structure. Highlighted on the chart is an ideal area price can reach before resuming the larger uptrend.
USD/CHF Daily Outlook
Daily Pivots: (S1) 0.9989; (P) 1.0009; (R1) 1.0023; More....
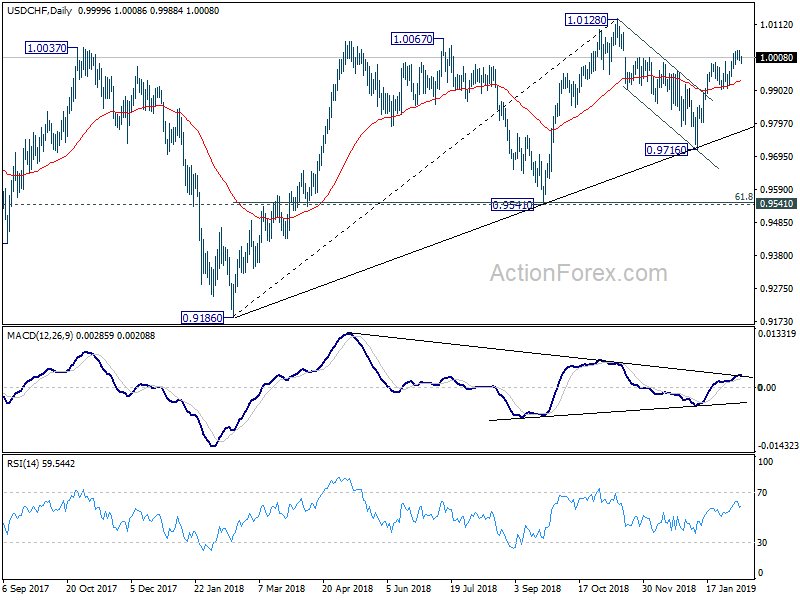
Intraday bias in USD/CHF remains neutral as consolidation from 1.0028 is in progress. In case of another retreat, downside should be contained by 0.9908 to bring another rally. As noted before, corrective decline from 1.0128 should have completed at 0.9716 already, after hitting trend line support. On the upside, above 1.0028 will resume the rise from 0.9716 to retest 1.0128 high next.
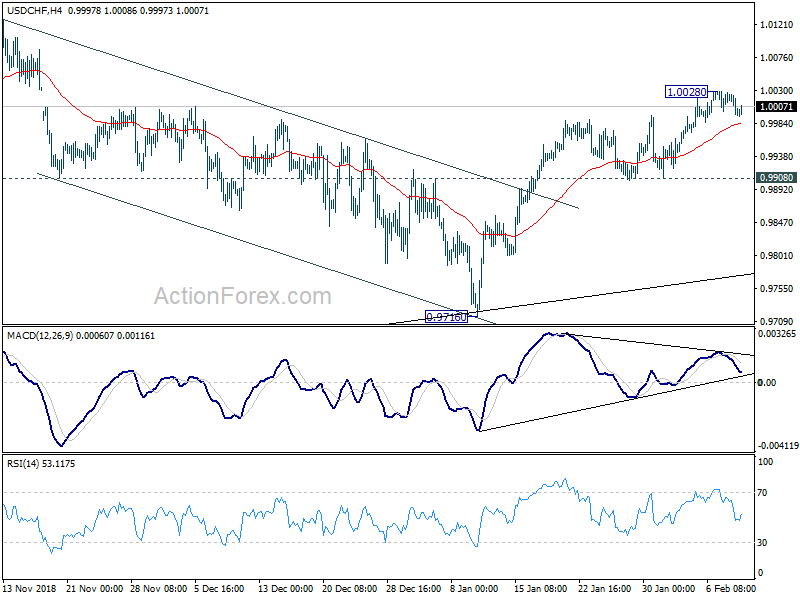
In the bigger picture, USD/CHF drew strong support from medium term trend line and rebounded. That suggests rise from 0.9186 is still in progress. Further break of 1.0128 will confirm up trend resumption and target 1.0342 key resistance. Nevertheless, break of 0.9716 will dampen this bullish view and at least bring deeper fall to 0.9541 key support.
USD/JPY Daily Outlook
Daily Pivots: (S1) 109.59; (P) 109.84; (R1) 110.07; More...
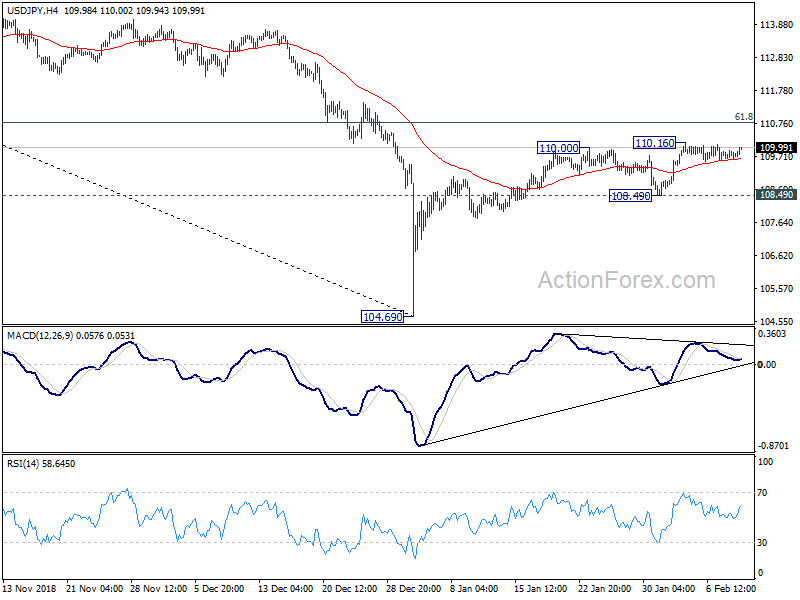
USD/JPY remains bounded in tight range below 110.16 and intraday bias remains neutral first. On the upside, break of 110.16 will extend the rebound from 104.69. But we'd expect strong resistance from 61.8% retracement of 114.54 to 104.69 at 110.77 to limit upside. On the downside, break of 108.49 support will now confirm completion of the rebound and bring retest of 104.69 low. However, sustained trading above 110.77 will dampen our bearish view and target a test on 114.54 resistance instead.
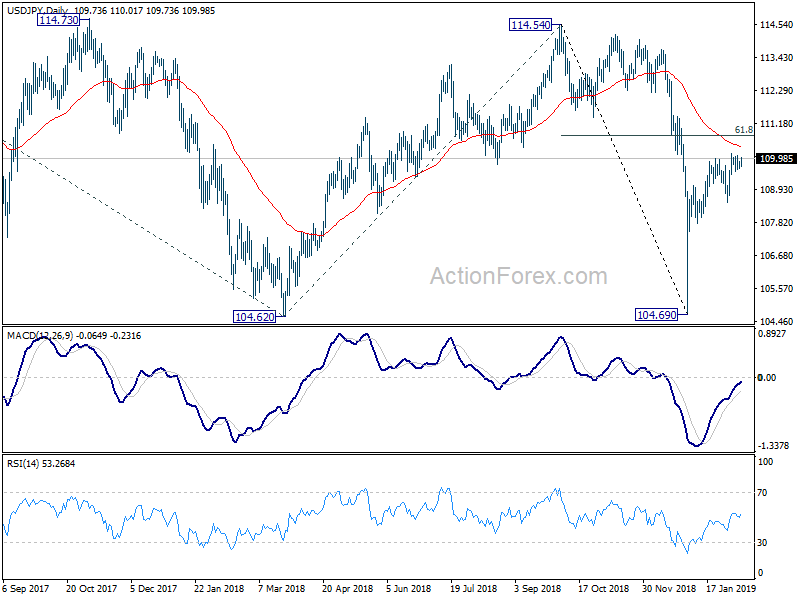
In the bigger picture, while the rebound from 104.69 is strong, there is no change in the view that it's a corrective move. That is, fall from 114.54, as part of the decline from 118.65 (2016 high), is not completed yet. Break of 104.62 will target 100% projection of 118.65 to 104.62 from 114.54 at 100.51, which is close to 100 psychological level. Nevertheless, sustained trading above 55 day EMA (now at 110.41) will dampen this bearish view and turn focus back to 114.54 resistance instead.
EUR/USD Daily Outlook
Daily Pivots: (S1) 1.1312; (P) 1.1332; (R1) 1.1342; More.....
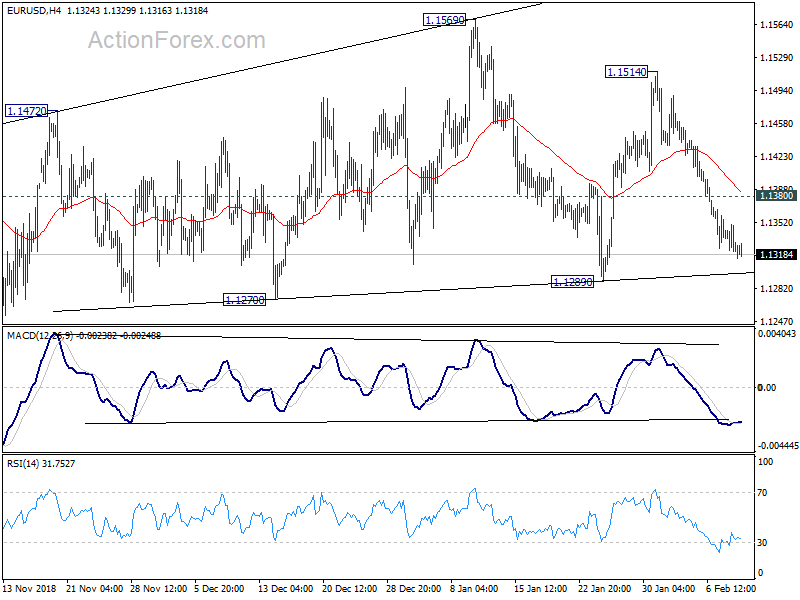
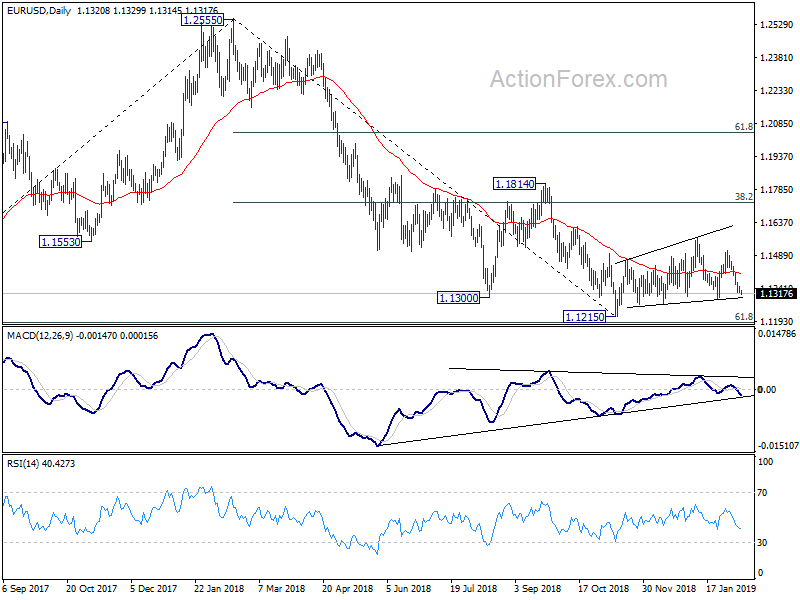
Intraday bias in EUR/USD remains on the downside for 1.1289 support. Firm break of 1.1289 support will argue that corrective pattern from 1.1251 has completed. And, in that case, larger decline from 1.2555 is ready to resume through 1.1251 low. On the upside, above 1.1380 minor resistance will turn intraday bias neutral first.
In the bigger picture, as long as 1.1814 resistance holds, down trend down trend from 1.2555 medium term top is still in progress and should target 61.8% retracement of 1.0339 (2017 low) to 1.2555 at 1.1186 next. Sustained break there will pave the way to retest 1.0339. However, break of 1.1814 will confirm completion of such down trend and turn medium term outlook bullish.
GBPUSD Awaiting Important Data
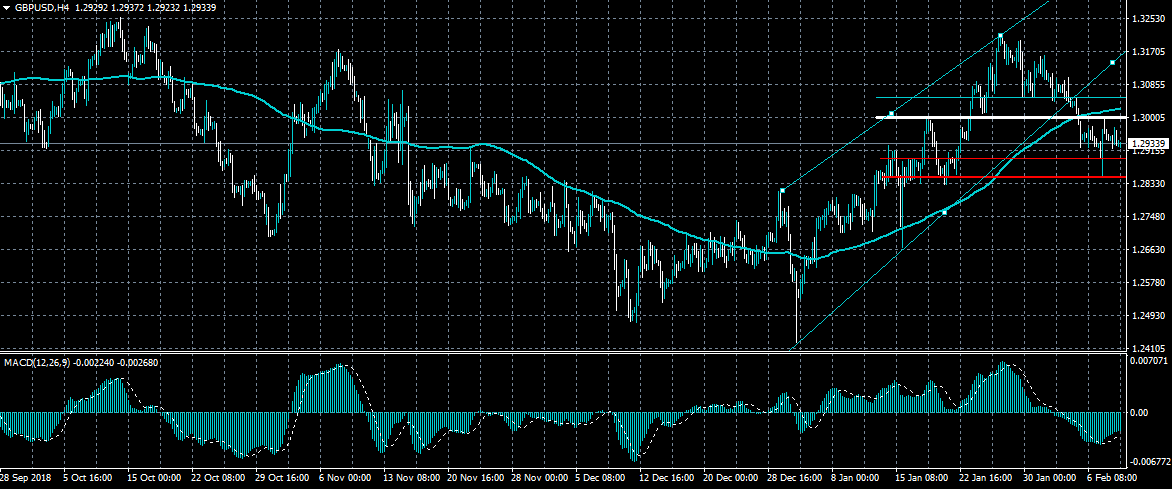
The British pound is slipping lower against the US dollar on Monday after buyers failed to move price above the psychological 1.3000 resistance level. Traders now await the releases of important data from the UK economy this morning, with quarterly GDP data likely to move the GBPUSD pair. Sustained weakness below the 1.2890 level will likely provoke a further technical test of the 1.2850 support area.
The GBPUSD pair is only bearish while trading below the 1.3000 level, key technical support is found at the 1.2890 and 1.2850 levels
If the GBPUSD pair trades above the 1.3000 level, key resistance is found at the 1.3055 and 1.3095 levels.
BTCUSD Further Bullish Above $3,700
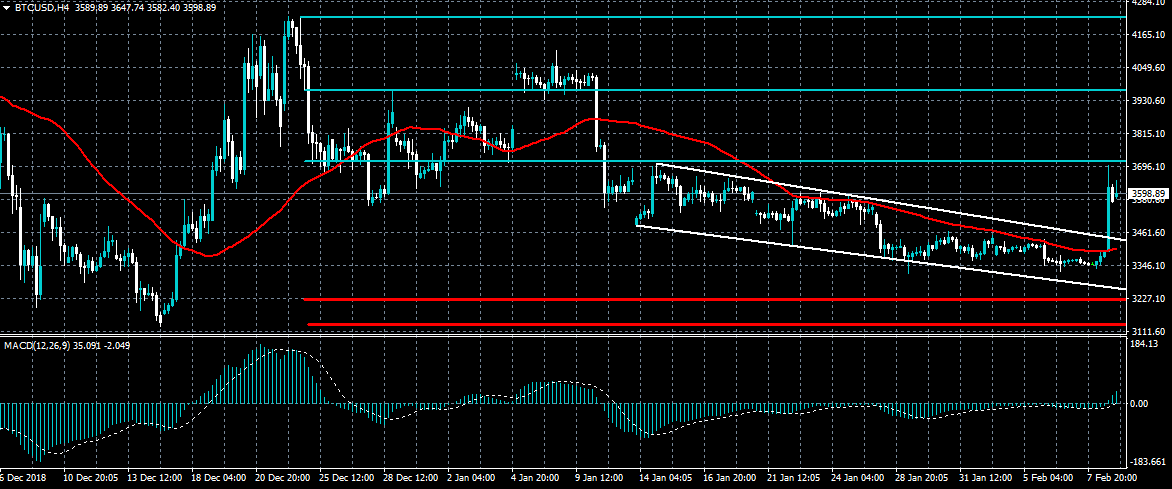
Bitcoin has a bullish short-term bias on Monday after BTCUSD buyers forced price towards the $3,700 resistance, after weeks of price consolidating inside a descending channel. The $3,460 level is now former key resistance turned support, while moves above the $3,700 may provoke a test of the $4,000 level. The Moving Average Convergence Divergence indicator on the four-hour time frame is also starting to trend higher.
The BTCUSD pair is bullish while trading above the $3,460 level, key technical resistance is found at the $3,700 and $4,000 levels.
If the BTCUSD pair trades below the $3,460 level, key support is found at the $3,280 and $3,120 levels.
EURUSD Indicators Rising
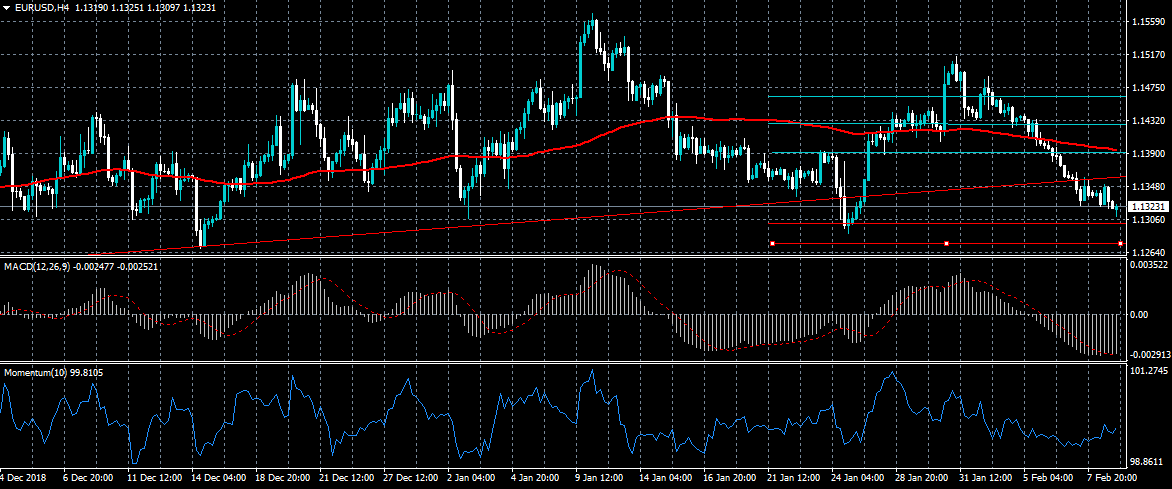
The euro remains under downside pressure against the US dollar in early Monday trading, after a bearish weekly price close near the 1.1300 support level. Technical indicators on the four-hour time frame are rising, although caution is advised given the current weakness in the EURUSD pair. Any technical corrections higher are likely to target the rising trendline, which is located around the 1.1360 level.
The EURUSD pair is bearish while trading below the 1.1360 level, key technical support is found at the 1.1300 and 1.1268 levels.
If the EURUSD pair moves above the 1.1360 level, buyers may test towards the 1.1390 and 1.1428 resistance levels.
Crude Oil Price Falls After Increase In US Oil Rigs
The price of crude oil extended Friday's losses after data from Baker Hughes showed a ramp up in activity in the United States. Over the past week, US drillers added 7 new rigs, bringing the total to 584. This is an indication that oil production, which stands at more than 11.7 million barrels a day, will continue to increase. The price was supported slightly by a huge fire that happened in a Phillips 66 refinery that processes more than 120K barrels a day.
Sterling was little moved in today's trading ahead of key data from the United Kingdom. The Office of National Statistics (ONS) will release the GDP numbers. The second reading of the GDP is expected to show that the economy expanded by 1.4%, which will be lower than the previously-released 1.5%. On a QoQ basis, the economy is expected to expand by 0.3%. The manufacturing production for December is expected to have risen by 0.2%, while the construction output is expected to have risen by 1.5%. This will be lower than the 3.0% increase for November. The trade deficit is expected to have reduced to 12 billion pounds.
Chinese stocks were higher in today's trading as investors returned to the market after a week of holidays. Last week, the Chinese celebrated the Lunar New Year, a period in which the market is usually closed. The Shanghai and Hang Seng indexes rose by 0.83% and 0.15% respectively. In the United States, futures pointed to a lower open after reports that talks between the democrats and republicans on border wall funding had broken down. This means that a government shutdown will likely happen later this week.
EUR/USD
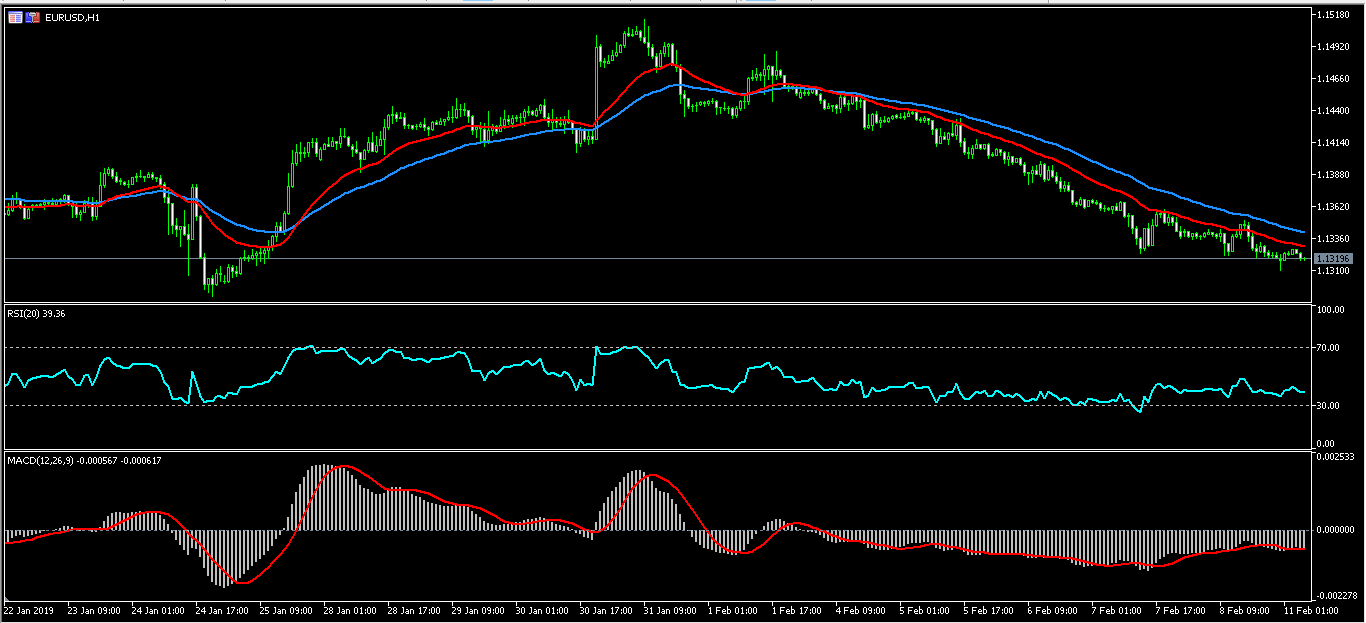
The EUR/USD pair was little moved in the Asian session today. The pair is trading at 1.1320, which is closer to last week's low of 1.1310. In the past two weeks, the pair has been on a downward trajectory, falling from the previous high of 1.1515. On the hourly chart, the pair remains below the 25-day and 50-day moving averages. The 20-day RSI is relatively unmoved at the 40s while the MACD remains at the oversold level. While the pair will likely continue the downward trend, traders should watch out for the important support of 1.1288.
GBP/JPY
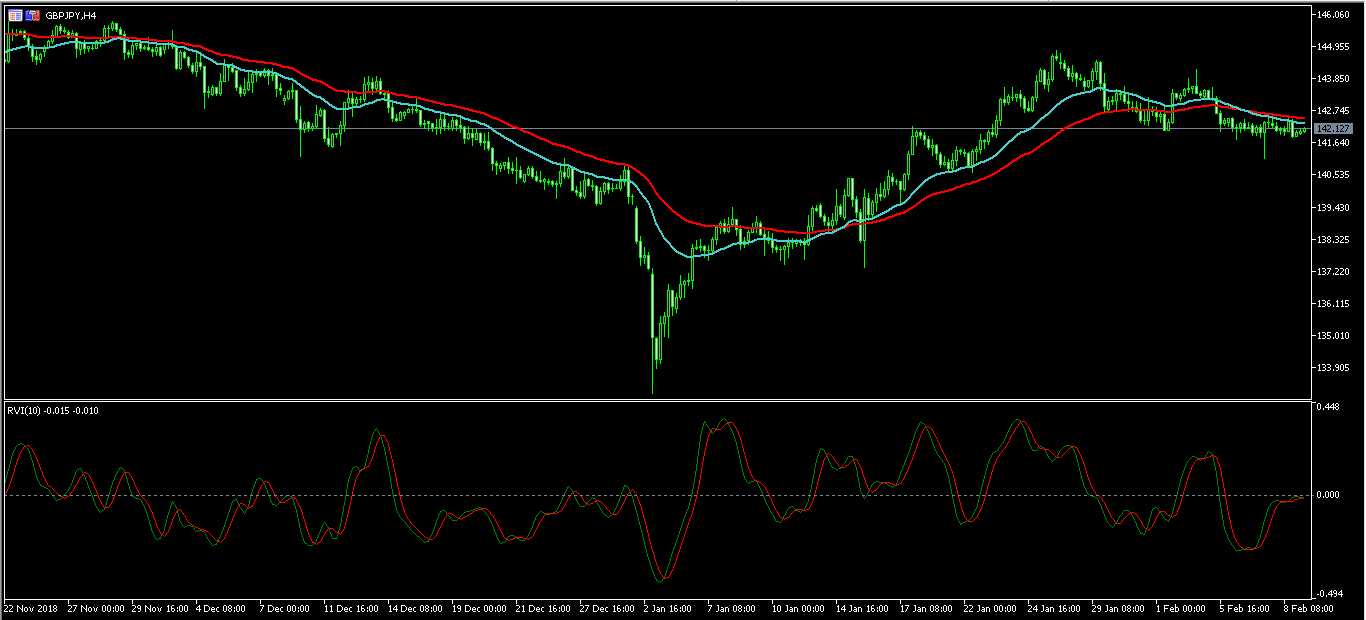
The GBP/JPY cross was little moved ahead of key economic data from the UK. The market in Japan is also closed for the country's founding day celebrations. The pair is now trading at 142.15, which is where it closed last week. This price is also slightly lower than the 25-day and 50-day EMA. The Relative Vigor Index is at the neutral level. There is a likelihood that the pair's movements today will depend on data from the United Kingdom.
XBR/USD
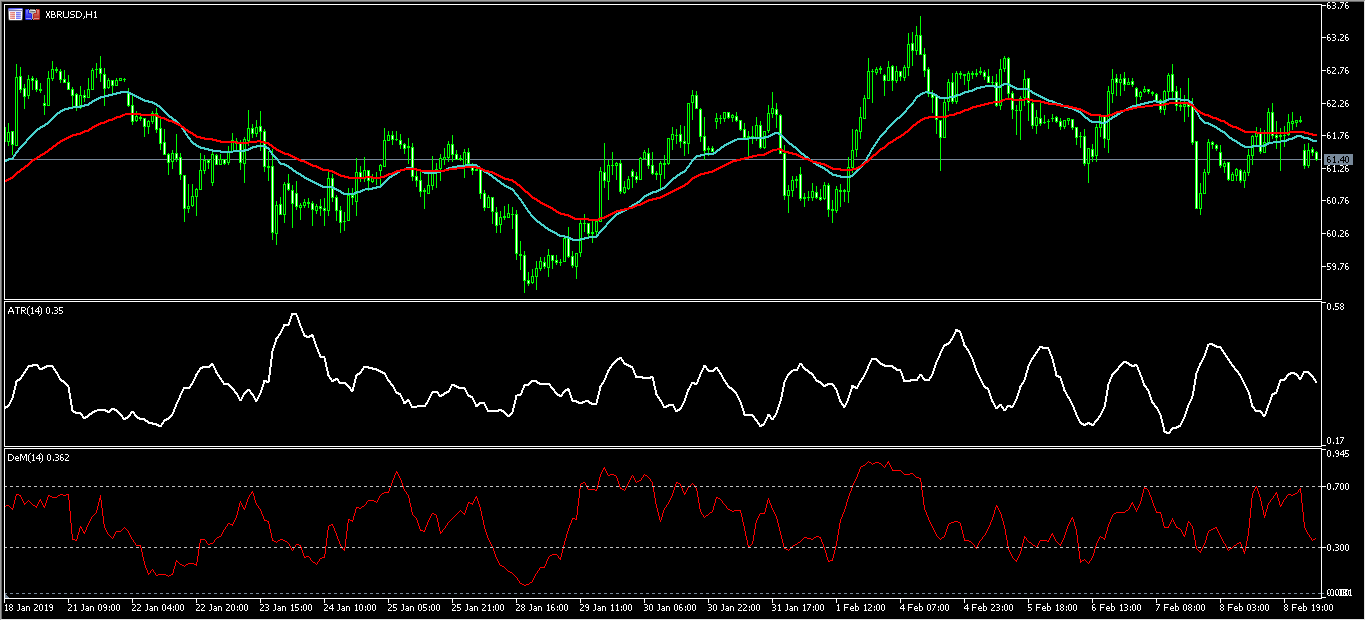
The price of Brent crude oil declined after weekend news. The pair reached an intraday low of 61.24. The hourly chart shows how volatile the pair has been, which is also evidenced by the Average True Range (ATR) indicator. The current price of 61.40 is below the 25-day and 50-day EMA. The DeMarker indicator has declined closer to the oversold level. Today, there is a likelihood that the pair will continue to show volatility as investors react to more news from OPEC and US
Deadlines Are Fast Approaching
After a strong rally in risky assets since the beginning of 2019, anxiety and concerns over global economic growth have returned. This was evident in currency markets last week where inflows returned to the U.S. Dollar despite a dovish Fed. Equity markets in Europe hit a wall with the Stoxx 600 endinga five-week winning streak.Meanwhile, U.S. investors are becoming worried about fading profits and possibly an earnings recession.
A better gauge of economic and financial conditions is to look at what fixed-income markets are pricing. Japan's 10-year bond yields have fallen below zeroonce again, the German 10-year Bunds yields are trading at their lowest level since October 2016, and U.S. 10-year yields are 19.3% below the peak reached in October. While it doesn't necessarily mean a recession is near, fixed-income markets are indicating a significant slowdown in global economic growth.
This week is a big one for financial markets. The 90 days U.S.-China trade truce ends on March 1 and failing to reach an agreement by then could lead to more than double the current American tariffs on Chinese goods. According to a Wall Street Journal report, the two sides have not even drafted an accord that specifies where they agree and disagree. With U.S. trade representative and the Treasury Secretary headed to Beijing to kick-start a new round of trade talks in Beijing today, markets are anticipating some good news. This is reflected in Chinese equities which advanced today after a week-long national holiday. However, investors need to manage their expectations especially with conflicting messages from President Trump.
The clock is also ticking fast for the UK. With only 46 days remaining until Britain is scheduled to exit the EU, no one knows yet what will happen next and what version of Brexit will be achieved. This week Prime Minister Theresa May needs to deliver a statement to Parliament on what progress hasbeen accomplished and from what we know, nothing significant. Chances are high that MPs will file a motion to have greater control overthe Brexit process and possibly extending the Article 50 deadline. A step closer to extending the deadline may see Sterling bouncing back above 1.32. On the data front, investors will keep a close eye on the UK's final quarter GDP, and industrial production data due to be released later today.
We also have important data on the U.S. calendar this week. Inflation figures due to be released on Wednesday will provide further insight into whether the Fed's judgment of the U.S. economy was accurate. Retail sales is also another important piece of information, and we'll get to see if the recent turmoil in equity markets has affected spending habits.