Sample Category Title
EUR/USD At Clear Risk Of Further Declines
Key Highlights
The Euro formed a significant top at 1.1514 and declined heavily against the US Dollar.
EUR/USD broke a few important supports such as 1.1440 and 1.1400.
The German Trade Balance in Dec 2018 posted a surplus of €19.4B, better than the €18.4B forecast.
UK GDP for Q4 2016 (Preliminary) will be released today, which could grow 0.2% (QoQ).
EURUSD Technical Analysis
After trading as high as 1.1514, the Euro started a major downward move against the US Dollar. The EUR/USD pair gained bearish momentum and broke key supports near the 1.1400 level.
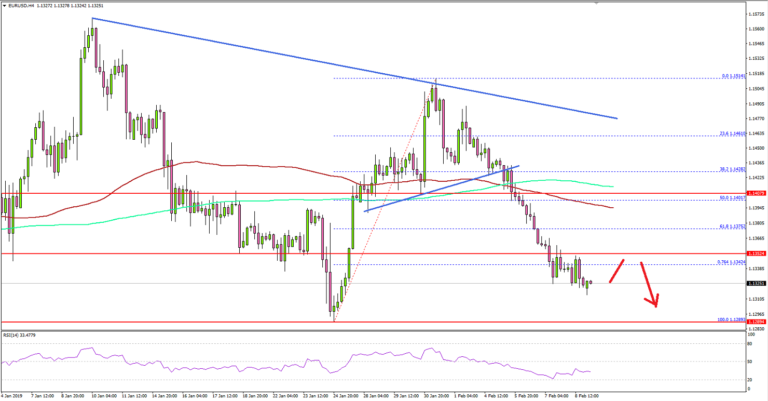
Looking at the 4-hours chart, the pair clearly moved into a bearish zone below the 1.1400 support plus the 100 (red) simple moving average (4-hours) and 200 (green) simple moving average (4-hours).
During the decline, there was a break below the 61.8% Fib retracement level of the last wave from the 1.1289 low to 1.1514 high. Moreover, there was a break below a connecting bullish trend line, with support at 1.1428 on the same chart.
The pair is now trading well below the 1.1360 support and the 76.4% Fib retracement level of the last wave from the 1.1289 low to 1.1514 high. Therefore, there is a risk of further declines towards the 1.1289 low or the 1.1260 support level.
If there is an upside correction, the previous supports at 1.1360, 1.1380 and 1.1400 are likely to act as strong resistances for buyers in the near term.
Fundamentally, the German Trade Balance report for Dec 2018 was released this past Friday by the Statistisches Bundesamt Deutschland. The market was looking for a trade surplus of €18.4B, compared with the last €19.0B.
However, the result was better than the forecast as there was a surplus of €19.4B, but the last reading was revised down from €19.0B to €18.9B. Exports of goods and services in Dec 2018 increased 1.5%, better than the last -0.3% (revised), and Imports of goods and services increased 1.2%.
The report added that:
Based on provisional data, German exports increased by 3.0% and imports by 5.7% in 2018 year on year. Exports and imports in 2018 exceeded the record highs recorded in 2017 when goods had been exported to the value of 1,279.0 billion euros and imported to the value of 1,031.0 billion euros.
The current price action suggests a bearish structure for EUR/USD, which could result in more losses in the coming sessions.
Economic Releases to Watch Today
- Swiss CPI for Jan 2019 (YoY) – Forecast +0.6%, versus +0.7% previous.
- UK GDP for Q4 2016 (Preliminary) (QoQ) – Forecast +0.2%, versus +0.6% previous.
- UK Industrial Production for Dec 2018 (MoM) – Forecast -0.2%, versus -0.4% previous.
- UK Manufacturing Production for Dec 2018 (MoM) – Forecast +0.1%, versus -0.3% previous.
- UK Trade Balance non-EU for Dec 2018 – Forecast £-3.592B, versus £-3.925B previous.
Daily Markets Broadcast
Wall Street steady as next trade talks loom
US officials will be in Beijing again Thursday-Friday, hoping to build on the positive vibes from the two meetings in January. China markets reopen after a one week break while Japan markets are closed for a public holiday.
US30USD Daily Chart
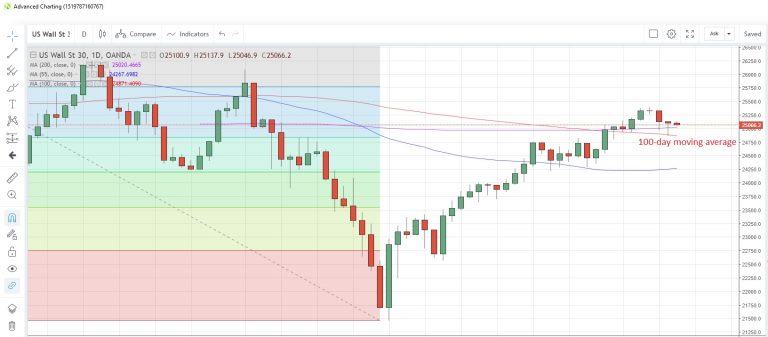
The US30 index closed marginally lower on Friday, posting its third consecutive daily loss and recording a weekly decline for the first time in three weeks
The index tested support at the 100-day moving average of 24,888, but this held. It’s at 24,871 today
Talks to avert another US government shutdown broke down at the weekend. The deadline for a resolution is this Friday. There are no major data releases scheduled for today.
DE30EUR Daily Chart
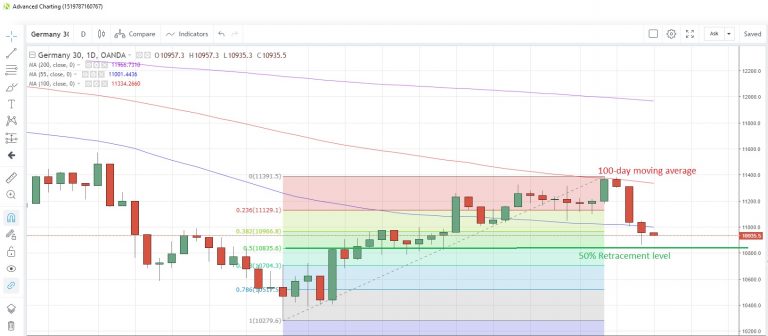
The Germany30 index fell for a third straight day Friday despite positive trade data from Germany. Brexit uncertainty still manifesting itself as the UK Parliament votes again on a new Brexit deal this week
The index closed below the 55-day moving average for the first time since January 23. Support may come at the 50% retracement level of the run-up which lasted from December 27 to February 5, which is at 10,835
Germany’s trade surplus widened to EUR19.4b in December, the highest since May last year, as exports surprisingly rose 1.5% m/m.
CN50USD Daily Chart
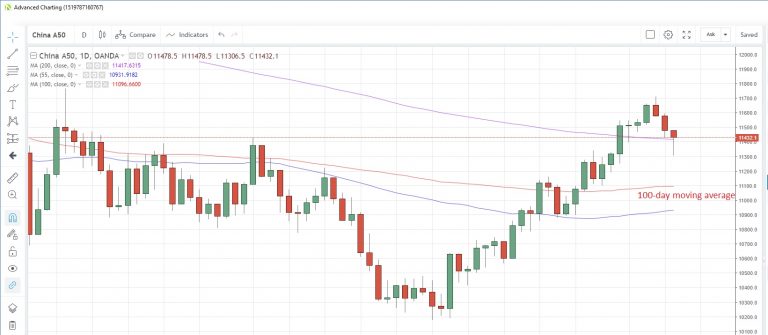
China shares trade for the first time in a week after the Lunar New Year break, and are expected to open lower, echoing the move seen in Hong Kong on Friday
The 100-day moving average is at 11,096, which could act as a support level
The issue of trade negotiations will undoubetedly keep China markers nervous in the run-up to the meetings at the end of this week. On the data front, new loans for January are expected to show a jump to 2.8 billion yuan after a 1.08 billion yuan print in December.
Will The US And China Finally Share Their Toys?
The markets limped to a tepid close on Friday with stocks broadly flat and the US dollar broadly ascendant. Politics rather than data will overshadow the markets this week with US Trade Representative Robert Lighthizer and Secretary of the Treasury Steven Mnuchin heading to Beijing for another round of trade talks.
There's a sense of urgency to this round because the US has imposed a 1 March deadline by which time they expect the Chinese to put a deal on the table. If no deal is agreed by then, a belligerent President Trump and US Congress will be more than willing to simply extend the trade war so China will need to make the first move if they are to reach a détente.
Somewhat lost amongst the trade talk noise, the US is facing another government shutdown from this Friday. The Democrats have thrown a few bones, but neither side is talking directly, which isn't a good sign. Whether President Trump will chew or choke on those bones is too hard to predict.
Closer to home, Thailand's King Maha Vajiralongkorn did the previously unthinkable, directly involving himself in the politics of the country. The King effectively barred his sister, Princess Ubolratana Rajakanya, from running for Prime Minister in an intervention that will send shockwaves through the country and turmoil into the forthcoming April elections. We expect above-average volatility in both the currency and stock markets today as the street digests this news.
On the data front, we have a packed calendar this week. China is back from Lunar New Year and releases new loans today, which will be closely monitored for any slowdown signals. The UK presents GDP data, which will no doubt be overshadowed by the long-running Brexit talks soap opera.
The Reserve Bank of New Zealand (RBNZ) announces its first rate decision of the year on Wednesday followed by the US Consumer Price Index (CPI). Thursday sees the release of Japan's GDP followed by the Eurozone's, with the street fretting over further signs of a slowdown, most notably in Germany.
FX
Kicking off the week, the US dollar remains strong against the majors and regional currencies. Talk of its demise could be premature in the bigger picture because – of all the developed nations – the US at least partially normalised interest rates before the Federal Reserve called time in January. Many of the world's major central banks are continuing to maintain quantitative easing or have record low rates – not a good sign if the world economy turns down. For now, the US dollar remains the least ugly horse in the glue factory.
AUD and NZD could face another tough day at the office if risk aversion picks up this week, depending on whether the trades talks progress (or not). Any signs of dovishness from the RBNZ policy statement could be seized upon by the bears lurking in the shadows.
The progress of the trade talks could also weigh heavily on regional currencies. Almost all have a high beta to China and are intimately entwined economically. Malaysia and Indonesia, in particular, could feel the chill winds if the talks don't go well.
GBP continues to bounce around the 1.2900 mark as reality starts to bite on Brexit. It will be hard for GBP to sustain any meaningful rally while the UK's position remains in a state of flux and Europe remains belligerent on further negotiations.
Stocks
Following a quiet finish in the US on Friday, we expect a flat day in Asia as the markets eye China's return. The exception could be Thailand where the weekend's news could see investors running for the door and moving to cash.
Expect the regional stock markets to be buffeted by trade talk headlines. A lack of progress may weigh heavily on local bourses.
The US markets will see stocks with large China exports come under pressure as well if talks falter, but overall the focus will be more inward looking towards that potential Government shutdown occurring this Friday.
Oil
Despite the potential shutdown, the US Congress has been busy. On Thursday they passed a bill allowing the Department of Justice to sue OPEC for manipulating prices. This news hasn't seen much airtime but has the potential to throw some spanners into OPEC's cogs. It could put further downward pressure on Brent in particular.
Crude finished the week quietly midrange with Brent closing at around USD62.00 a barrel and WTI at USD52.00. Of the two, WTI looks the more vulnerable with technical support just below at USD51.50. Overall, it's hard to see a significant rally for oil with the legislation and trade talks hang overhead.
Gold
Gold weathered the storm last week and the sell-off petered out ahead of 1,300.00. This is a positive technical development, and with so much geopolitical risk in the region this week, gold is well placed to benefit and potentially retest 1,325.00.
EURUSD Risk Remains Lower On Further Decline
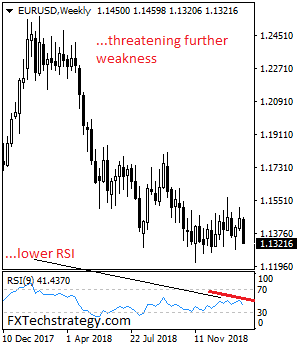
EURUSD risk remains lower on further decline in the new week as it closed lower the past week. Support stands at the 1.1300 where a break will aim at the 1.1250 level. A break below here will target the 1.1200 level. Further down, support lies at the 1.1150. On the upside, resistance resides at 1.1350 level with a break through there opening the door for further upside towards the 1.1400 level. Further up, resistance comes in at the 1.1450 level where a violation will expose the 1.1500 level. All in all, EURUSD continues to threaten further downside pressure.
Eco Data 2/11/19
[php_everywhere instance="1"]
Forex Forecast and Cryptocurrencies Forecast
First, a review of last week's events:
EUR/USD. One of the development scenarios, supported, however, by only 30% of experts, suggested a decline of the pair to the lower border of the medium-term side channel 1.1300-1.1500. This is what happened: having lost about 130 points, the pair recorded the week low at the level of 1.1320.
The reason for the strengthening of the dollar and, as a result, for the fall of the pair, was the growth of anti-risk sentiment due to increased pessimism in resolving the US-China trade conflict and not the most favorable expectations for economic growth in the Eurozone. Thus, the European Commission, talking about "significant risks", has substantially lowered its forecast for the GDP growth from 1.9% to 1.3% in 2019 and from 1.7% to 1.6% in 2020. Such an adjustment has significantly pressured the euro, making the market understand that it is not worth expecting an increase in interest rates this year;
GBP/USD. In unison with the European Commission, the Bank of England also declared that its previous forecasts were too optimistic, and the lack of clarity with Brexit is a burden for the country's economy. The Bank specialists expect the growth rate to be the lowest in the last 10 years, as a result of which the UK GDP forecast for 2019 has been lowered from 1.7% to 1.2%.
The pound sank sharply on this negative news and, as 65% of the experts had expected, the pair reached 1.2850. Then it rose a little against the background of an article about possible progress in negotiations on the British exit from the EU and special conditions for Ireland, and then sank again and completed the five-day period at 1.2940;
USD/JPY. The majority of analysts (70%), supported by graphical analysis on D1, had expected strong fluctuations of the rate and the fall of the pair to the zone 108.00-108.55, after which it should return to the horizon 110.00. However, contrary to forecasts, the pair behaved very calmly, and the maximum amplitude of its oscillations did not exceed 60 points.
For the third week in a row, time after time, the pair returns to the zone of 109.55-110.0 0. This time again, starting the week session at the level of 109.55, the pair completed it at the level of 109.75;
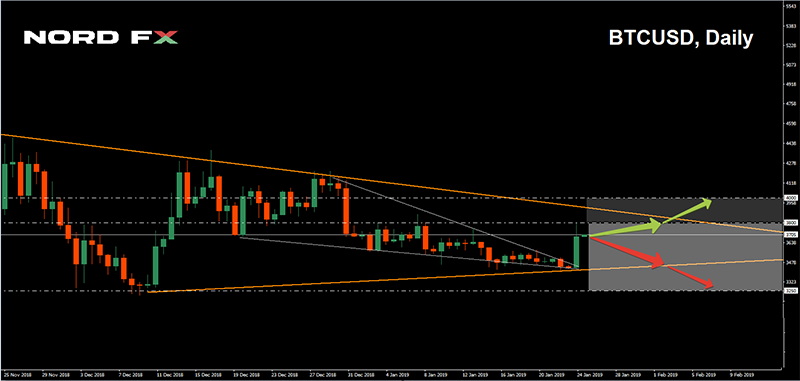
Cryptocurrencies. We divided the experts into two groups last week. The first is those who believe that the current calm is the calm before the storm. The second one thinks is that it is a lull before ... even more calm. All week, Bitcoin quotes were falling smoothly and quietly, reaching a low of $3,400 on Wednesday, February 6. Then a very sluggish "side" followed, and Friday afternoon it "jerked": the BTC/USD rushed up, in a matter of hours adding about 12% and reaching the level of $3,800.
Is this a precursor of a storm? If you look at the graph H1, of course it is. However, everything is not so impressive on the daily timeframe: the pair has just returned to the consolidation line (or Pivot Point), along which it has been moving for 11 weeks already, starting from the end of November 2018.
The reason for the growth was an interview fragment published in Tweeter of one of the four SEC commissioners, Robert Jackson, who said that the US Securities and Exchange Commission may still allow the launch of Bitcoin-ETF funds.
Following Bitcoin (BTC/USD), the rest of the top cryptocurrencies went up. The greatest growth was demonstrated by Litecoin (LTC/USD), adding at its maximum 40% and reaching the price of $46.0 0. Ethereum rose to the level of $124.70, and Ripple (XRP/USD) reached a height of $0.3250.
As for the forecast for the coming week, summarizing the opinions of a number of analysts, as well as forecasts made on the basis of a variety of methods of technical and graphical analysis, we can say the following:
EUR/USD. It is clear that after the week-long rally to the south, most of the indicators are colored red. However, already 25% of oscillators on both H4 and D1 give signals the pair being oversold, which means at least an upcoming strong correction, if not a complete reversal of the trend.
A graphical analysis for the next five days draws lateral movement in the range of 1.1285-1.1400, after which the pair should return to the upper boundary of the medium-term channel in the 1.1500 zone by the end of the month.
The expert community has not yet decided: 50% expect the pair to fall, 50% see its growth, which is due to the lack of any clarity both on Brexit and on the US-China negotiations. In addition, the events of the coming week can make their own adjustments. here we should bear in mind the publication of data on GDP of Germany and the EU on Thursday, February 14, as well as on inflation and retail sales in the US on February 13 and 14.
Also, on Tuesday, February 12, the market will look for signals from the head of the Federal Reserve J. Powell regarding a possible increase in interest rates. Meanwhile the level of recession expectations in the United States has risen to 20%, and it is possible that the issue of interest rates will be postponed until better times. EU and UK regulators are also constantly talking about the risks to economic growth, which should entail easing monetary policy.
According to many experts, this gives reason to think about buying stocks on the stock market, because slowing economic growth while maintaining cheap money can lead to an increase in their prices. Here it makes sense to pay attention to portfolio investments in shares of the most reliable and promising global companies that are offered to their clients by the brokerage company NordFX;
GBP/USD. On Monday, February 11, data on GDP will be published, and on Wednesday, February 13, there will be data on inflation in the UK. Most likely, they will indicate a slowdown in the growth of the country's economy, as already mentioned above. Thus, according to forecasts, GDP growth will decline compared with the previous quarter from 0.6% to 0.2%. But, like many months in a row, news and rumors about Brexit will have a major impact on quotes.
There is another category of rumors, that some international companies are buying the British currency, which Bloomberg hinted at carefully, and this gives the pound some support.
At the moment, 60% of analysts have voted for the pound strengthening and rising of the pair to the horizon of 1.3040, and then another 80-100 points higher. The remaining 40% of experts, on the contrary, expect the pair to drop to at least the level of 1.2830. But the graphical analysis on H4 has taken a compromise position, indicating that the pair can first decline to the level of 1.2830, and only then go to growth, reaching the height of 1.3040;
USD/JPY. The prevailing color is gray, that is, neutral, both with experts and indicators. The strengthening of the US dollar against major world currencies is on one side of the scale. On the other, there are increased risks of a slowdown in the global economy and another round of tension between the United States and China, which entails an increase in demand for a safe haven currency such as the Japanese yen. The pair managed to keep in a very narrow range of 109.55-110.15 for the whole week, which indicates the complete uncertainty of the market and does not allow to make any predictions for the moment;
Cryptocurrencies. The full interview by SEC Commissioner Robert Jackson will be released this week and its content may both push the quotes further up or have the opposite effect. After all, whatever you say, but the Securities and Exchange Commission has almost 240 days to make a final decision on the application to launch Bitcoin-ETF, and during this time a lot can change.
In the meantime, experts call its movement in the $3,250-3,800 range as the main scenario for the BTC/USD. However, they do not exclude the short-term breakdown of the upper limit and the rise of the pair to the level of $4,000.
EUR/USD Weekly Outlook
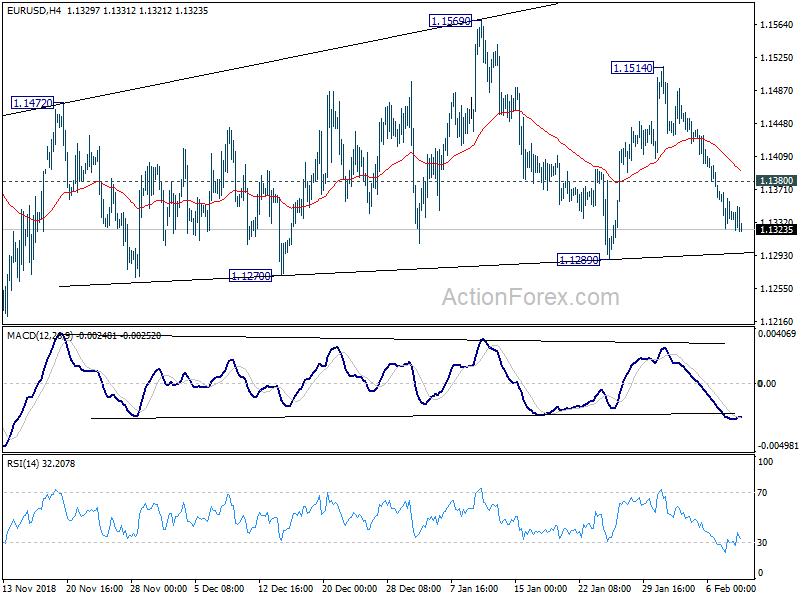
EUR/USD's fall from 1.1514 extended lower last week and the development suggests that rebound from 1.1289 has already completed. Initial bias stays mildly on the downside this week for 1.1289 support first. Firm break of 1.1289 support will argue that corrective pattern from 1.1251 has completed. And, in that case, larger decline from 1.2555 is ready to resume through 1.1251 low. On the upside, above 1.1380 minor resistance will turn intraday bias neutral first.
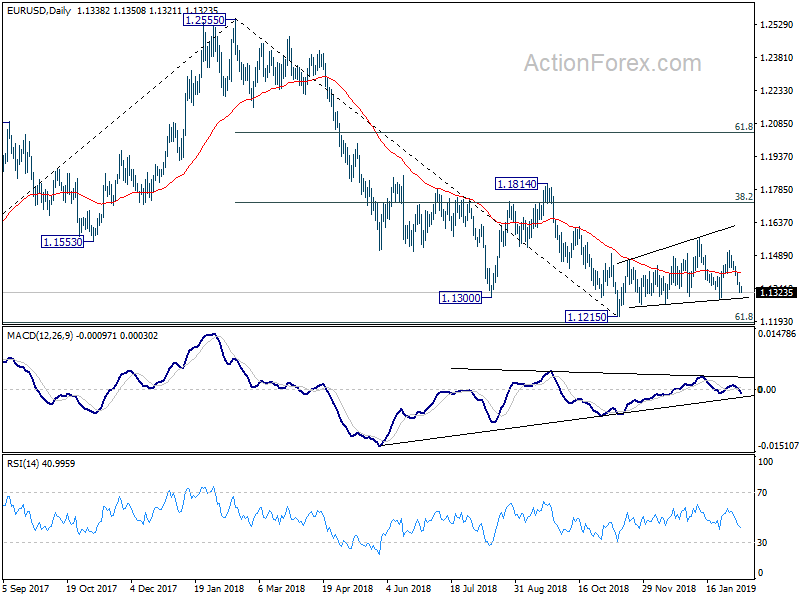
In the bigger picture, as long as 1.1814 resistance holds, down trend down trend from 1.2555 medium term top is still in progress and should target 61.8% retracement of 1.0339 (2017 low) to 1.2555 at 1.1186 next. Sustained break there will pave the way to retest 1.0339. However, break of 1.1814 will confirm completion of such down trend and turn medium term outlook bullish.
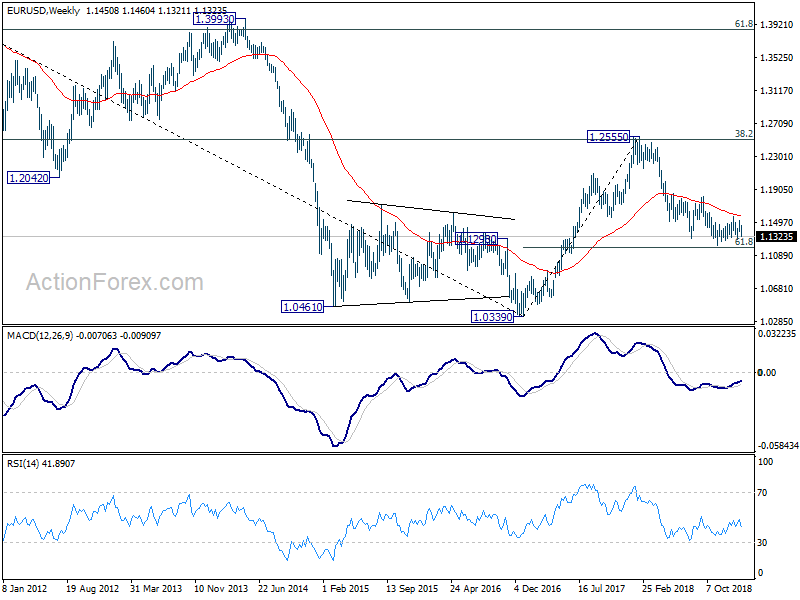
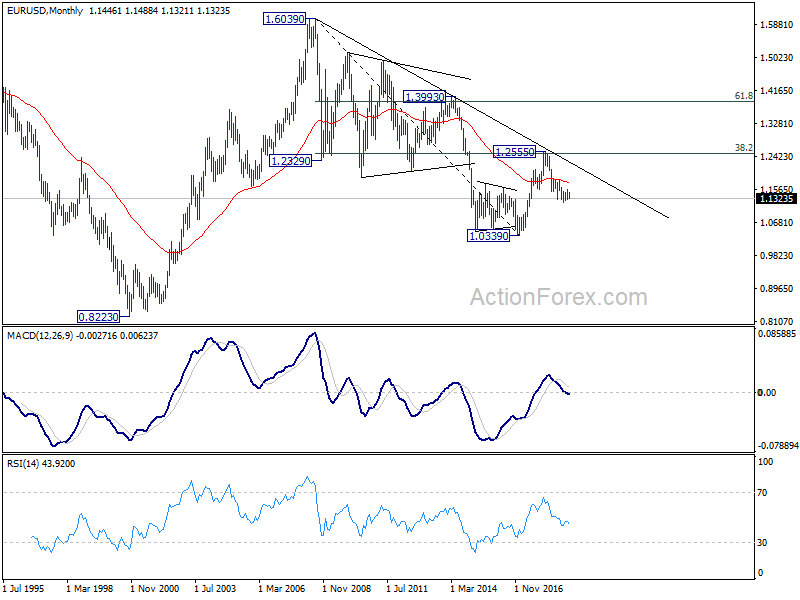
In the long term picture, the rejection from 38.2% retracement of 1.6039 to 1.0339 at 1.2516 argues that long term down trend from 1.6039 (2008 high) might not be over yet. EUR/USD is also held below decade long trend line resistance. Firm break of 61.8% retracement of 1.0339 to 1.2555 at 1.1186 should at least bring a retest on 1.0339 low. This will remain the favored case as long as 1.1814 resistance holds.
USD/JPY Weekly Outlook
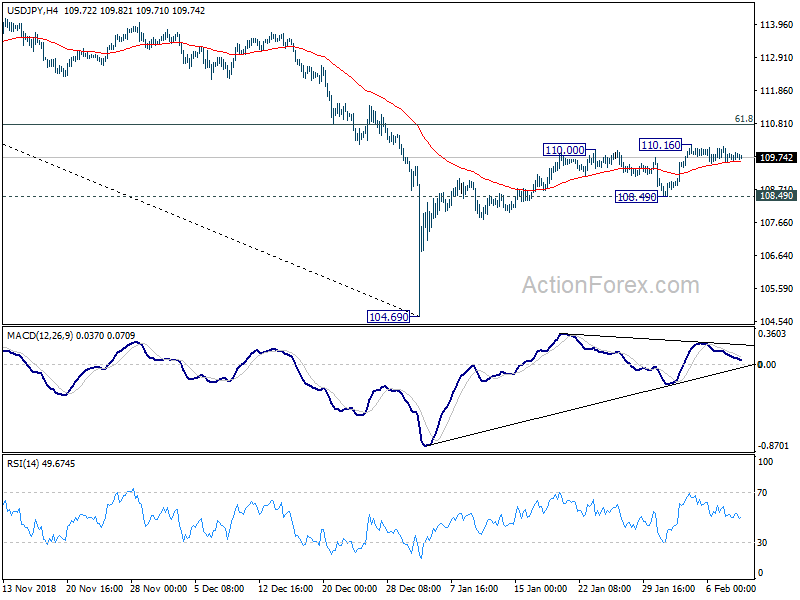
USD/JPY edged higher to 110.16 last week but turned sideway since then. Initial bias remains neutral this week first. On the upside, break of 110.16 will extend the rebound from 104.69. But we'd expect strong resistance from 61.8% retracement of 114.54 to 104.69 at 110.77 to limit upside. On the downside, break of 108.49 support will now confirm completion of the rebound and bring retest of 104.69 low. However, sustained trading above 110.77 will dampen our bearish view and target a test on 114.54 resistance instead.
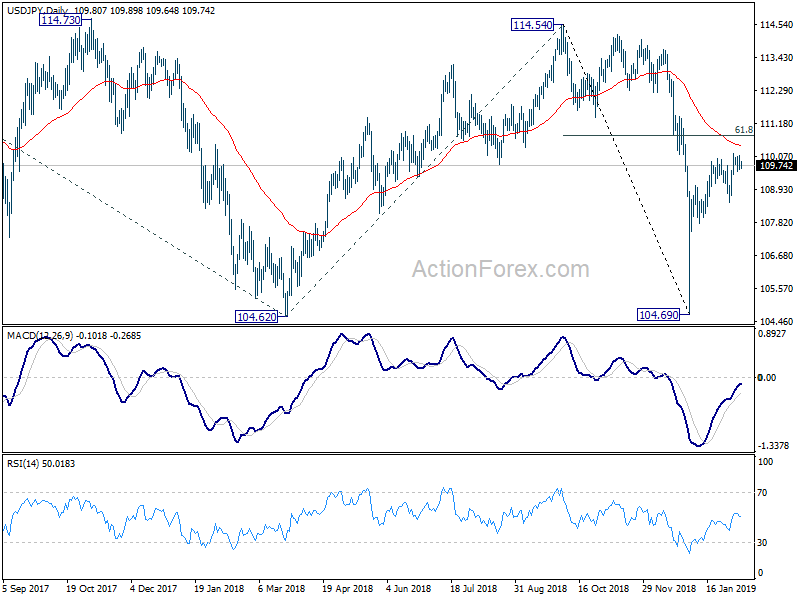
In the bigger picture, while the rebound from 104.69 is strong, there is no change in the view that it's a corrective move. That is, fall from 114.54, as part of the decline from 118.65 (2016 high), is not completed yet. Break of 104.62 will target 100% projection of 118.65 to 104.62 from 114.54 at 100.51, which is close to 100 psychological level. Nevertheless, sustained trading above 55 day EMA (now at 110.41) will dampen this bearish view and turn focus back to 114.54 resistance instead.
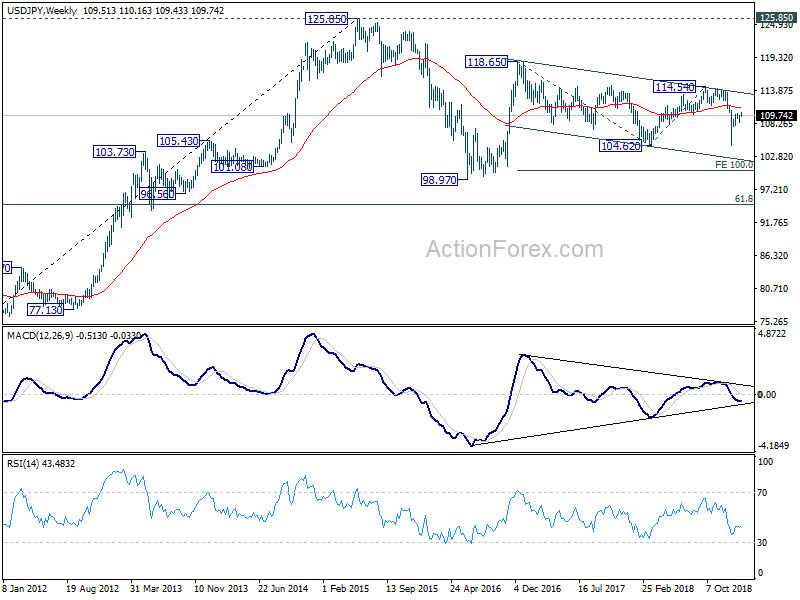
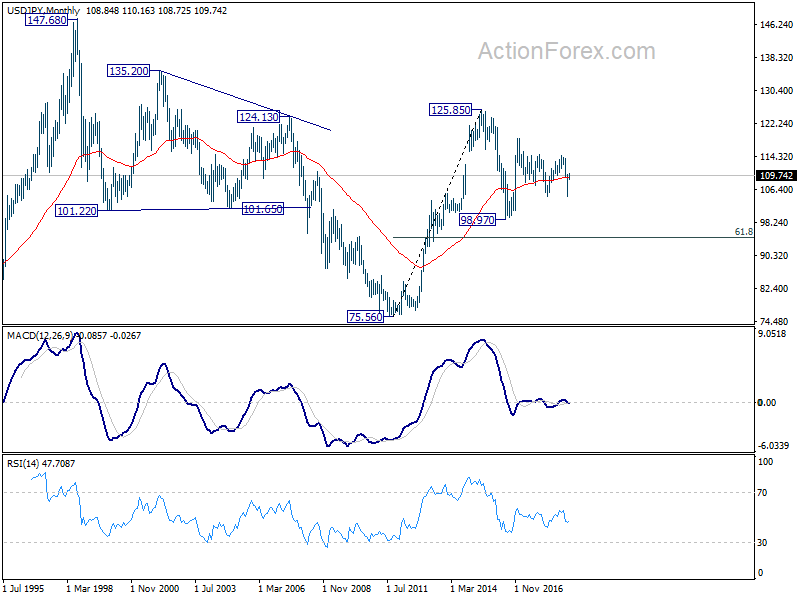
In the long term picture, the rise from 75.56 (2011 low) long term bottom to 125.85 (2015 high) is viewed as an impulsive move, no change in this view. Price actions from 125.85 are seen as a corrective move which could still extend. In case of deeper fall, downside should be contained by 61.8% retracement of 75.56 to 125.85 at 94.77. Up trend from 75.56 is expected to resume at a later stage for above 135.20/147.68 resistance zone.
GBP/USD Weekly Outlook
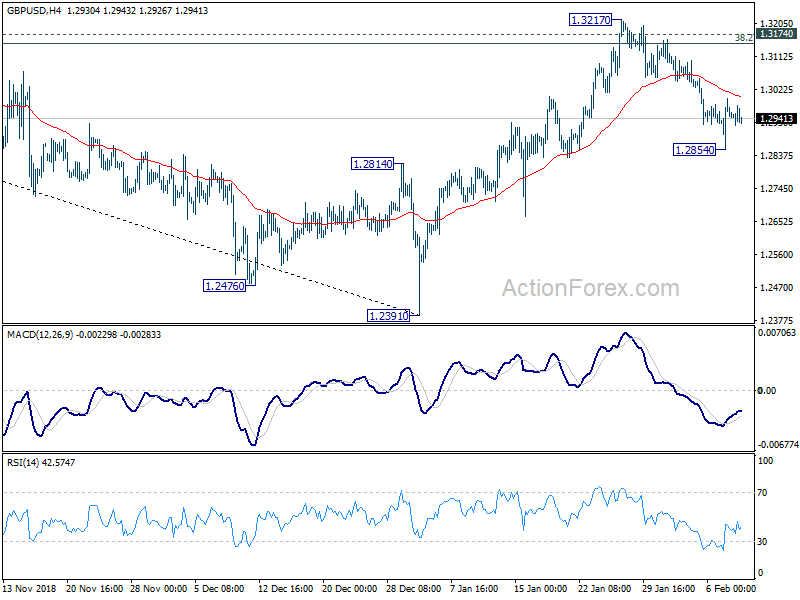
GBP/USD's dropped to 1.2854 last week but formed a temporary low there and recovered. Initial bias is neutral this week first. Current development suggests that rebound from 1.2391 has completed at 1.3217 already, after rejection by 1.3174 key resistance. Hence, risk will stay on the downside as long as 1.3217 resistance holds. On the downside, break of 1.2854 will turn bias to the downside for retesting 1.2391 low.
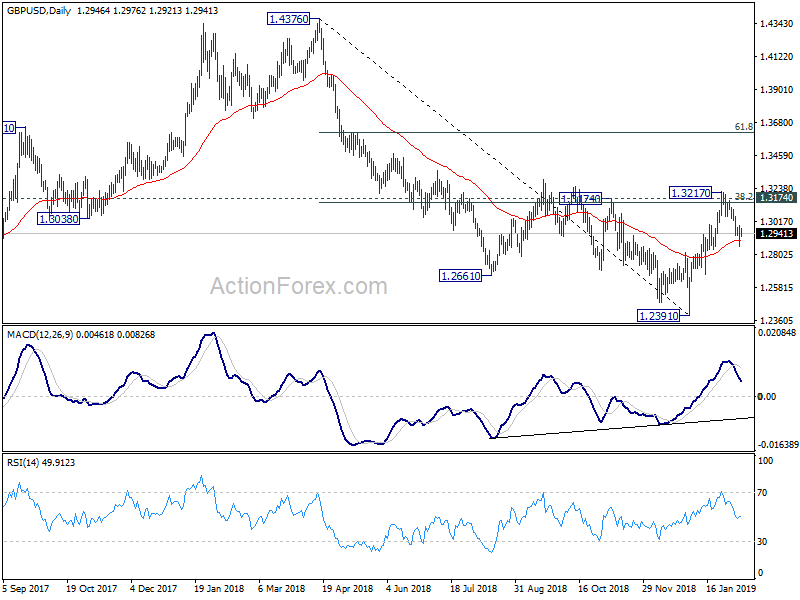
In the bigger picture, the rejection by 1.3174 key resistance revived the original view on GBP/USD. That is, decline from 1.4376 is possibly resuming long term down trend from 2.1161 (2007 high). Firm break of 1.2391 will solidify this bearish case and target 1.1946 (2016 low). However, decisive break of 1.3174 will invalidate this bearish case again and turn outlook bullish.
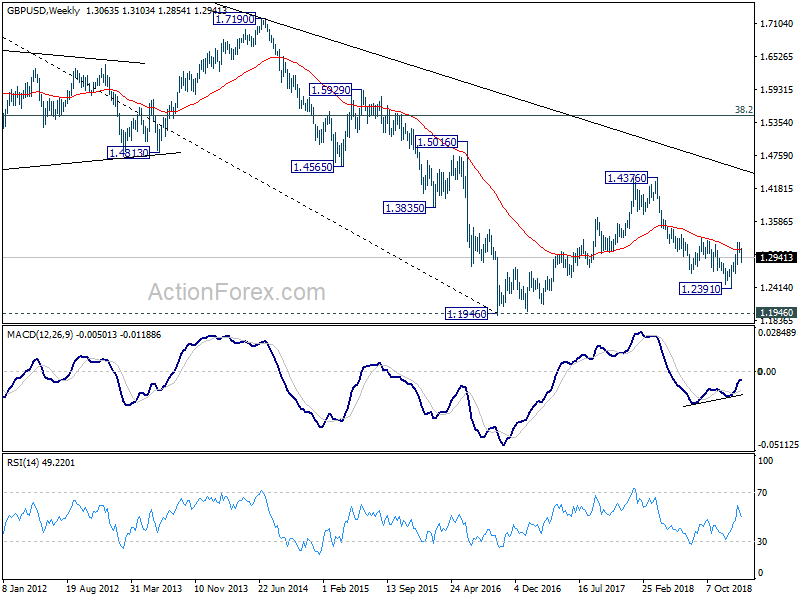
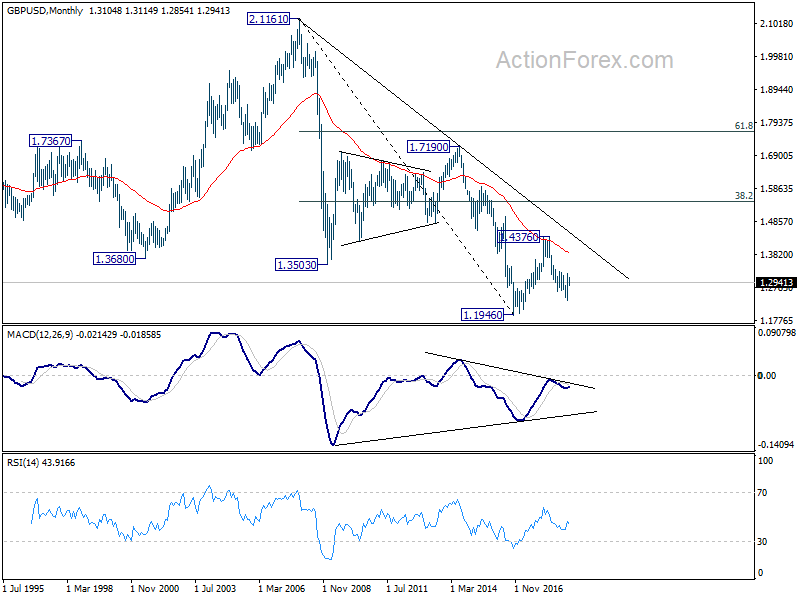
In the longer term picture, current development argues that corrective pattern from 1.1946 (2016 low) is extending with another rise. But there is no change in the long term bearish outlook as long as 38.2% retracement of 2.1161 (2007 high) to 1.1946 at 1.5466 holds. An eventual downside breakout through 1.1946 is still in favor in the long term.
USD/CHF Weekly Outlook
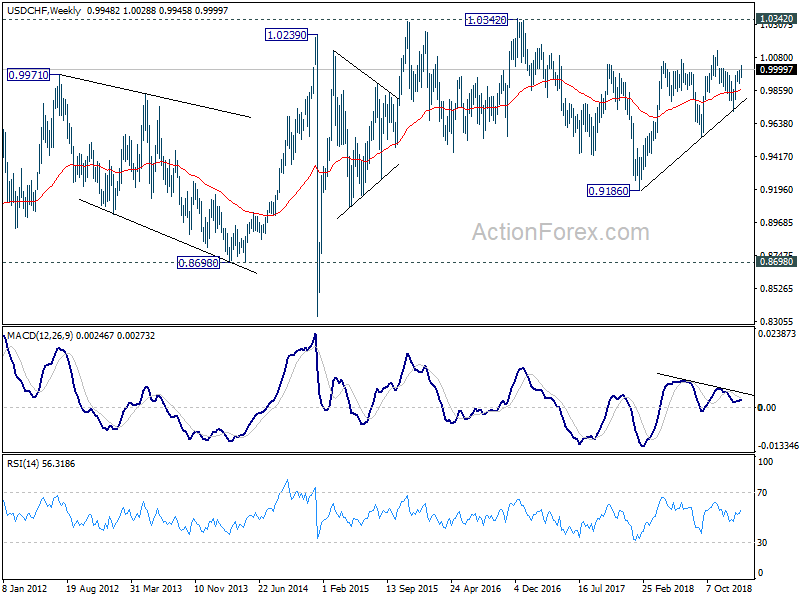
USD/CHF's rebound from 0.9716 extended to as high as 1.0028 last week. A temporary top was formed there and initial bias is neutral this week for some consolidation first. Downside of retreat should be contained by 0.9908 to bring another rally. As noted before, corrective decline from 1.0128 should have completed at 0.9716 already, after hitting trend line support. On the upside, above 1.0028 will resume the rise from 0.9716 to retest 1.0128 high next.
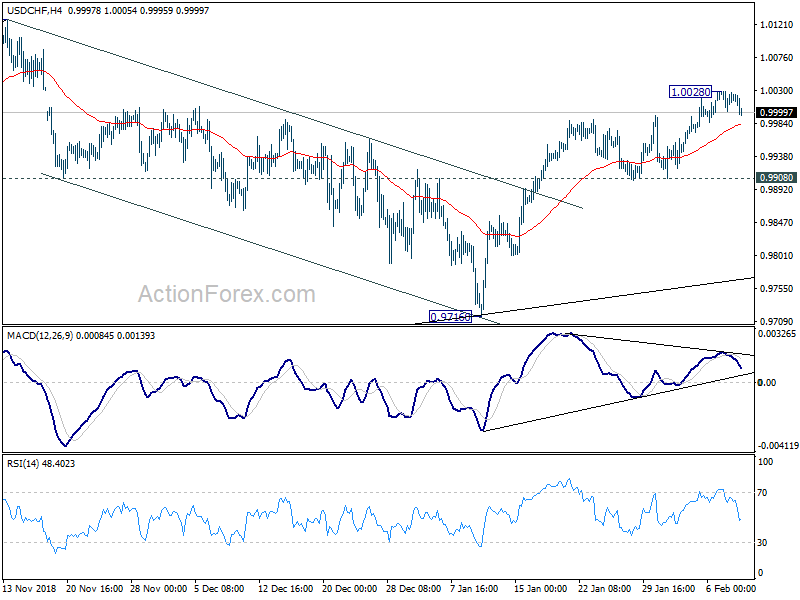
In the bigger picture, USD/CHF drew strong support from medium term trend line and rebounded. That suggests rise from 0.9186 is still in progress. Further break of 1.0128 will confirm up trend resumption and target 1.0342 key resistance. Nevertheless, break of 0.9716 will dampen this bullish view and at least bring deeper fall to 0.9541 key support.
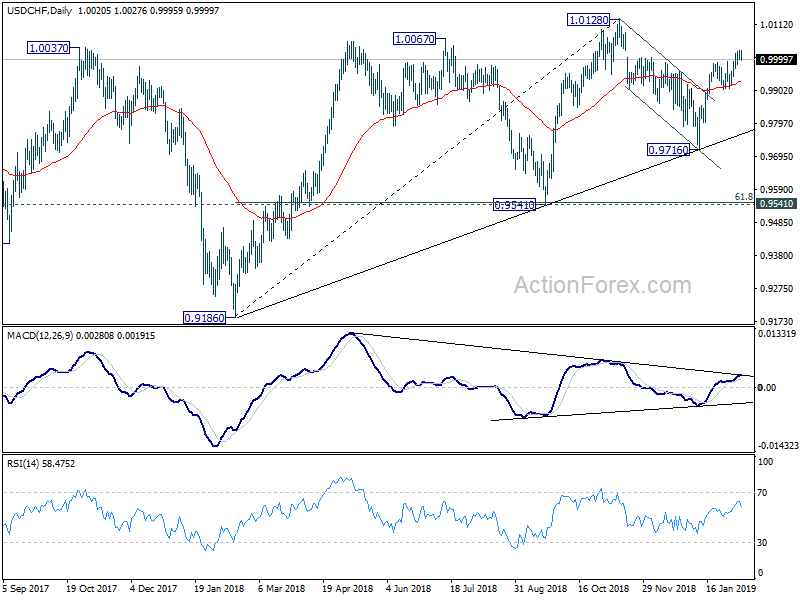
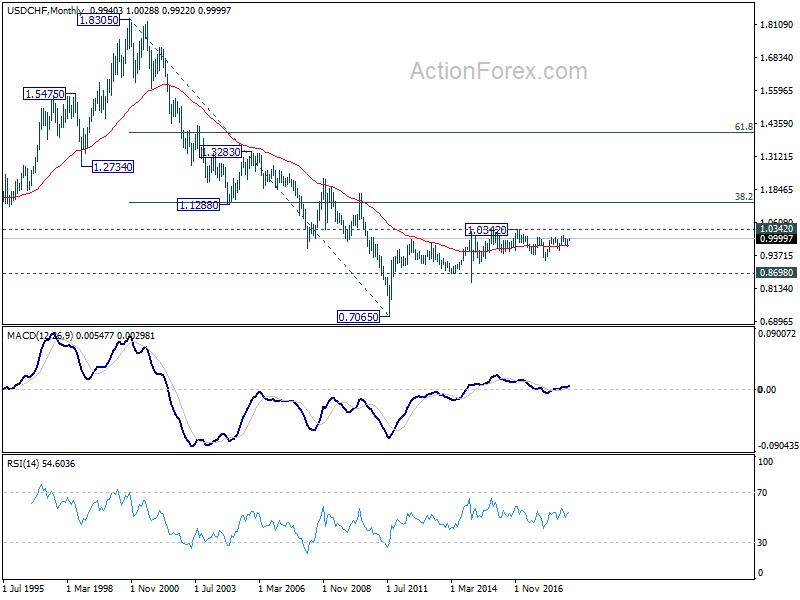
In the long term picture, price actions from 0.7065 (2011 low) are not clearly impulsive yet. Thus, we'll treat it as developing into a corrective pattern, at least, until a firm break of 1.0342 resistance.