

Sample Category Title
AUD/USD Weekly Outlook
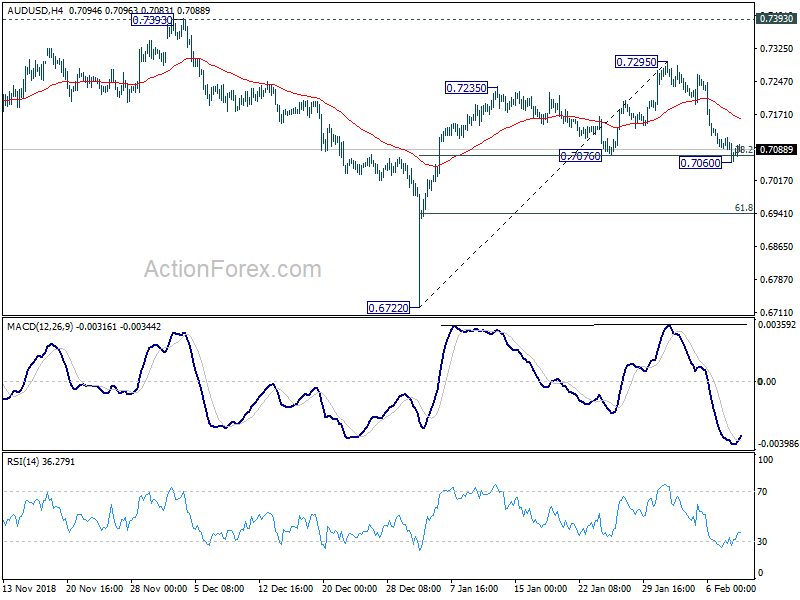
AUD/USD dropped sharply to as low as 0.7060 last week but formed a temporary low there and recovered. Initial bias is neutral this week first for some consolidation. For now, we're favoring the case that rebound from 0.6722 has completed at 0.7295 already. Hence, risk will stay on the downside as long as 0.7295 resistance holds, in case of recovery. On the downside, firm break of 0.7076 cluster support (38.2% retracement of 0.6722 to 0.7295 at 0.7076) should confirm this bearish case and target 61.8% retracement at 0.6941 next.
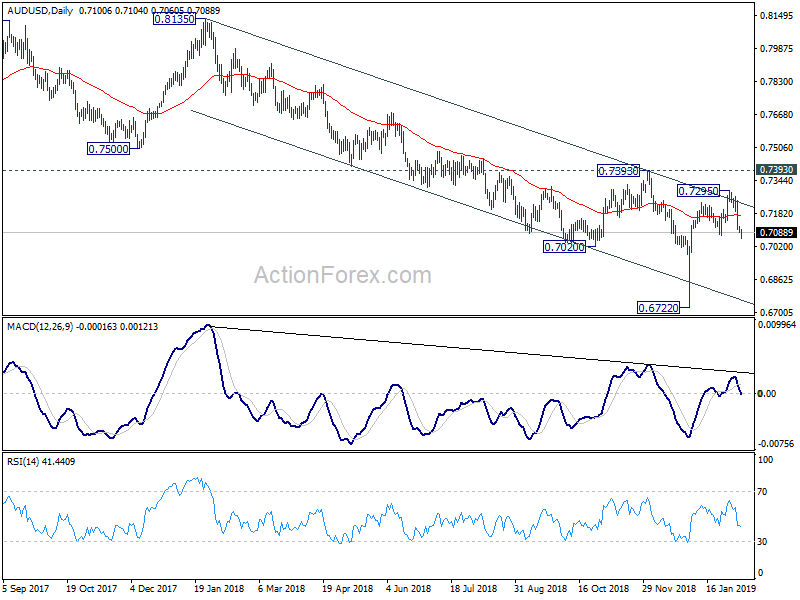
In the bigger picture, as long as 0.7393 resistance holds, we'd treat fall from 0.8135 as resuming long term down trend from 1.1079 (2011 high). Decisive break of 0.6826 (2016 low) will confirm this bearish view and resume the down trend to 0.6008 (2008 low). However, firm break of 0.7393 will argue that fall from 0.8135 has completed. And corrective pattern from 0.6826 has started the third leg, targeting 0.8135 again.
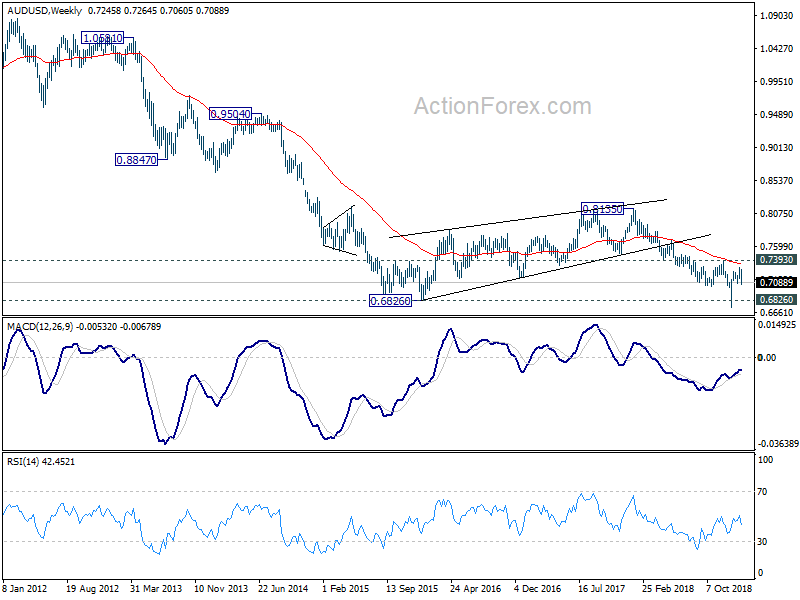
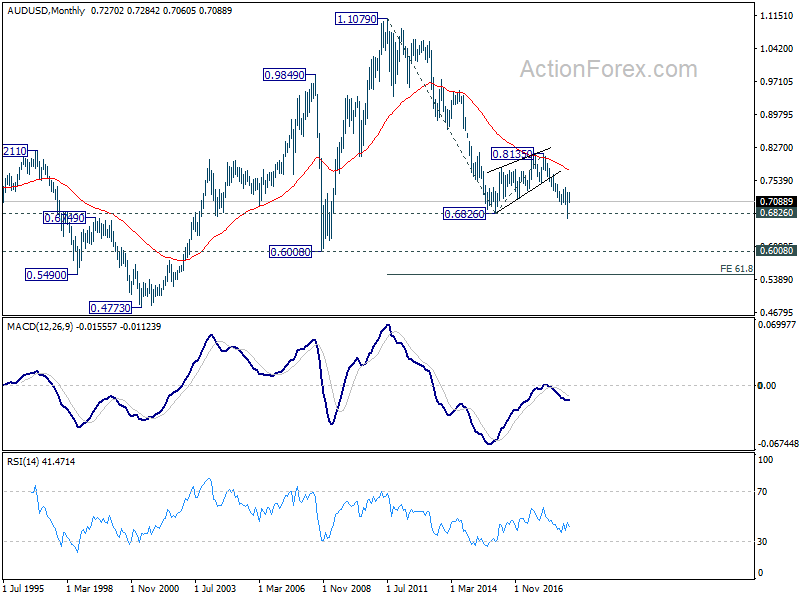
In the longer term picture, prior rejection by 55 month EMA maintained long term bearishness in AUD/USD. That is, down trend from 1.1079 (2011 high) is still in progress. Sustained break of 0.6826 will target 0.6008 low and then 61.8% projection of 1.1079 to 0.6826 from 0.8135 at 0.5507.
USD/CAD Weekly Outlook
USD/CAD rebounded strongly to 1.3229 last week but retreated since then. Initial bias is neutral this week first and deeper fall might be seen. But for now, we're favoring the case that decline from 1.3664 has completed with three waves down to 1.3068 already, on bullish convergence condition in 4 hour MACD, just ahead of medium term channel support. Hence, rise will stay on the upside as long as 1.3068 holds. Break of 1.3375 resistance will confirm this bullish case and target a test on 1.3664 high.
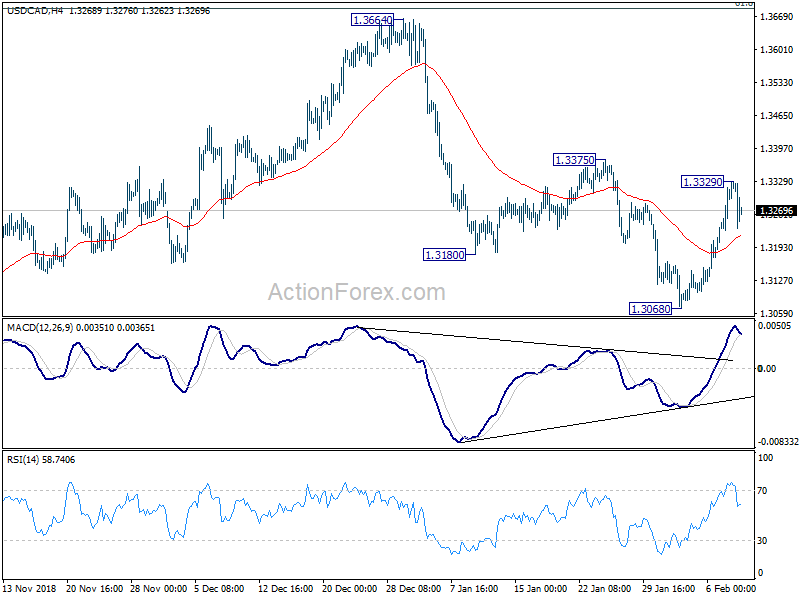
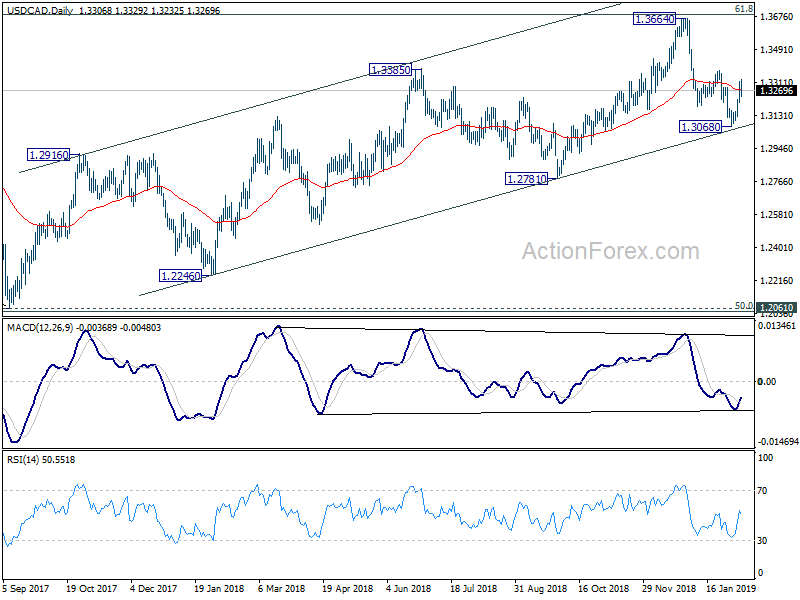
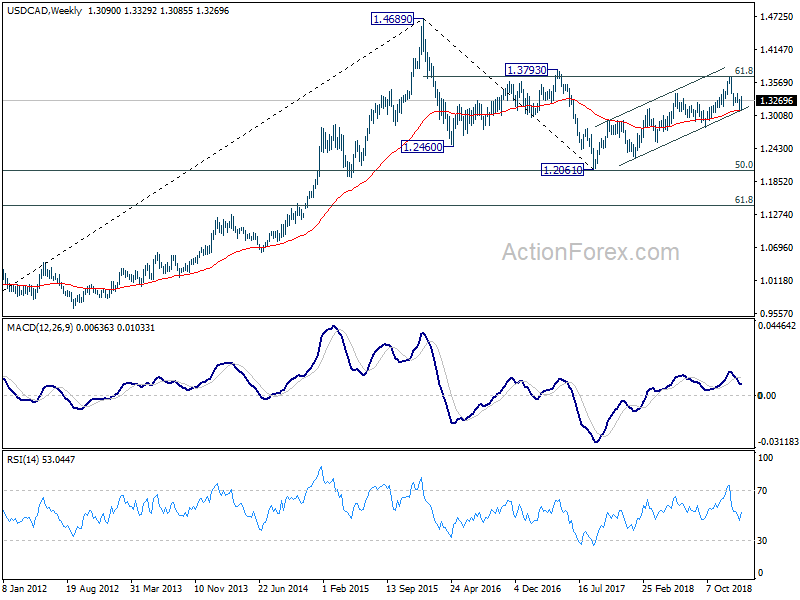
In the bigger picture, structure of the medium term rise from 1.2061 (2017 low) to 1.3664 is not clearly impulsive. Hence, we'd stay cautious on strong resistance from 61.8% retracement of 1.4689 (2016 high) to 1.2061 at 1.3685 and 1.3793 resistance to limit upside, and bring medium term topping. But in any case, medium term outlook will stay bullish as long as channel support (now at 1.3086) holds. Sustained break of 1.3793 will pave the way to retest 1.4689 (2015 high). Firm break of the channel support should confirm reversal target 1.2061 low again.
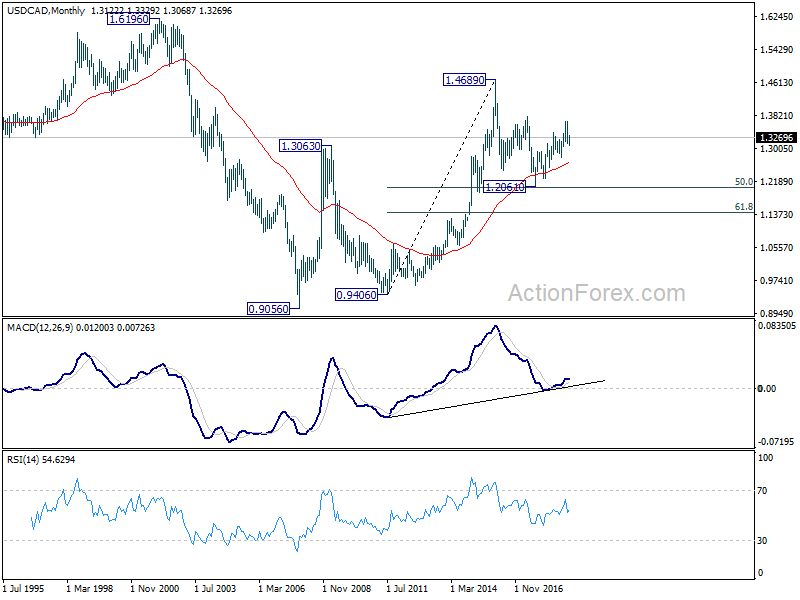
In the longer term picture, corrective fall from 1.4689 (2015 high) should have completed with three waves down to 1.2061, just ahead of 50% retracement of 0.9406 (2011 low) to 1.4689 (2015 high) at 1.2048. The development keeps long term up trend from 0.9406 and that from 0.9056 (2007 low) intact. For now, there is prospect of extending the long term up trend through 1.4689.
GBP/JPY Weekly Outlook
GBP/JPY gyrated lower last week but downside was contained above 140.62 support so far. Initial bias remains neutral this week first and outlook is unchanged. On the upside, above 144.84 will extend the rebound from 131.51. But we'd expect strong resistance from trend line (now at 146.93) to limit upside, at least on first attempt. On the downside, firm break of 140.62 will suggest completion of the rebound and turn bias to the downside.
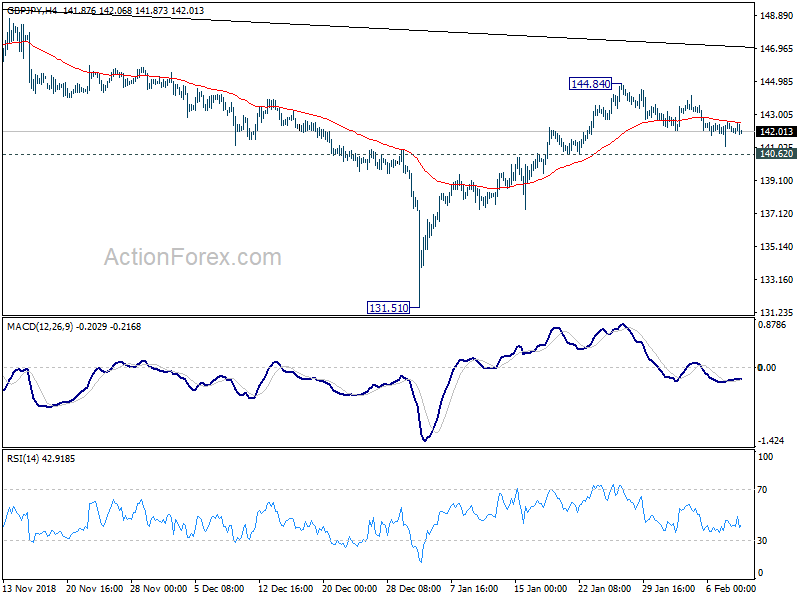
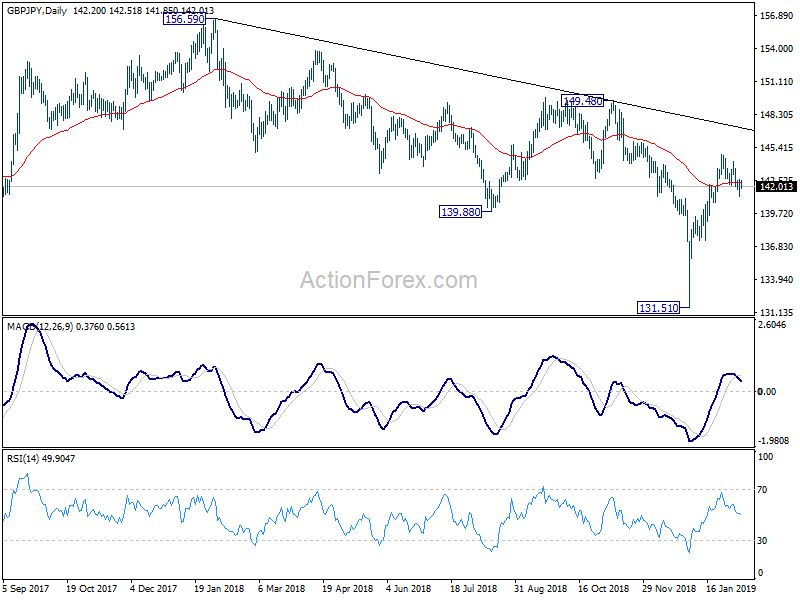
In the bigger picture, the strong rebound from 131.51 suggests that medium term fall from 156.59 (2018 high) has completed already. The corrective structure of such decline is turn argues that it's the second leg of the corrective pattern from 122.36 (2016 low). And this pattern is starting the third leg. On the upside, decisive break of 149.38 will pave the way to 156.59 resistance and above.
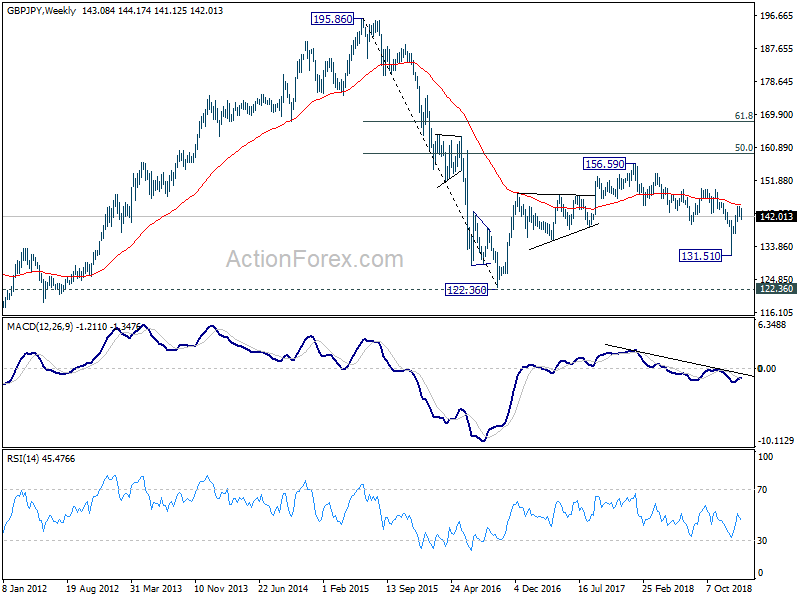
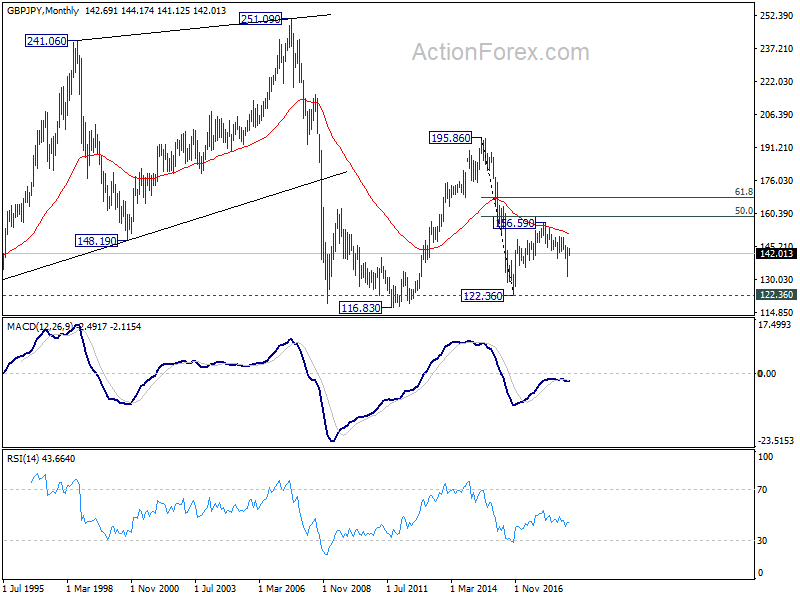
In the longer term picture, the rise from 122.36 (2016 low) to 156.59 (2018 high) doesn't display a clear impulsive structure. Thus, we're treating price actions from 122.36 as a corrective pattern. In case of an extension, strong resistance is likely to be seen at 50% retracement of 195.86 (2015 high) to 122.36 at 159.11 to limit upside. On the downside, break of 131.51 support will bring 122.26 low back into focus.
EUR/JPY Weekly Outlook
EUR/JPY edged higher to 125.95 last week but gyrated down afterwards. Break of 124.36 suggests that rebound from 118.62 has completed just ahead of 55 day EMA . Initial bias is mildly on the downside this week for 123.78 support first. Break there will add more credence to this case and target a test on 118.62 low. On the upside, break of 125.95 resistance is needed to confirm resumption of the rebound. Otherwise, risk will now stay on the downside in case of recovery.
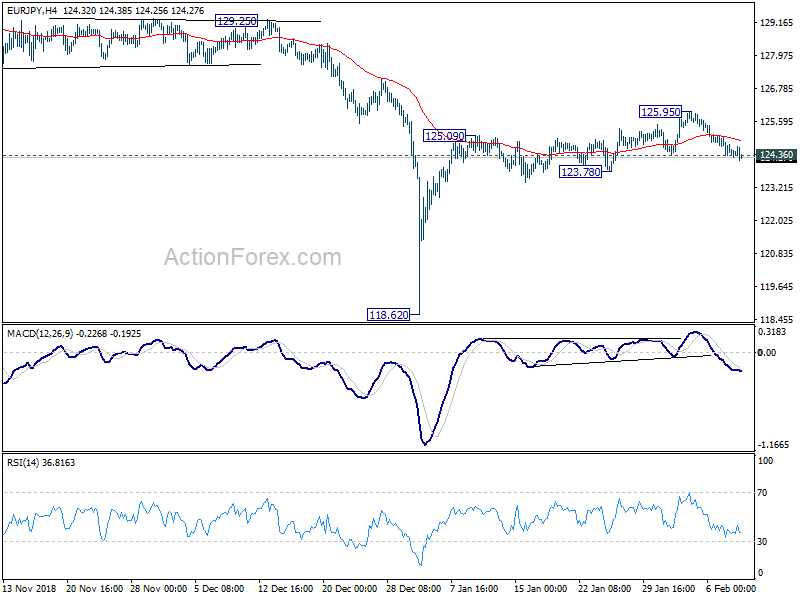
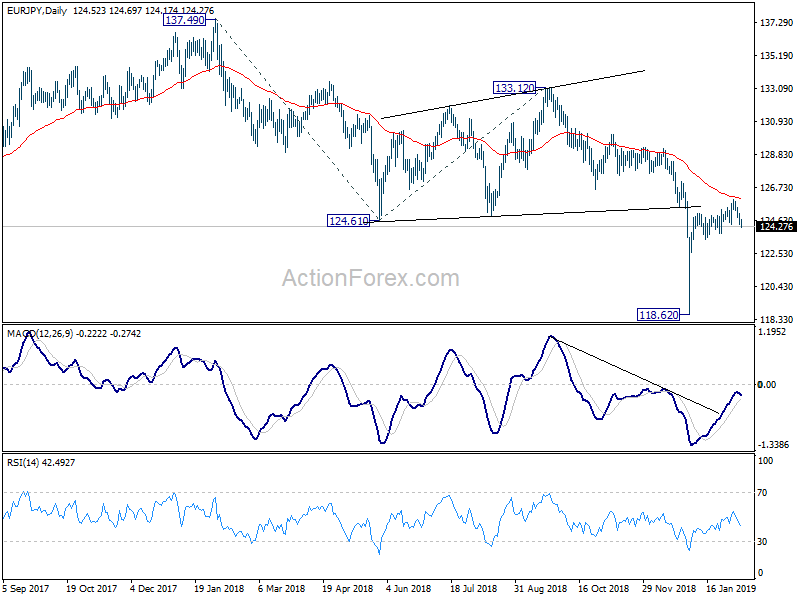
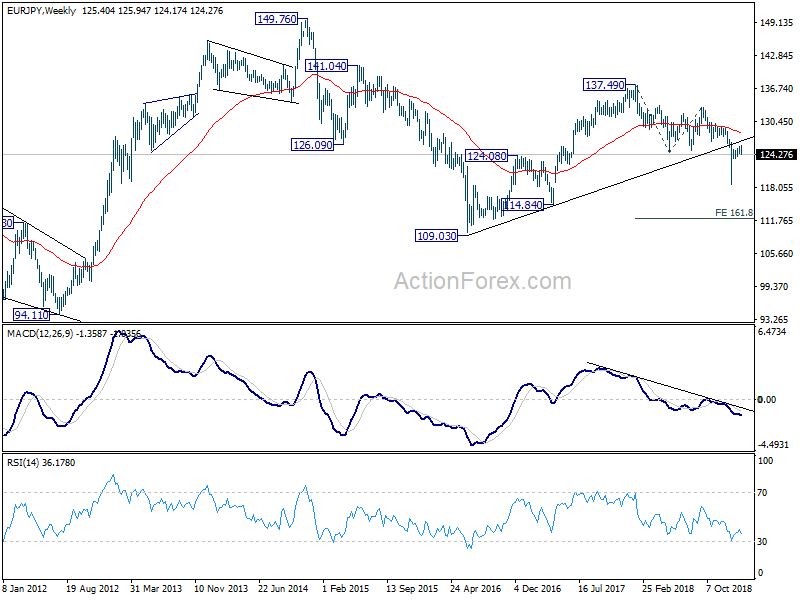
In the bigger picture, medium term rebound from 109.03 (2016 low) has completed at 137.49 already, with corrective structure. Fall from 137.49 is likely still in progress. Decisive break of 118.62 will target 161.8% projection of 137.49 to 124.61 from 133.12 at 112.28, which is inside 109.03/114.84 support zone.
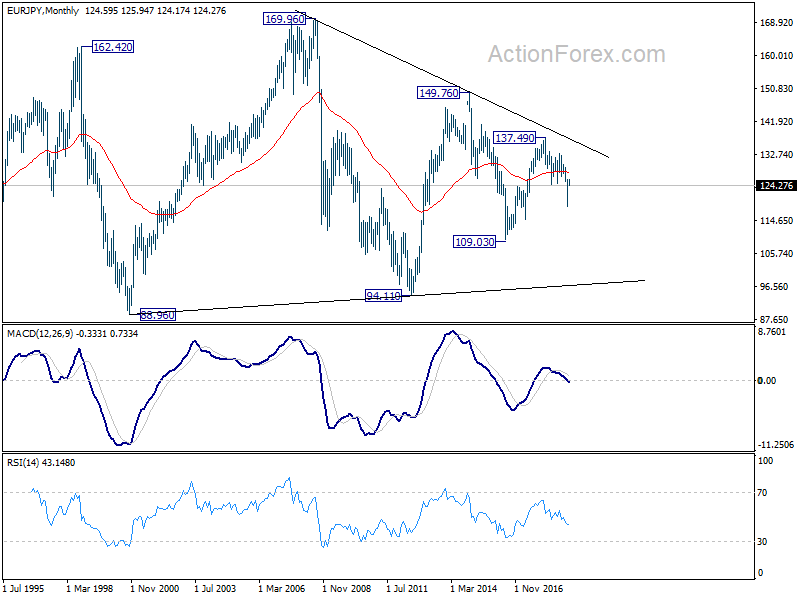
In the long term picture, EUR/JPY is staying in long term sideway pattern, established since 2000. Fall from 137.49 is seen as a falling leg inside the pattern. It could extend through 109.03 to resume the decline from 149.76 But in that case, we'd expect strong support around 94.11 (2012 low) to bring reversal.
EUR/GBP Weekly Outlook
EUR/GBP edged higher to 1.8812 last week but failed to sustain above 38.2% retracement of 0.9101 to 0.8617 at 0.8802. Initial bias is neutral this week first. As long as 0.8711 minor support holds, further rise is still in favor. On the upside, break of 0.8802 will target 61.8% retracement at 0.8916. However, break of 0.8711 will suggest that rebound from 0.8617 has completed. Intraday bias will be turned back to the downside for 0.8617/20 support instead.
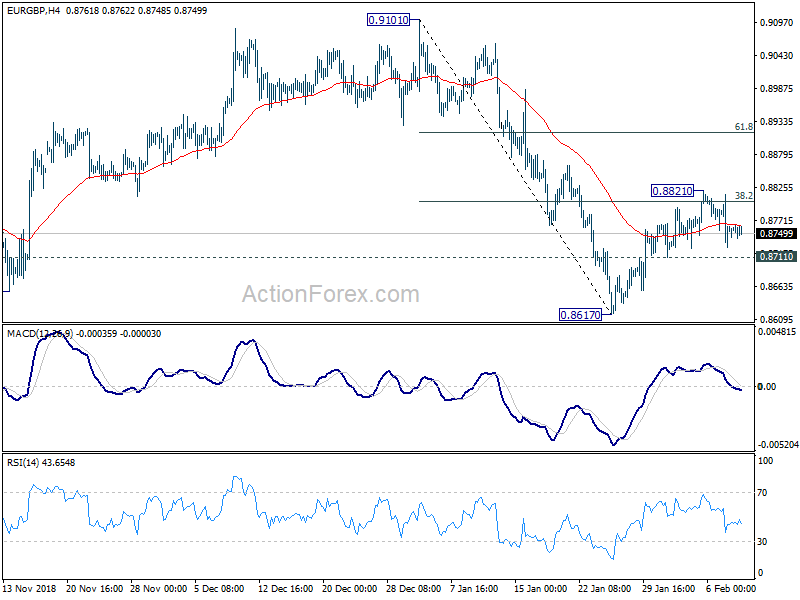
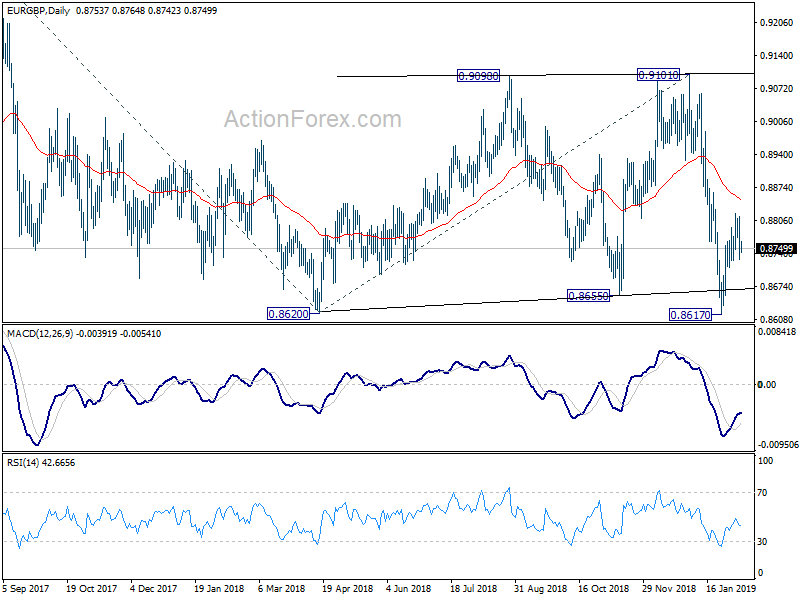
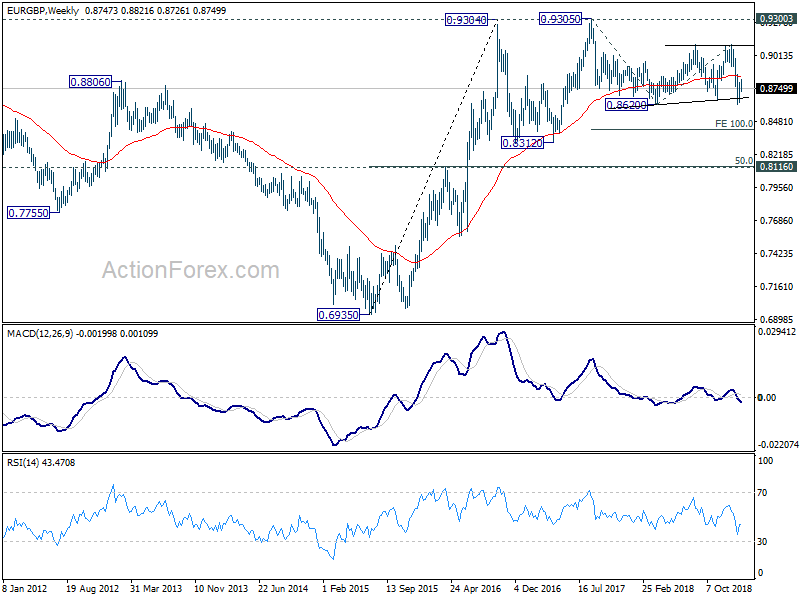
In the bigger picture, EUR/GBP is seen as staying in long term range pattern started at 0.9304 (2016 high). The medium term range is set between 0.8620 and 0.9101. Downside breakout of 0.8620 will pave the way back to 0.8312 support . Break of 0.9101 will bring retest of 0.9304/5 resistance.
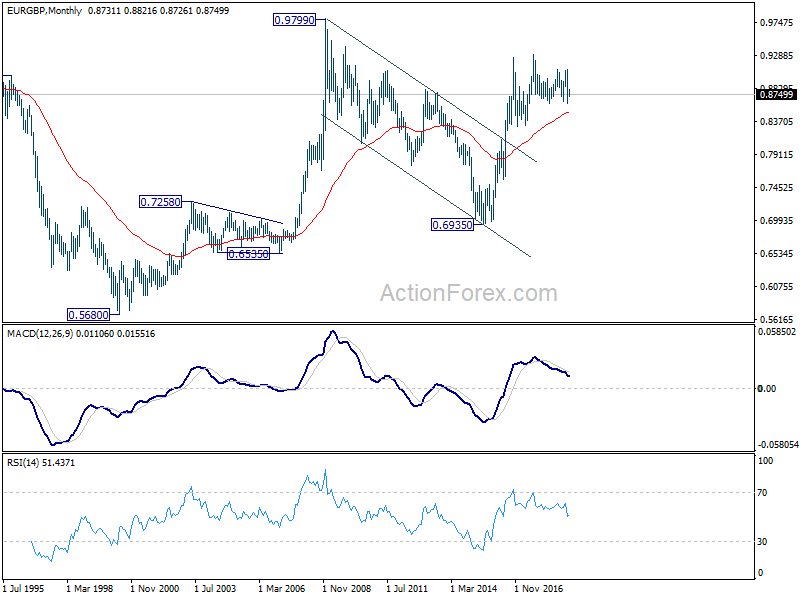
In the long term picture, we're holding on to the view that rise from 0.6935 (2015 low) is resuming the up trend from 0.5680 (2000 low). As long as 0.8116 cluster support (50% retracement of 0.6935 to 0.9304 at 0.8120) holds, further rise should be seen through 0.9305 to 0.9799 and above down the road.
EUR/AUD Weekly Outlook
EUR/AUD rebounded strongly last week but failed to sustain above 1.6038 resistance retreated. Initial bias is neutral this week first. For now, we'd favor the case that decline from 1.6765 has completed at 1.5721 already, on bullish convergence condition in 4 hour MACD. Risk will stay on the upside s long as 1.5721 support holds. Decisive break of 1.6038 will confirm this bullish view and target a test on 1.6765 high. On the downside, break of 1.5721 will extend the decline to 1.5346 support instead.
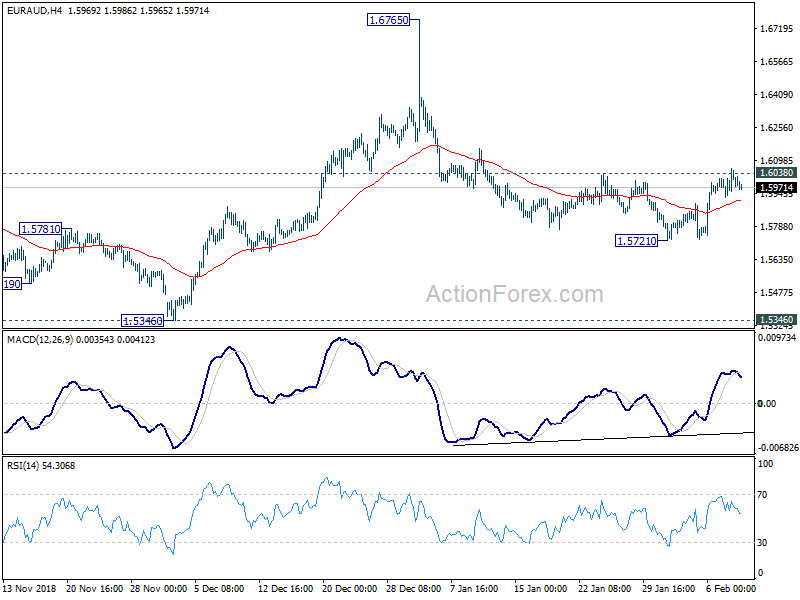
In the bigger picture, as long as 1.5346 support holds, outlook will remain bullish. Uptrend from 1.1602 (2012 low) is expected to resume sooner or later. Break of 1.6765 will target 61.8% retracement of 2.1127 (2008 high) to 1.1602 at 1.7488 next. However, firm break of 1.5346 key support will indicate trend reversal, with bearish divergence condition in weekly MACD, and turn outlook bearish.
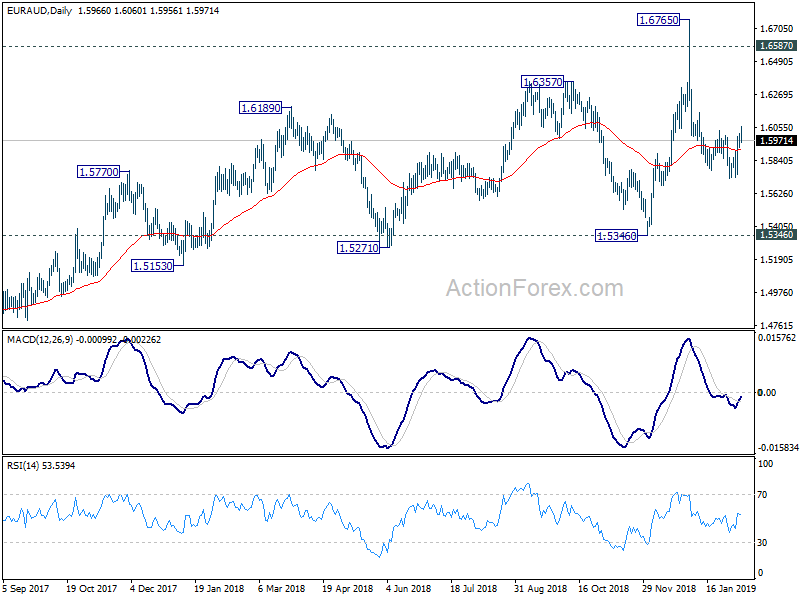
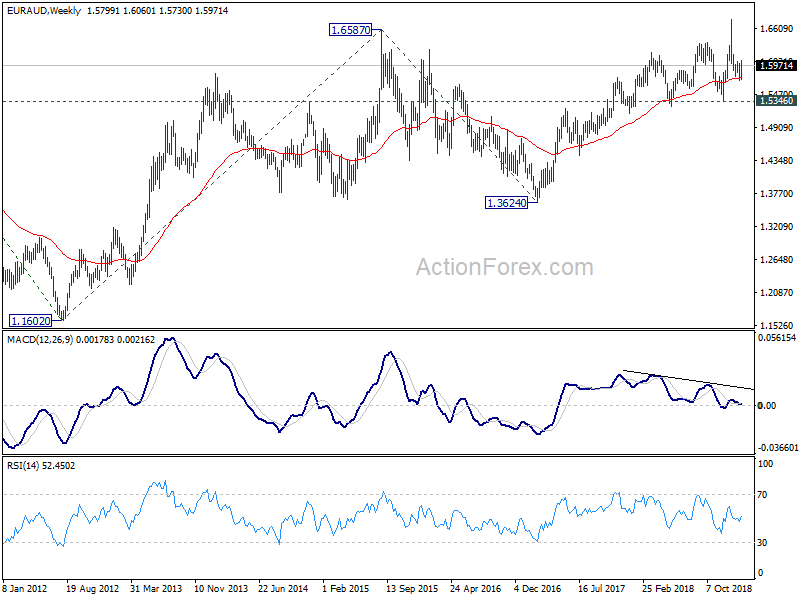
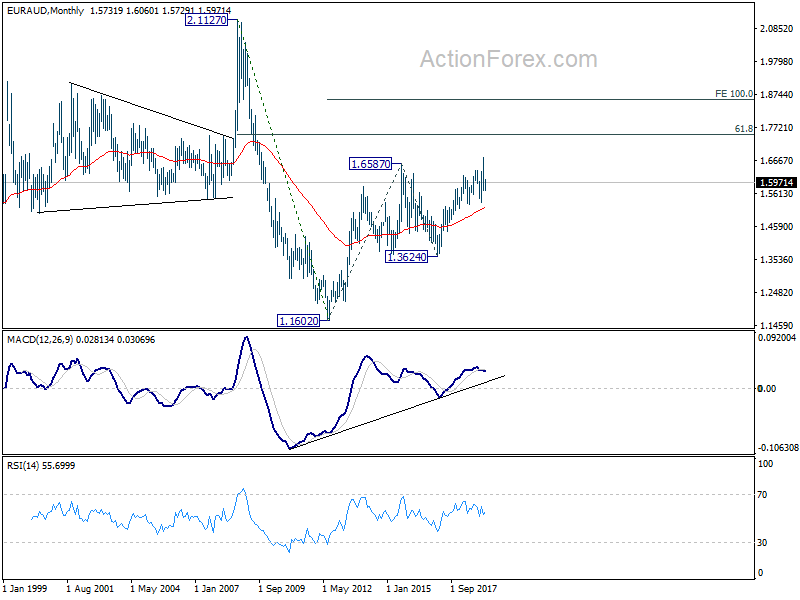
In the longer term picture, the rise from 1.1602 long term bottom (2012 low) is still in progress for 61.8% retracement of 2.1127 to 1.1602 at 1.7488. Firm break there will pave the way to 100% projection of 1.1602 to 1.6587 from 1.3624 at 1.8069. This will remain the favored case as long as 1.5346 remains intact.
EUR/CHF Weekly Outlook
EUR/CHF rose further to 1.1444 last week but reversed since then. The strong break of 1.1347 resistance turn supported argues that the rebound from 1.1181 might be completed. Initial bias is back on the downside this week for 1.1259 support first. Break will target 1.1181 low again. On the upside, above 1.1376 minor resistance will turn bias to the upside for 1.1444.
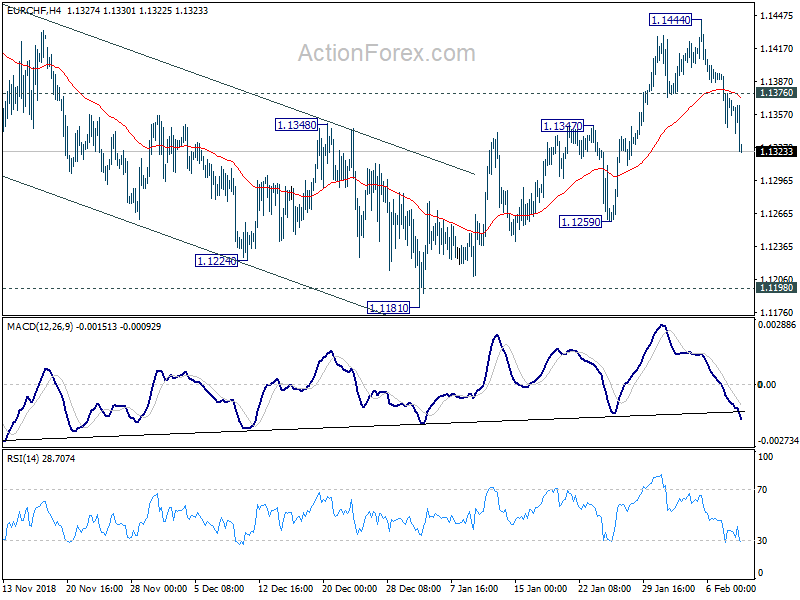
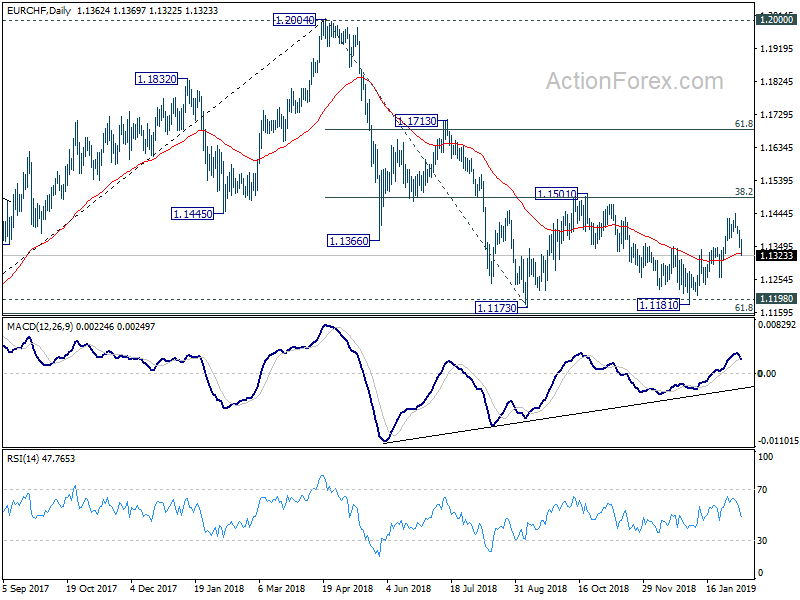
In the bigger picture, price actions from 1.2004 medium term top is seen as a correction only. Downside should be contained by 1.1154/98 support zone to complete it and bring rebound. Decisive break of 1.1501 (38.2% retracement of 1.2004 to 1.1173 at 1.1490) will confirm completion of the correction, on bullish convergence condition in daily MACD. Further rise should be seen to 61.8% retracement at 1.1687 and above next.
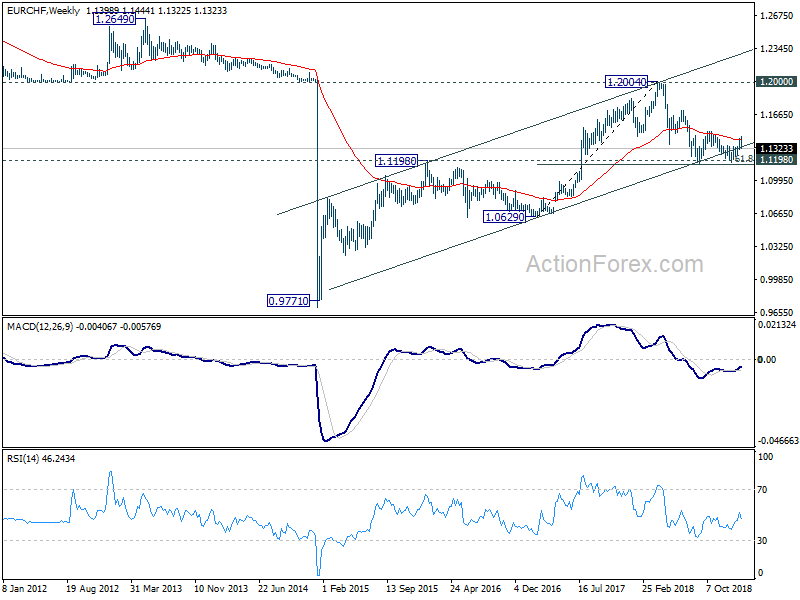
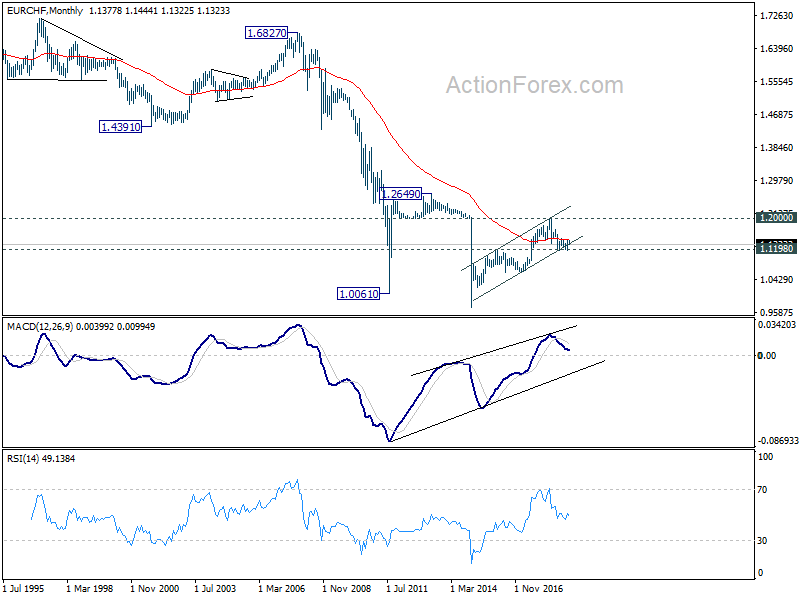
In the long term picture, as long as key support zone of 1.1198 (2016 high) and 61.8% retracement of 1.0629 to 1.2004 at 1.1154 holds, A break of 1.2 key resistance is still expected in the medium to long term. However, sustained break of the mentioned support zone will mark reversal of the long term trend. In that case, 1.0629 key support will be back into focus.
Dollar Emerged as Strongest in a Bad Batch on Global Slowdown Worries
Dollar ended last week as the strongest ones, mainly due to weakness elsewhere. Worries of global slowdown, or even recession, sent Germany and Japanese stocks sharply lower. Global treasury yields also tumbled on safe haven demand. Adding to that, renewed concern over re-escalation of US-China trade war also weighed down on sentiments. Yen and Swiss Franc followed as the next strongest.
Commodity currencies ended as the weakest ones with Australian Dollar leading the way after RBA put rate cut back onto the table. New Zealand Dollar was pressured by job data miss. Canadian Dollar was helped by strong job data but the impact of offset as oil price gyrated lower. Euro and Sterling were not much better. In particular, slowdown in Eurozone seems to be more serious that expected after EU's steep growth outlook downgrade.
Looking ahead, never-ending Brexit and US-China trade talks will remain the focus. In addition, GDP from UK, Japan, Germany and Eurozone will be particularly watched to gauge the condition of the economy.
US-China trade talk to resume as worries resurfaced
Concerns over re-escalation of US-China trade war resurfaced last week after Trump said he won't meet Chinese President Xi Jinping this month to seal the trade deal. That raised some worries that the US will go ahead and increase tariffs on USD 200B in Chinese imports from 10% to 25% on March 2, after trade truce deadline. If it happens, there will be additional pressure on the already slowing US economy, as well as the even worse slowdown in other countries globally.
For now, we won't turn pessimistic on the situation yet. Firstly, trade talks are going to resume this week. And Trump's comments might just be a negotiation tactic. Lower-level officials will kick off meetings in Beijing on Monday, on the US side led by Deputy Trade Representative Jeffrey Gerrish. Later on Thursday and Friday, high level talks will be carried out involving USTR Robert Lighthzer, Treasury Secretary Steven Mnuchin, and Chines Vice Premier Liu He. Things would then be really worrying if there is no breakthrough regarding intellectual property theft, forced technology transfer, State owned enterprises, and enforcement of agreement. For now, the situation the talks are not at that bad stage yet. Secondly, Trump will meet North Korean leader Kim Jong-un in Vietnam on February 27/8. It's easy for him to travel next door to China if the time is ripe for doing so. Thirdly, they can always extend trade truce beyond March 1.
US stocks ended the week nearly flat despite diminishing momentum
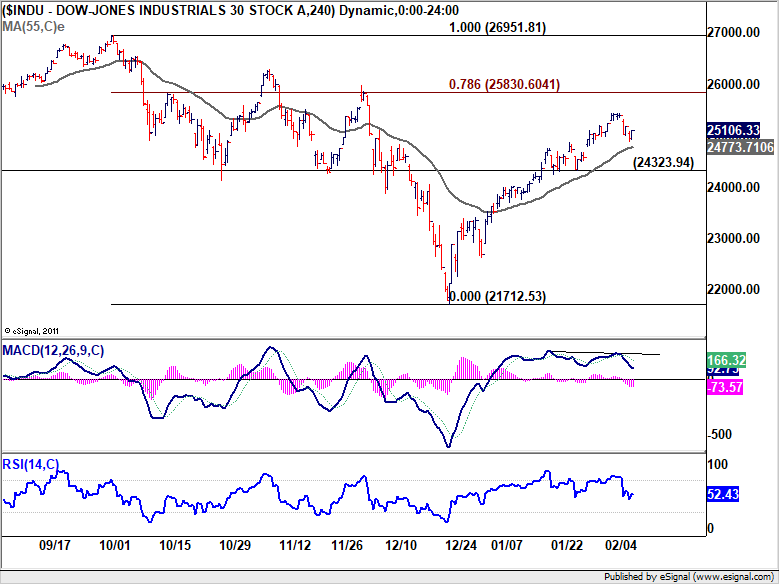
While US stocks tumbled on Thursday, major indices staged a rebound on Friday to close the week nearly flat. The development argues that investors were indeed not too worried about trade war yet. DOW has started losing momentum as seen in mild bearish divergence in 4 hour MACD. From pure technical point of view, further rise is expected as long as 24323.94 support holds. But as rise from 21712.53 extends, we'd expect DOW to continue to lose momentum as it approaches 78.6% retracement of 26951.81 to 21712.53 at 25830.60. Positive news on trade talk might push DOW through 25830.60 before topping. But negative developments would likely send it through 24323.94 support, which indicates near term reversal.
10-year yield dived, eye critical support again
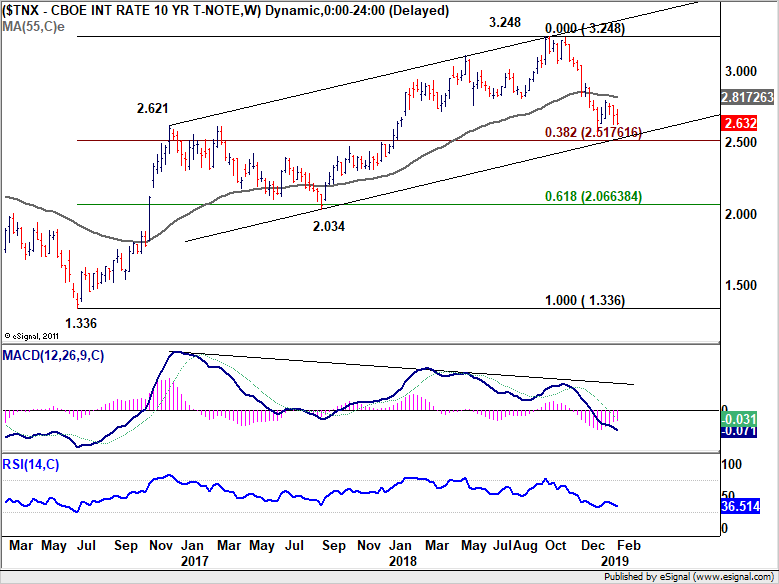
10 year-yield lost 2.7 handle again last week and closed at 2.632. The main reason for the decline should be free fall in yields in other major markets, like German and Japan, on worry of slowdown and even recession. We'd maintained that TNX is now close to critical support level. That is, 38.2% retracement of 1.336 to 3.248 at 2.517, which is close to long term channel support too. However, the failure to break 55 week EMA with the weak recovery is somewhat bearish. And sustained break of 2.517 will mark medium term reversal, which will be rather worrying.
Dollar index rebounded, but maybe just a leg in consolidation
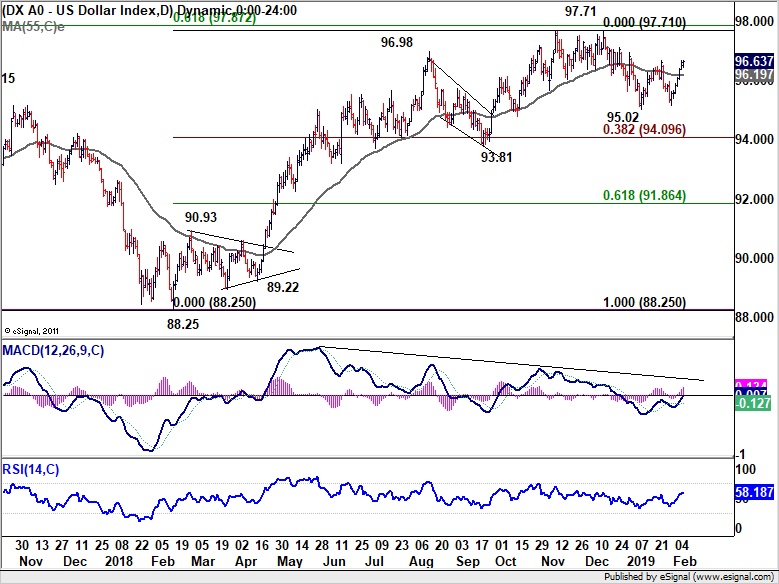
Dollar index rebounded strongly last week. The greenback was also the strongest one, mainly thanks to weakness of the others. For now, Dollar index is seen as extending the consolidation pattern from 97.71. While further rise could be seen in the near term, we don't expect a break of 97.71 high yet, at least not before EUR/USD breaks 1.1289 support decisively. Meanwhile, in case of another fall, we'd expect strong support from 93.81/94.09 support zone (38.2% retracement of 88.25 to 97.71 at 94.09) to bring rebound.
Nikkei completed corrective rebound, heading back to 18948 low
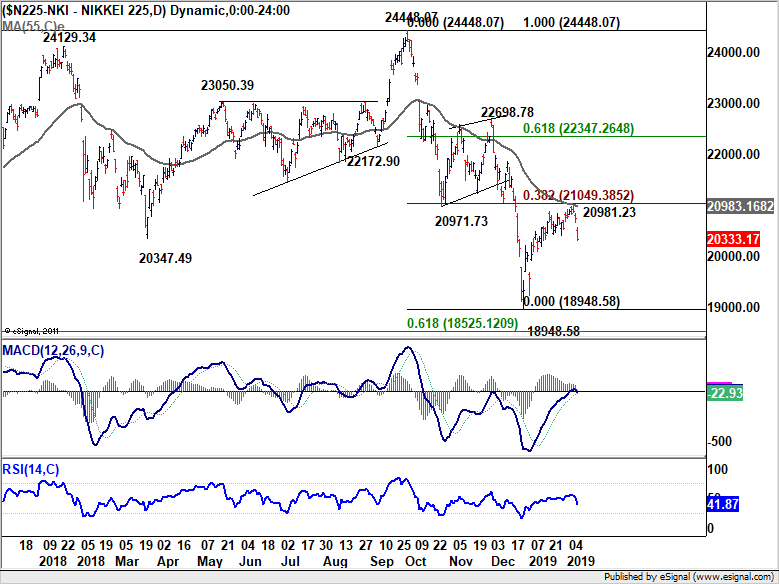
Some might argue that the sharp fall in Nikkei was a result of trade war threat. But judging from the mild reactions in Hong Kong HSI and US stocks, we'd again see the decline as result of recession worry instead. Nikkei's steep decline now argues that rebound from 18948.58 has completed at 20981.23. That came just ahead of 55 day EMA as well as 38.2% retracement of 24448.07 to 18948.58, after breaching 20971.73. Deeper decline is now in favor back to retest 18948.58 low. Indeed, current development suggests that fall from 24448.07 is now finished yet .
EU slashed 2019 growth forecast by -0.6% to 1.3%
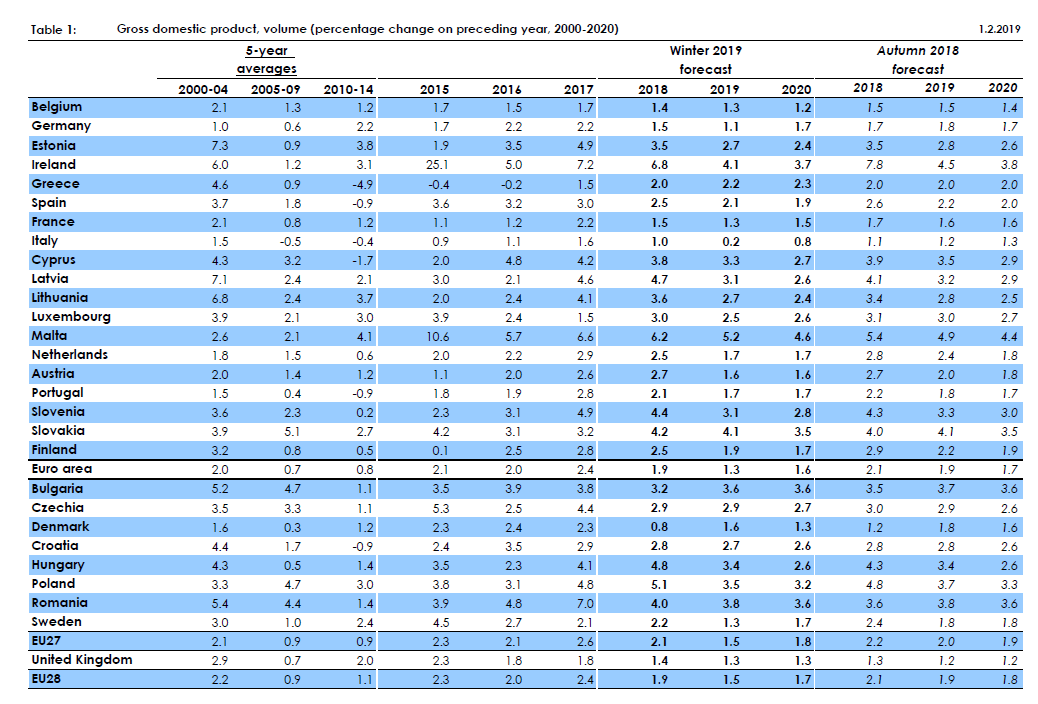
Economic projections for EU, UK and Australia were downgraded last week. Let's recap with EU first. European Commission projected EU growth to continue for the seventh year in a row in 2019, with expansion in all member states. But the pace of growth is expected to slow further as "economic momentum at the start of this year was subdued." Indeed, GDP growth for 2019 was quite sharply downgraded.
For Eurozone:
- 2019 growth is forecast to be 1.3%, versus prior forecast of 1.9%.
- 2020 growth is forecast to be 1.6% versus prior 1.7%.
- 2019 HICP inflation is projected to be 1.4%
- 2020 HICP inflation is projected to be at 1.5%.
For EU:
- 2019 growth is forecast to be 1.5%, versus prior 1.9%.
- 2020 growth is forecast to be 1.7%, versus prior 1.8%.
- 2019 HICP inflation is projected to be 1.6%
- 2020 HICP inflation is projected to be at 1.8%.
Here is the summary table:
DAX reversing for near term, Bund yield hit lowest since 2017
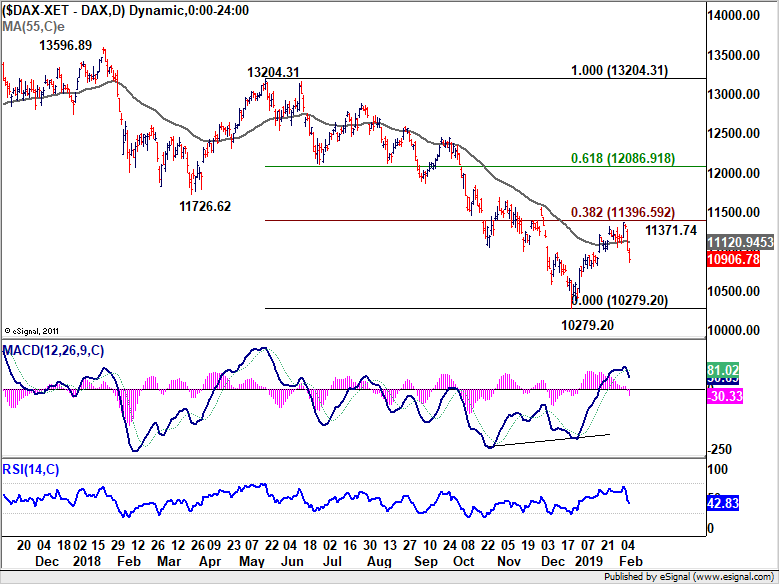
The downgrade was clearly reflected in German DAX. The development bears some similarity to Nikkei. Last week's powerful decline suggests that rebound from 10279.20 has completed at 11371.74 already, just ahead of 38.2% retracement of 13204.31 to 10279.20 at 11396.59. Deeper fall is now in favor in near term to retest 10279.20. The current development argues that down trend from 13596.89 is not finished yet and could make another low.
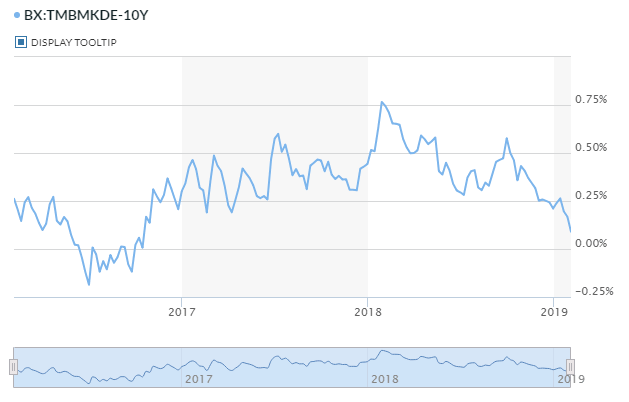
The decline in 10-year bund yield was even more serious. It closed at 0.09, down from 0.17, and hit the lowest level since late 2017. There are talks that it's heading back to negative region.
BoE downgraded growth and inflation forecast, painted slower rate hike
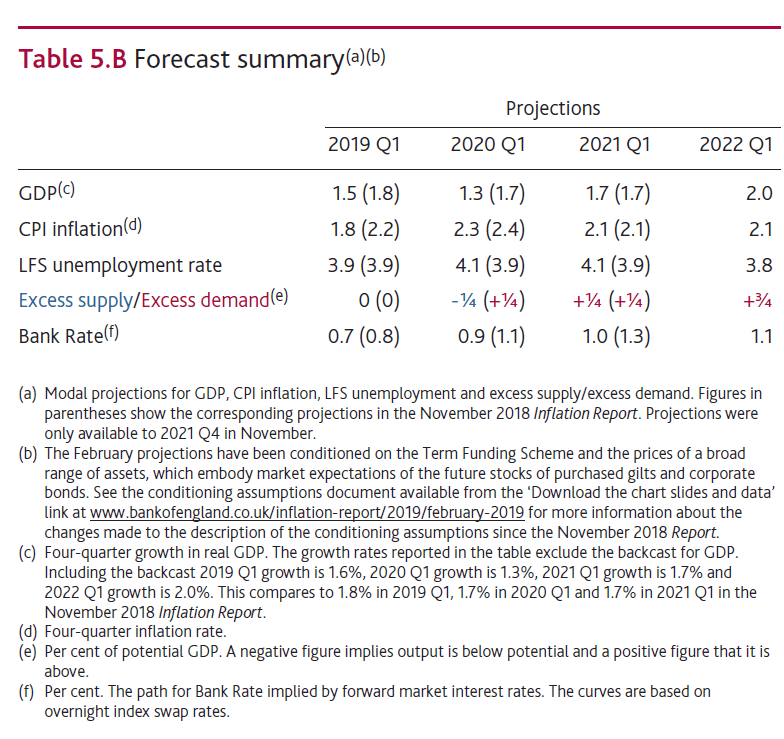
In UK, BoE 's quarterly Inflation Report delivered rather dovish projections. Growth and inflation forecasts were downgraded. Unemployment rate projects were revised higher. Meanwhile, the projected Bank rate was also revised lower across the forecast horizon. It's now suggested that BoE may only hike once, within the forecast horizon, possibly in 2020. And, such projections were already based on the assumption of a smooth Brexit. Four-quarter GDP growth:
- 1.5% in 2019 Q1, down from November forecast of 1.8%
- 1.3% in 2020 Q1, down from 1.7%
- 1.7% in 2021 Q1, unchanged
- 2.0% in 2022 Q1, new
CPI:
- 1.8% in 2019 Q1, down from 2.2%.
- 2.3% in 2020 Q1, down from 2.4%.
- 2.1% in 2021 Q1, unchanged.
- 2.1% in 2022 Q1.
Unemployment rate:
- 3.9% in 2019 Q1, unchanged.
- 4.1% in 2020 Q1, up from 3.9%
- 4.1% in 2021 Q1, up from 3.9%
- 3.8% in 2022 Q1.
Bank rate:
- 0.7% in 2019 Q1, down from 0.8%.
- 0.9% in 2020 Q1, down from 1.1%
- 1.0% in 2021 Q1, down from 1.3%.
- 1.1% in 2022 Q2, new
RBA put rate cut back to table as risks evenly balanced
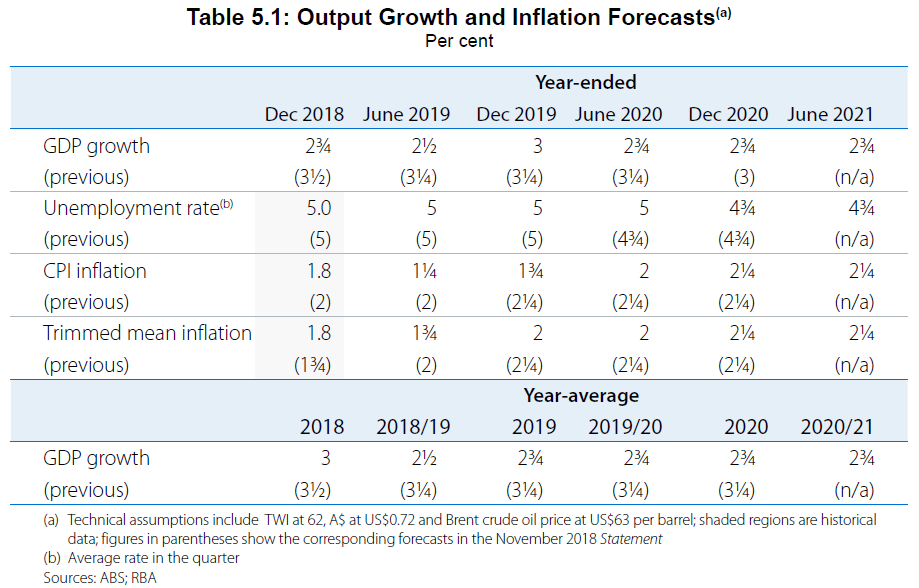
Australian Dollar was sold of sharply after RBA's balanced sheet. In short, the central bank now judges that the chances of a hike as next rate move or a cut are evenly balanced. Growth forecasts were lowered in the new economic projection. More importantly, RBA projected a slower pickup in inflation and slower decline in unemployment rate. That is, the central bank is further away from a hike, even if the next move is a hike.
In the new economic projections:
- 2019 year-end growth was revised to 3%, down from 3.25%.
- 2020 year-end growth was revised to 2.75%, down from 3%.
- June 2020 unemployment rate was revised to 5%, up from 4.75%.
- That is, unemployment rate will fall at a slower pace.
- 2019 year-end CPI was revised to 1.75%, down from 2.25%.
- 2020 year-end CPI was unchanged at 2.25%.
- That is, CPI will rise at a slower pace.
Position trading
Our USD/CHF long order was not filled and cancelled last week as updated here.
Looking ahead, we'd expect more downside in Japanese stocks as well as global treasury yields. Positive outcome from US-China trade talks might provide temporary boost. But over sentiments will remain weak on recession worries. Negative outcome will make the situation worse. Thus, risks are skewed to the downside.
With such background, we'll try to sell a Yen cross. Dollar is avoided for its own resilience. Canadian Dollar was just lifted by better than expected job data. Sterling is avoided due to Brexit uncertainty. That leaves us Euro and Aussie as candidates. Technically, breach of 1.6038 minor resistance suggest near term bullish reversal in EUR/AUD. Thus, Aussie seems to be the weaker one.
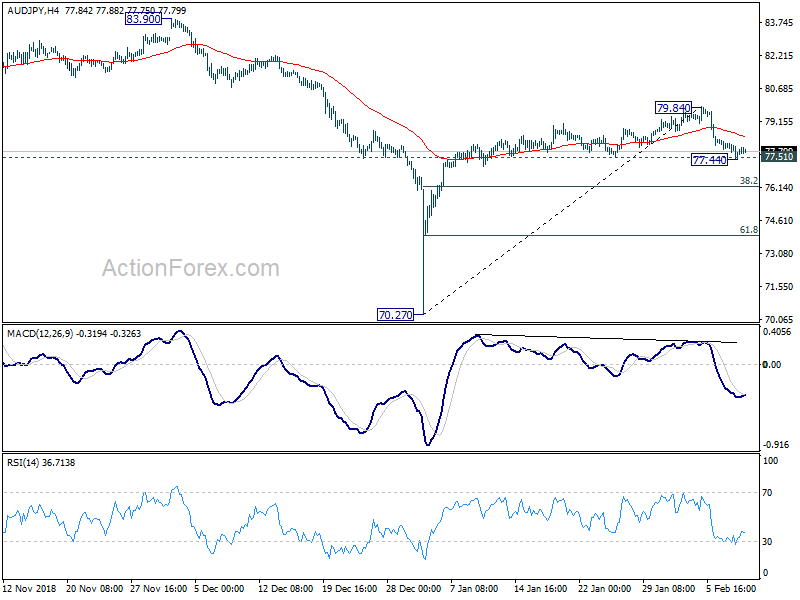
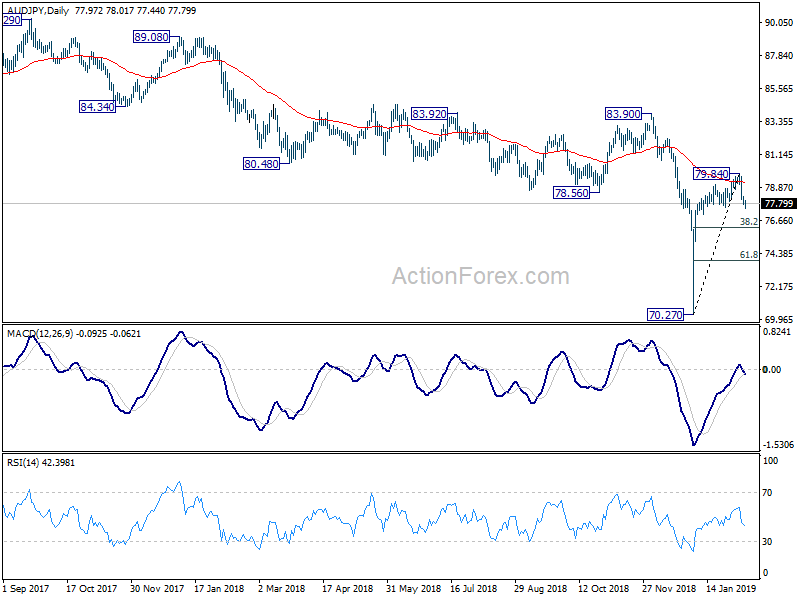
AUD/JPY's rebound from 70.27 low is likely completed at 79.84, on bearish divergence in 4 hour MACD. This is supported by rejection from 55 day EMA. Daily MACD also crossed below signal line. As AUD/JPY is drawing support from 77.51 support, we'd try to sell on recovery to 78.40, which is close to 4 hour 55 EMA. Stop is place at 79.84. As we don't expect a break of 70.27 with the current fall, our target will be put at 61.8% retracement of 70.27 to 79.84 at 73.92. This gives risk-reward ratio at 1:3.1, which is acceptable.
EUR/AUD Weekly Outlook
EUR/AUD rebounded strongly last week but failed to sustain above 1.6038 resistance retreated. Initial bias is neutral this week first. For now, we'd favor the case that decline from 1.6765 has completed at 1.5721 already, on bullish convergence condition in 4 hour MACD. Risk will stay on the upside s long as 1.5721 support holds. Decisive break of 1.6038 will confirm this bullish view and target a test on 1.6765 high. On the downside, break of 1.5721 will extend the decline to 1.5346 support instead.
In the bigger picture, as long as 1.5346 support holds, outlook will remain bullish. Uptrend from 1.1602 (2012 low) is expected to resume sooner or later. Break of 1.6765 will target 61.8% retracement of 2.1127 (2008 high) to 1.1602 at 1.7488 next. However, firm break of 1.5346 key support will indicate trend reversal, with bearish divergence condition in weekly MACD, and turn outlook bearish.
In the longer term picture, the rise from 1.1602 long term bottom (2012 low) is still in progress for 61.8% retracement of 2.1127 to 1.1602 at 1.7488. Firm break there will pave the way to 100% projection of 1.1602 to 1.6587 from 1.3624 at 1.8069. This will remain the favored case as long as 1.5346 remains intact.
Summary 2/11 – 2/15
Monday, Feb 11, 2019
[php_everywhere instance="1"]
Tuesday, Feb 12, 2019
[php_everywhere instance="2"]
Wednesday, Feb 13, 2019
[php_everywhere instance="3"]
Thursday, Feb 14, 2019
[php_everywhere instance="4"]
Friday, Feb 15, 2019
[php_everywhere instance="5"]
China Weekly Letter – Trump Backtracks on Xi Meeting, Growth Bottoming in Q1
- Donald Trump has changed his mind on Xi Jinping meeting after warnings from his advisers.
- Steven Mnuchin says his team is putting in an enormous effort to meet the deadline and China has made more concessions.
- Our China Leading Indicators show tentative signs of a bottom in Q1.
Note that there will be no China Weekly Letter next week due to holiday.
Newsflow this week has been on the light side, as China has been off celebrating Chinese New Year - a slightly delayed Happy New Year from our side, Below we give an overview of some of the things that did happen this week.
Advisers warn Trump off meeting with Xi this month
Most noteworthy, Trump yesterday backtracked on meeting Xi Jinping this month and even said next month was ' probably too soon '' to meet. This is a big change from his message last week that he might meet Xi at the end of February, when he is scheduled to meet Kim Jong-Un in Vietnam. The news rattled equity markets on fears that US tariffs will increase on 1 March (deadline of ceasefire).
Why do we see this change from Trump? According to Reuters, a person briefed on the talks said Trump's advisers had warned him that accepting a meeting invitation at this stage would raise expectations that would be hard to meet. It could result in a sell-off in markets. According to the source, Trump was also warned that it could limit US leverage in the negotiations (see Reuters , 7 February).
US-China trade talks are set to continue early next week , as a US high-level delegation goes to Beijing. Treasury Secretary Stephen Mnuchin said on CNBC, ' Ambassador Lighthizer and myself and a large team are on our way to Beijing next week' . He added 'w e're putting in an enormous amount of effort to try to hit this deadline and get a deal' (see The Hill , 6 February). Trump's economic adviser Larry Kudlow said on Thursday, ' The president has indicated that he's optimistic with respect to a potential trade deal...But we've got a pretty sizable distance to go here' .
According to SCMP , a senior Trump administration official said that of the 142 US demands, the number of items deemed non-negotiable by China had been sharply reduced .
Comment : What to make of this? It would seem Trump got a little carried away last week and that his advisers have made him aware that getting a deal down on paper and forming an agreement on wording in all areas will take time. Similarly, agreeing on how to make it enforceable - a key part of the trade deal - could take time.
We still believe the two sides want a deal badly enough to make ends meet eventually and that Trump and Xi will sign a deal at a meeting in coming months. However, it seems to us more likely that it will be at some point in Q2
Will tariffs go up on 1 March? We do not think so. This could cause havoc in markets and hit Trump like a boomerang. However, following the recent rally in stock markets, markets have priced in a higher probability trade deal and we should expect some volatility as the talks move closer to the finishing line, when more noise normally hits the news wires and each side tries to get the best deal possible.
More signs of economy bottoming in Q1
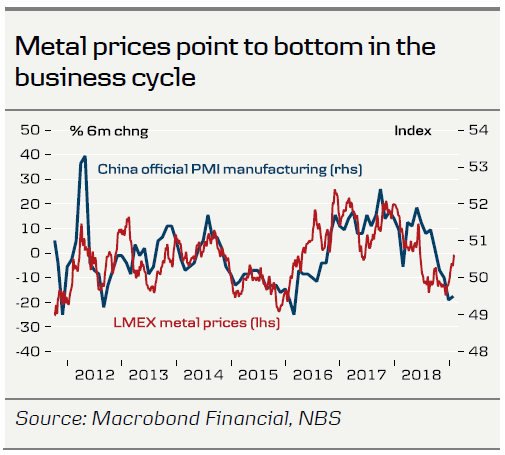
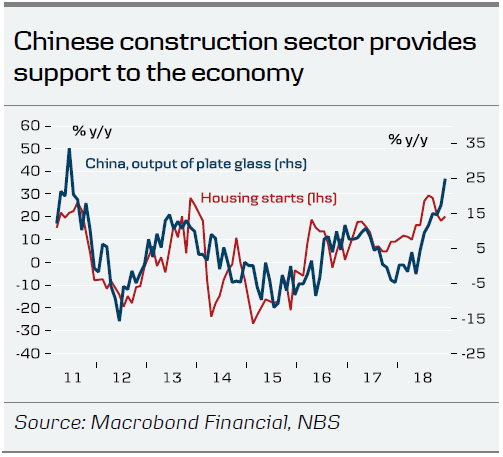
This week we published China Leading Indicators – First signs of a bottom, 7 February, which shows a few tentative signs of a bottom in Q1. This has been our call for some time, so there is a risk that we are a little biased here. However, we do believe it is worth highlighting that metal prices have edged up lately (see chart page 1) and both PMI new export orders and PMI for large enterprises (top chart) increased from low levels in January. Indicators for construction are also quite strong providing a floor under growth in China (chart).
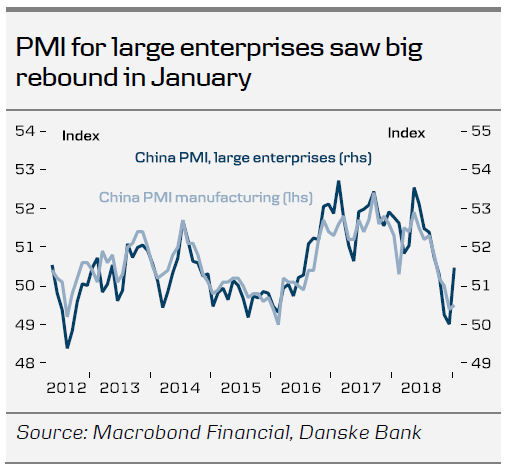
Comment: It is still early days and we need more confirmation of whether we have a bottom or not. We also need to see a trade deal in Q2. However, if we are right, it would prove important for the global business cycle as China drives one-third of global growth. It would have a positive spillover to global equity markets and to development in the euro area, which has been hit by a big decline in export growth.
Financial opening speeds up
Last week, China reported that it would double the so-called QFII quota for inbound financial investments. This week, this was followed by news that China will make the QFII programme and the RQFII programme more flexible, giving investors more investment options and providing easier access (see Caixin Global (paywall), 1 February). The two programmes allow foreign institutional investors to invest in the Chinese stock and bond markets. The new rules will 'promote high-quality opening of China's capital markets and introduce more long-term overseas capital', said the securities regulator CSRC in a statement.
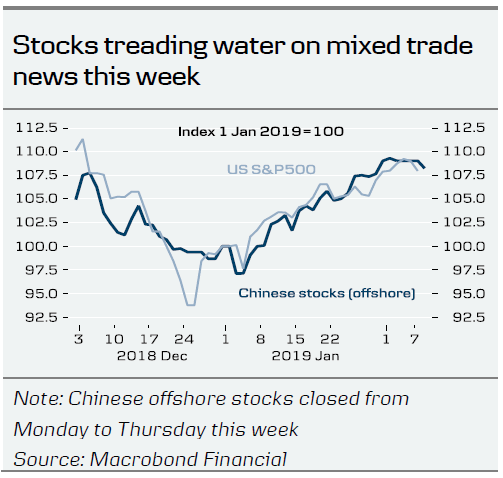
Comment: This is yet another step of many over the past few years to open up China more for inbound investments. On top of increasing quotas in the QFII/RQFII programmes, China has opened up the stock and bond connect programmes that go through Hong Kong and has increased flexibility in investing in Chinese financial assets. This is part of a long-term plan to open the way more for both financial and real investments. The gradual opening up of the capital account also fits into the plan of internationalisation of the CNY. However, increasing invoicing in CNY will also be crucial in this respect.
Other news of the week
Trump is set to sign an executive order banning Chinese telecom equipment next week (see Politico 7, February). However, both Germany and Italy said this week that they would not exclude Huawei from 5G buildout (see Reuters, 7 February).
However, Germany is launching a new industrial strategy to protect and create its own 'National Champions' in the area of technology (see Politico, 7 February). This is part of a new global trend to protect and support national tech sectors, as China has increasingly entered the scene in global tech using the industrial policy of 'Made in China 2025'.
At a micro level, you can read about how DJI went from university dorm project to the world's biggest drone company (see SCMP, 5 February). This is an impressive story of how one of China's young entrepreneurs founded the world's biggest drone company 15 years ago.