

Sample Category Title
Japan’s Leading Index Dropped As Estimated In December
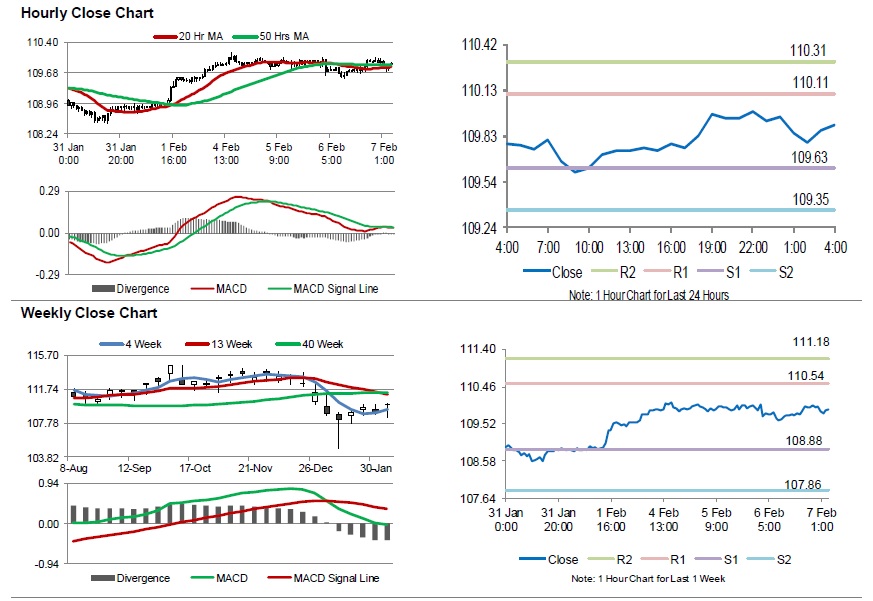
For the 24 hours to 23:00 GMT, the USD fell 0.05% against the JPY and closed at 109.93.
In the Asian session, at GMT0400, the pair is trading at 109.90, with the USD trading slightly lower against the JPY from yesterday's close.
Early morning data indicated that Japan's flash leading index fell to a level of 97.9 in December, at par with market expectations. In the previous month, the index had recorded a reading of 99.1. Moreover, the nation's coincident index declined to a level of 102.3 in December, less than market expectations for a drop to a level of 102.2. The index had registered a reading of 102.9 in the prior month.
The pair is expected to find support at 109.55, and a fall through could take it to the next support level of 109.31. The pair is expected to find its first resistance at 110.03, and a rise through could take it to the next resistance level of 110.27.
Moving ahead, traders would await Japan's trade balance and overall household spending data, both for December, scheduled to release overnight.
The currency pair is showing convergence with its 20 Hr and 50 Hr moving averages.
Swiss Franc Trading Lower In The Morning Session
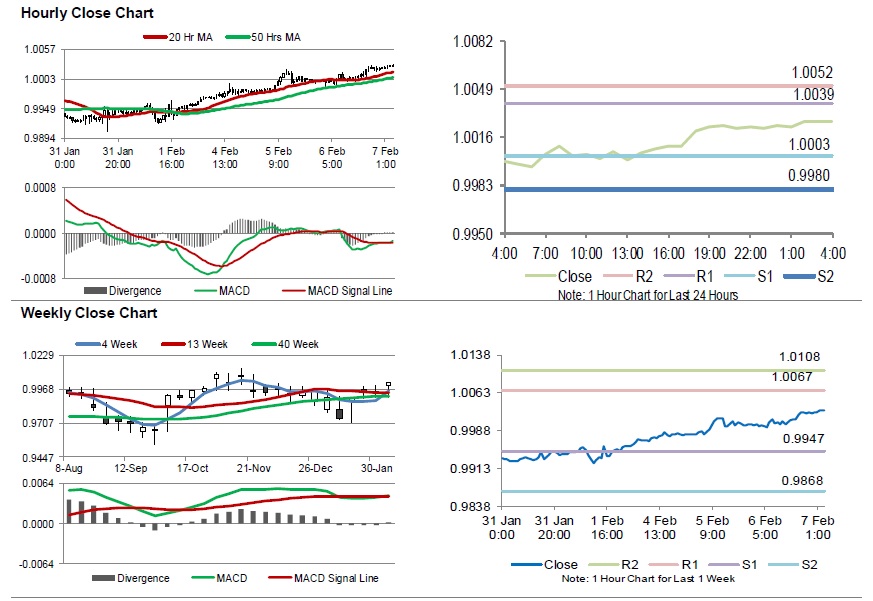
For the 24 hours to 23:00 GMT, the USD rose 0.22% against the CHF and closed at 1.0022.
In the Asian session, at GMT0400, the pair is trading at 1.0027, with the USD trading 0.05% higher against the CHF from yesterday’s close.
The pair is expected to find support at 1.0003, and a fall through could take it to the next support level of 0.998. The pair is expected to find its first resistance at 1.0039, and a rise through could take it to the next resistance level of 1.0052.
The currency pair is trading above its 20 Hr and 50 Hr moving averages.
Canada’s Building Permits Unexpectedly Rose For The Fourth Consecutive Month In December
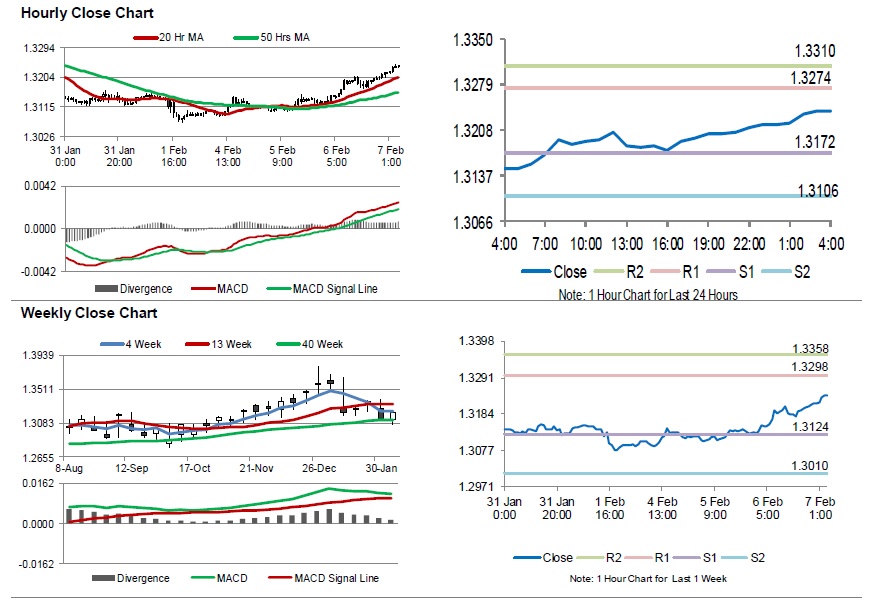
For the 24 hours to 23:00 GMT, the USD rose 0.69% against the CAD and closed at 1.3217.
On the data front, Canada's seasonally adjusted Ivey PMI fell to a level of 54.7 in January, marking its lowest level in four months and compared to a reading of 59.7 in the prior month. Meanwhile, the nation's building permits unexpectedly advanced 6.0% on a monthly basis in December, rising for the fourth consecutive month and defying market expectations for a fall of 1.0%. Building permits had climbed 2.6% in the previous month.
In the Asian session, at GMT0400, the pair is trading at 1.3239, with the USD trading 0.17% higher against the CAD from yesterday's close.
The pair is expected to find support at 1.3172, and a fall through could take it to the next support level of 1.3106. The pair is expected to find its first resistance at 1.3274, and a rise through could take it to the next resistance level of 1.3310.
The currency pair is trading above its 20 Hr and 50 Hr moving averages.
Australia’s AIG Performance Of Construction Index Advanced In January
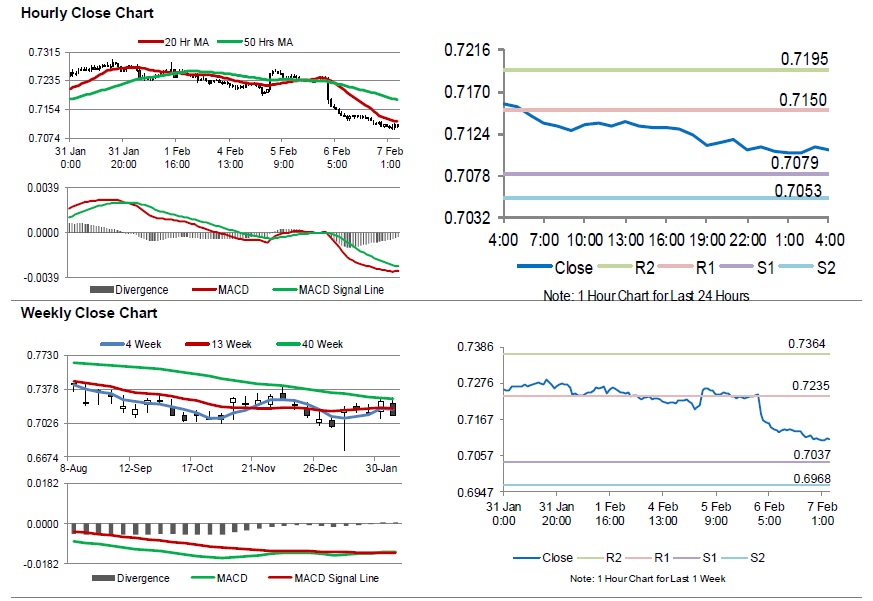
For the 24 hours to 23:00 GMT, the AUD declined 1.77% against the USD and closed at 0.7109.
LME Copper prices rose 0.6% or $36.0/MT to $6210.0/MT. Aluminium prices declined 0.5% or $10.0/MT to $1886.5/MT.
In the Asian session, at GMT0400, the pair is trading at 0.7106, with the AUD trading marginally lower against the USD from yesterday's close.
Overnight data showed that Australia's AIG performance of construction index rose to a level of 43.1 in January, compared to a level of 42.6 in the prior month. Moreover, the nation's NAB business confidence index declined to a level of 1.0 in the fourth quarter of 2018, following a level of 3.0 in the preceding quarter.
The pair is expected to find support at 0.7079, and a fall through could take it to the next support level of 0.7053. The pair is expected to find its first resistance at 0.7150, and a rise through could take it to the next resistance level of 0.7195.
Moving ahead, investors would closely monitor the Reserve Bank of Australia's monetary policy statement, scheduled to release overnight.
The currency pair is trading below its 20 Hr and 50 Hr moving averages.
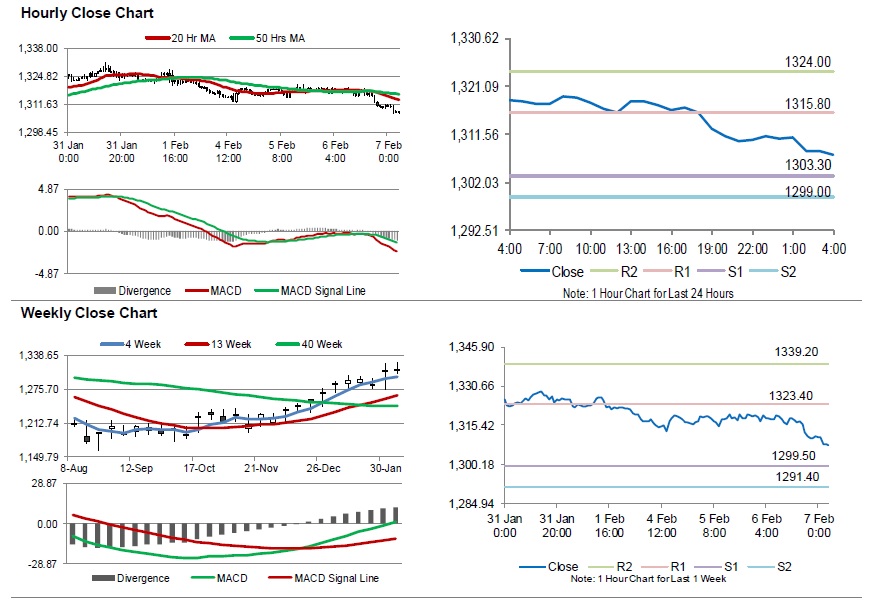
Gold: Yellow Metal Extends Its Losses In The Morning Session
For the 24 hours to 23:00 GMT, Gold declined 0.64% against the USD and closed at USD1310.50 per ounce, amid strength in the US dollar.
In the Asian session, at GMT0400, the pair is trading at 1307.60, with gold trading 0.22% lower against the USD from yesterday’s close.
The pair is expected to find support at 1303.30, and a fall through could take it to the next support level of 1299.00. The pair is expected to find its first resistance at 1315.80, and a rise through could take it to the next resistance level of 1324.00.
The yellow metal is trading below its 20 Hr and 50 Hr moving averages.
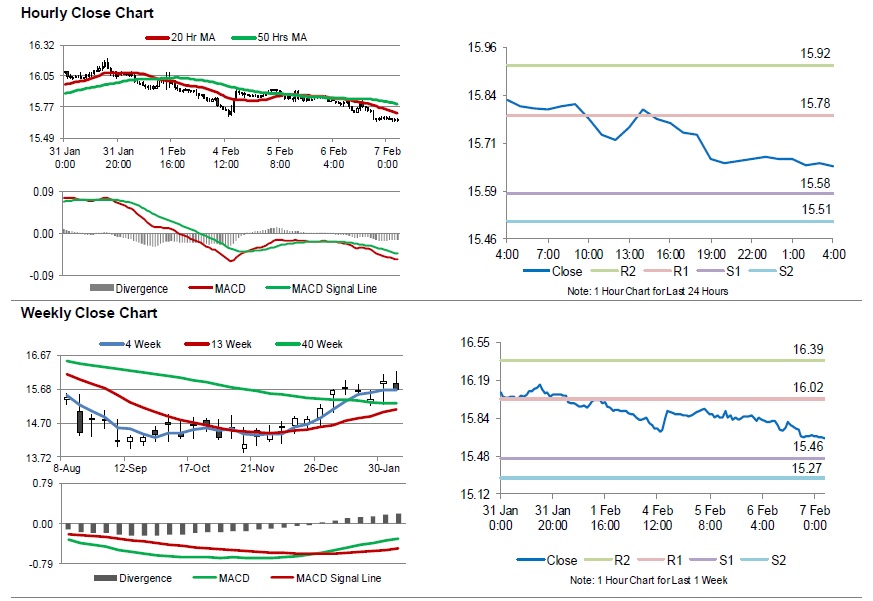
Silver: White Metal Trading On A Weaker Footing This Morning
For the 24 hours to 23:00 GMT, Silver declined 1.10% against the USD and closed at USD15.68 per ounce, tracking losses in gold prices.
In the Asian session, at GMT0400, the pair is trading at 15.65, with silver trading 0.16% lower against the USD from yesterday’s close.
The pair is expected to find support at 15.58, and a fall through could take it to the next support level of 15.51. The pair is expected to find its first resistance at 15.78, and a rise through could take it to the next resistance level of 15.92.
The white metal is trading below its 20 Hr and 50 Hr moving averages.
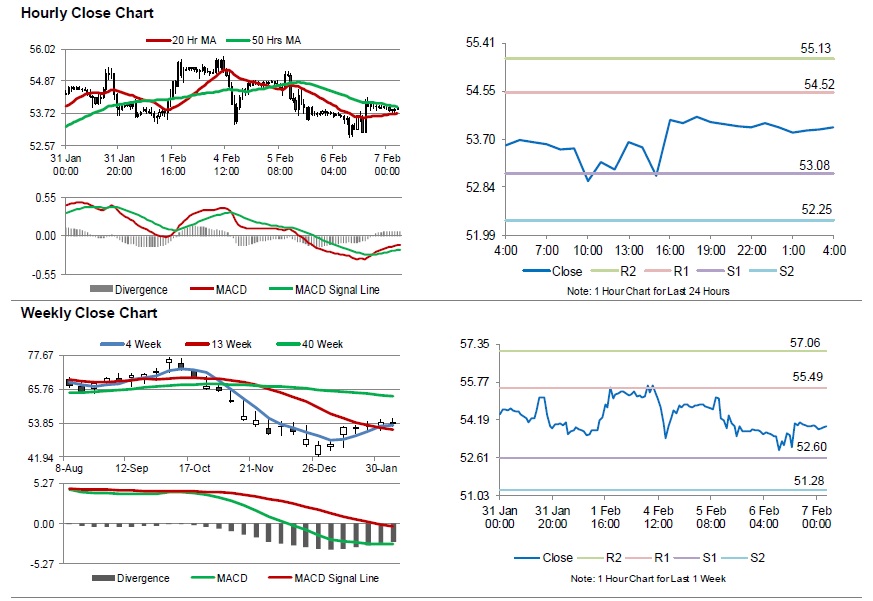
Crude Oil: Oil Reverses Its Gains In The Asian Session
For the 24 hours to 23:00 GMT, Crude Oil rose 0.47% against the USD and closed at USD53.98 per barrel, after the Energy Information Administration (EIA) report indicated that US crude oil stockpiles rose less-than-anticipated by 1.3 million barrels to 447.2 million in the week ended 01 February 2019
In the Asian session, at GMT0400, the pair is trading at 53.91, with oil trading 0.13% lower against the USD from yesterday’s close.
The pair is expected to find support at 53.08, and a fall through could take it to the next support level of 52.25. The pair is expected to find its first resistance at 54.52, and a rise through could take it to the next resistance level of 55.13.
Crude oil is trading above its 20 Hr moving average and showing convergence with its 50 Hr moving average.
Into European session: Sterling stabilizes ahead of BoE, NZD dives on job data
Entering into European session, commodity currencies are generally the weakest ones today despite steady stock and oil markets. New Zealand Dollar leads the way down after weaker than expected Q4 job data. But Canadian and Australian are not far away.
Sterling continues to stabilize and is trying to recovery. But it should be noted that there is no actual strength seen in the Pound. It's just mildly higher, in general, in tight range ahead of BoE rate decision and inflation report. Eyes will also be on UK Prime Minister Theresa May's visit to Brussels. For now, Yen is the second strongest for today, followed by Dollar.
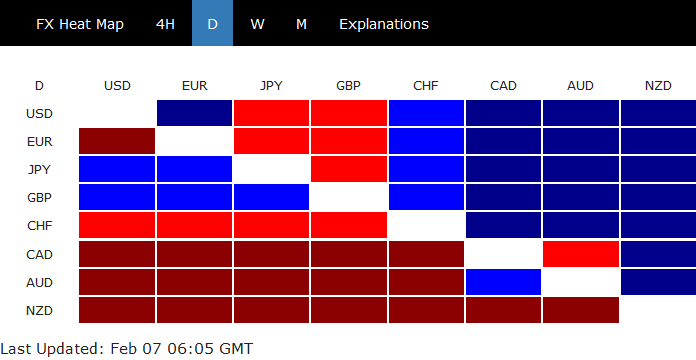
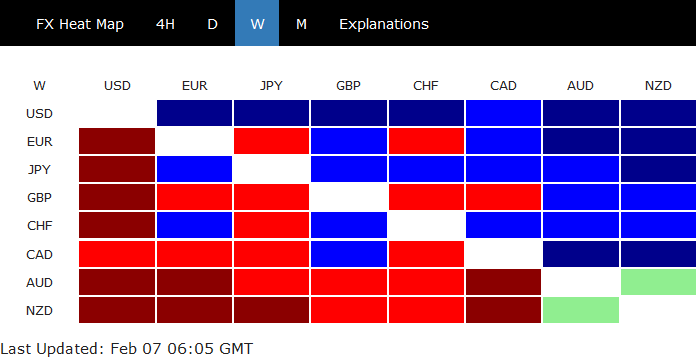
Over the week, Kiwi is the weakest one, followed by Aussie and then Sterling. Dollar is the strongest followed by Yen and Swiss Franc.
In Asia:
- Nikkei closed down -0.59%.
- Japan 10-year JGB yield is up 0.0124 at -0.004, staying negative.
- Singapore Strait Times is up 0.77%.
- Hong Kong and China are still on lunar new year holiday.
Overnight:
- DOW dropped -0.08%.
- S&P 500 dropped -0.22%.
- NASDAQ dropped -0.36%.
- 10-year yield was flat at 2.702 after dipping to 2.673.
Less- than- Expected Increase in US Inventory Fails to Rescue Crude’s Weakness
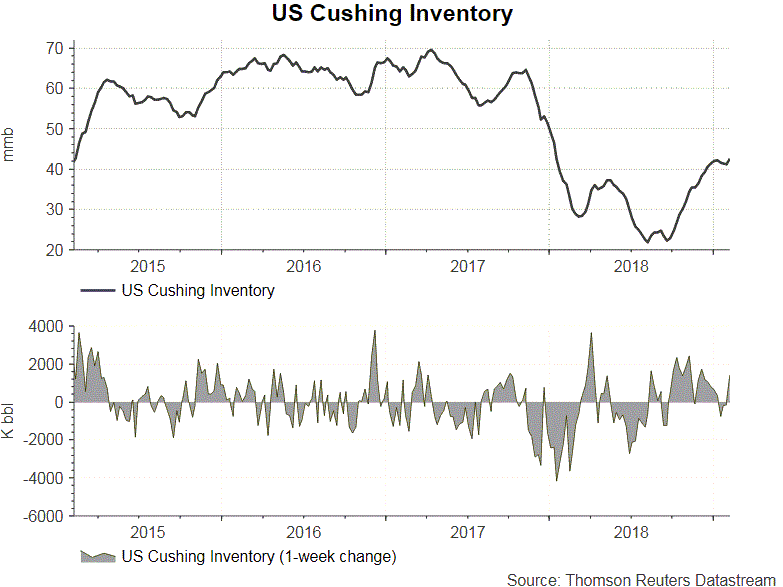
The report from the US Energy Information Administration (EIA) shows that total crude oil and petroleum products (ex. SPR) stocks declined -3.36 mmb to 1258.98 mmb in the week ended February 1. Crude oil inventory added +1.26 mmb to 447.21 mmb (consensus: +2.18 mmb). Inventories increased in 3 out of 5 PADDs. Meanwhile, Cushing stock gained +1.44 mmb to 42.63 mmb. Utilization rate added +0.6% to 90.7% and crude production steadied at 11.9M bpd for the week. Crude oil imports added +0.06M bpd to 7.15M bpd in the prior week.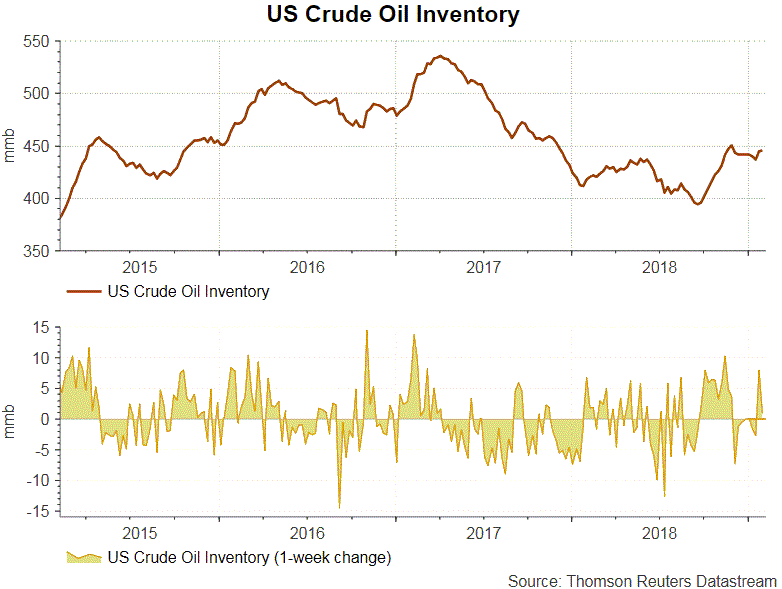
Concerning refined oil product inventories, gasoline inventory added +0.51 mmb to 257.89 mmb as demand plunged -5.13% to 9.07M bpd. The market had anticipated a +1.6 mmb increase in stockpile. Production slipped -0.48% to 9.86 bpd while imports jumped+19.5% to 0.63M bpd during the week. Distillate inventory dropped -2.26 mmb to 139.01 mmb. Demand added +1.19% to 4.67M bpd. The market had anticipated a -1.81 mmb drop gain in inventory. Production gained +2.03% to 5.12M bpd while imports soared +240% to 0.45M bpd during the week.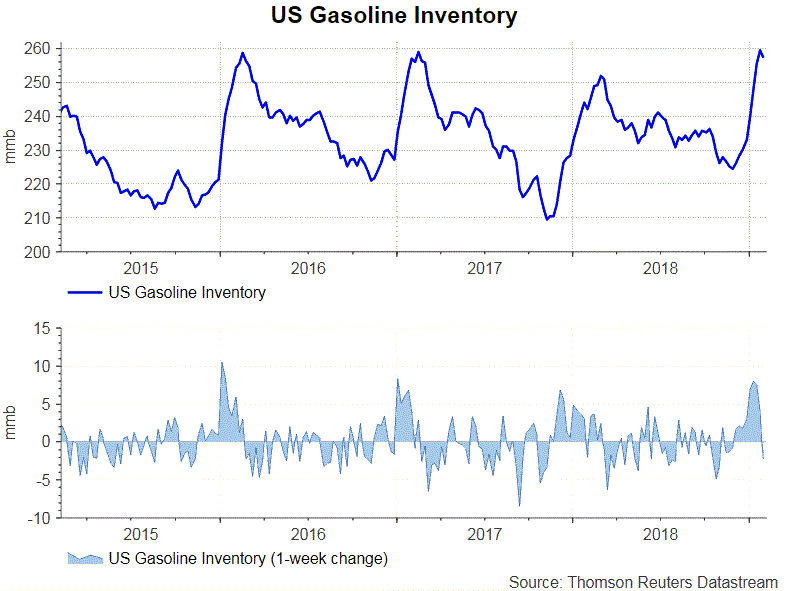
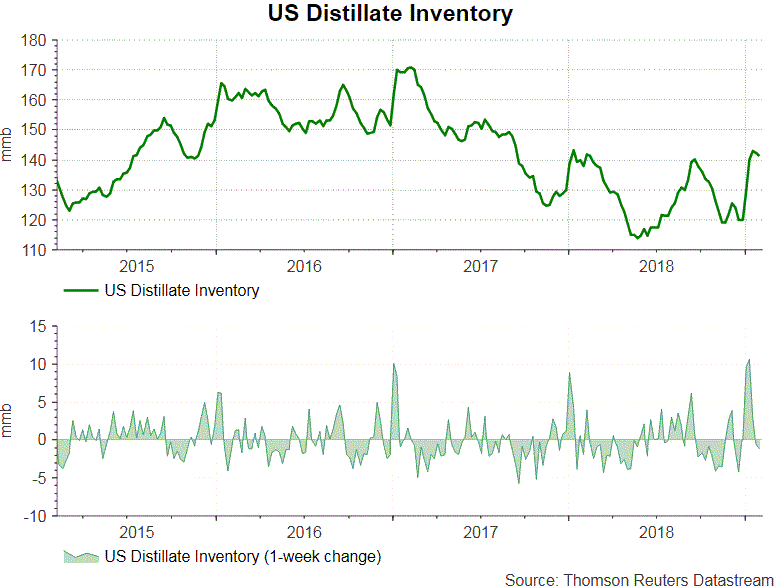 Released after market close on Wednesday, the industry- sponsored API estimated that crude oil inventory gained +2.51 mmb during the week. For refined oil products, gasoline stockpile gained +1.73 mmb while distillate added +0.14 mmb.
AUD/USD Signaling Bearish Continuation Below 0.7150
Key Highlights
- The Aussie Dollar declined recently and broke the 0.7200 support against the US Dollar.
- There was a break below a major contracting triangle with support at 0.7208 on the 4-hours chart of AUD/USD.
- The US Trade Balance in Nov 2018 posted a deficit of $-49.3B, less than the $-54.0B forecast.
- The US Initial Jobless Claims for the week ending Feb 02, 2019 will be released today, which could decline from 253K to 227K.
AUDUSD Technical Analysis
After trading towards the 0.7300 resistance, the Aussie Dollar declined heavily against the US Dollar. The AUD/USD pair declined and broke the 0.7240 and 0.7200 support levels to move into a bearish zone.
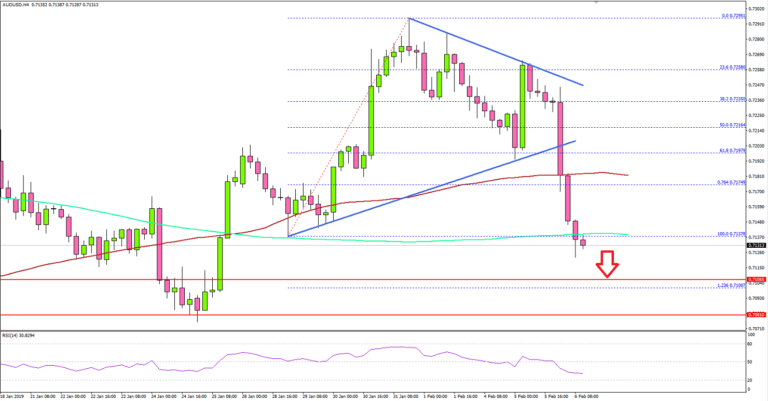
Looking at the 4-hours chart, the pair traded below the 61.8% Fib retracement level of the last wave from the 0.7137 low to 0.7295 high. Besides, there was a close below the 0.7200 support and the 100 (red) simple moving average (4-hours).
More importantly, there was a break below a major contracting triangle with support at 0.7208. The pair traded below the 0.7150 support and the last swing low of 0.7137.
Therefore, there are chances of more losses below the 0.7130 level. The next stop for buyers could be the 1.236 Fib extension level of the last wave from the 0.7137 low to 0.7295 high at 0.7100, below which the pair might test the 0.7080 support level.
If there is an upside correction, the previous support at 0.7180 and the 100 (red) simple moving average (4-hours) are likely to act as strong resistances for buyers.
Fundamentally, the US Trade Balance report for Nov 2018 was released by the Bureau of Economic Analysis and the U.S. Census Bureau. The market was looking for a trade deficit of around $-54.0B, compared with the last $-55.5B.
However, the result was better than the forecast as the deficit was less and came in at $-49.3. The Goods Trade Balance posted a deficit of $-70.48B, less than the last $-76.80B. The report stated that:
November exports were $209.9 billion, $1.3 billion less than October exports. November imports were $259.2 billion, $7.7 billion less than October imports.
Overall, AUD/USD might continue to decline towards 0.7100 and 0.7080. Other major pairs like EUR/USD and GBP/USD also declined this week and they are likely to remain in a bearish zone.
Economic Releases to Watch Today
- Germany’s Industrial Production for Dec 2018 (MoM) – Forecast +0.7%, versus -1.9% previous.
- BoE Interest Rate Decision – Forecast 0.75%, versus 0.75% previous.
- US Initial Jobless Claims – Forecast 227K, versus 253K previous.