Sample Category Title
Japanese Yen Strengthens as US Dollar Weakens Following Credit Downgrade
The USD/JPY pair declined for a fifth consecutive day, touching 145.25, as the US dollar faced sustained pressure following Moody’s decision to downgrade the US credit rating.
Key drivers affecting USD/JPY
On Friday, Moody’s cut the US credit rating from Aaa to Aa1, citing a deteriorating fiscal outlook and a lack of “effective measures” to curb the widening budget deficit.
Meanwhile, domestic data revealed that Japan’s economy contracted in Q1 2025, shrinking by 0.2% month-on-month and 0.7% year-on-year, falling short of expectations in both cases. This marks the first economic contraction of the year, driven primarily by a decline in exports.
Investors are now closely monitoring Japan’s trade figures, particularly as the potential impact of new US tariffs looms.
In a recent statement, Prime Minister Shigeru Ishiba stressed that Japan would not accept an unconditional preliminary trade deal, especially concerning automobiles. The country remains wary of a potential 25% US tariff on Japanese car imports. While Japanese diplomats are keen to finalise a trade agreement with the US swiftly, they acknowledge that the outcome is not entirely within their control.
Technical analysis: USD/JPY
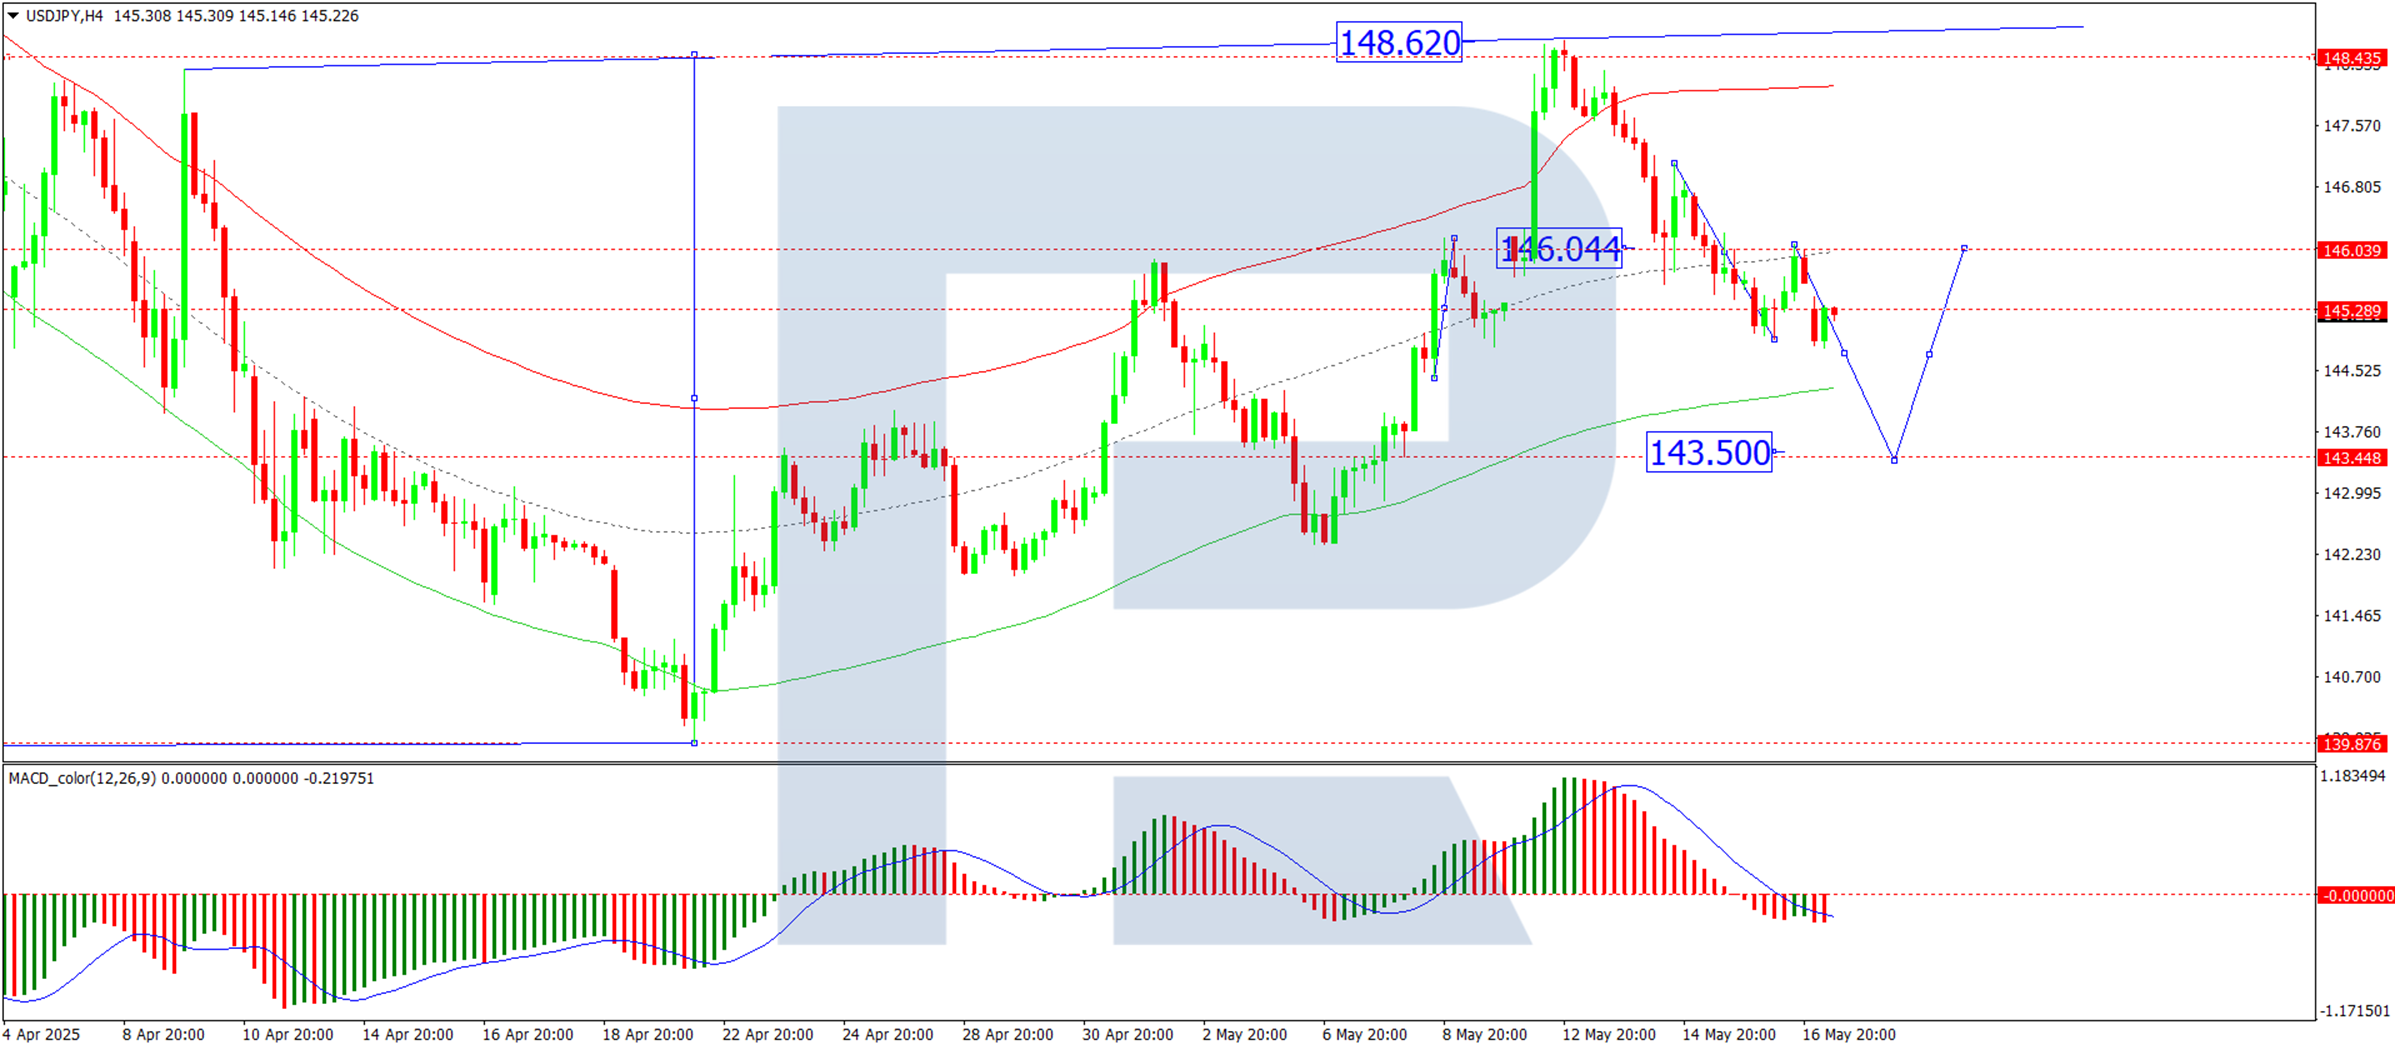
On the H4 chart, USD/JPY has corrected to 146.04, with the fifth wave of decline now in motion. The immediate downside target is 143.50, with further downward momentum expected today. Once this target is achieved, a potential rebound towards 146.04 may follow. This scenario is supported by the MACD indicator, where the signal line remains below zero and points firmly downward.
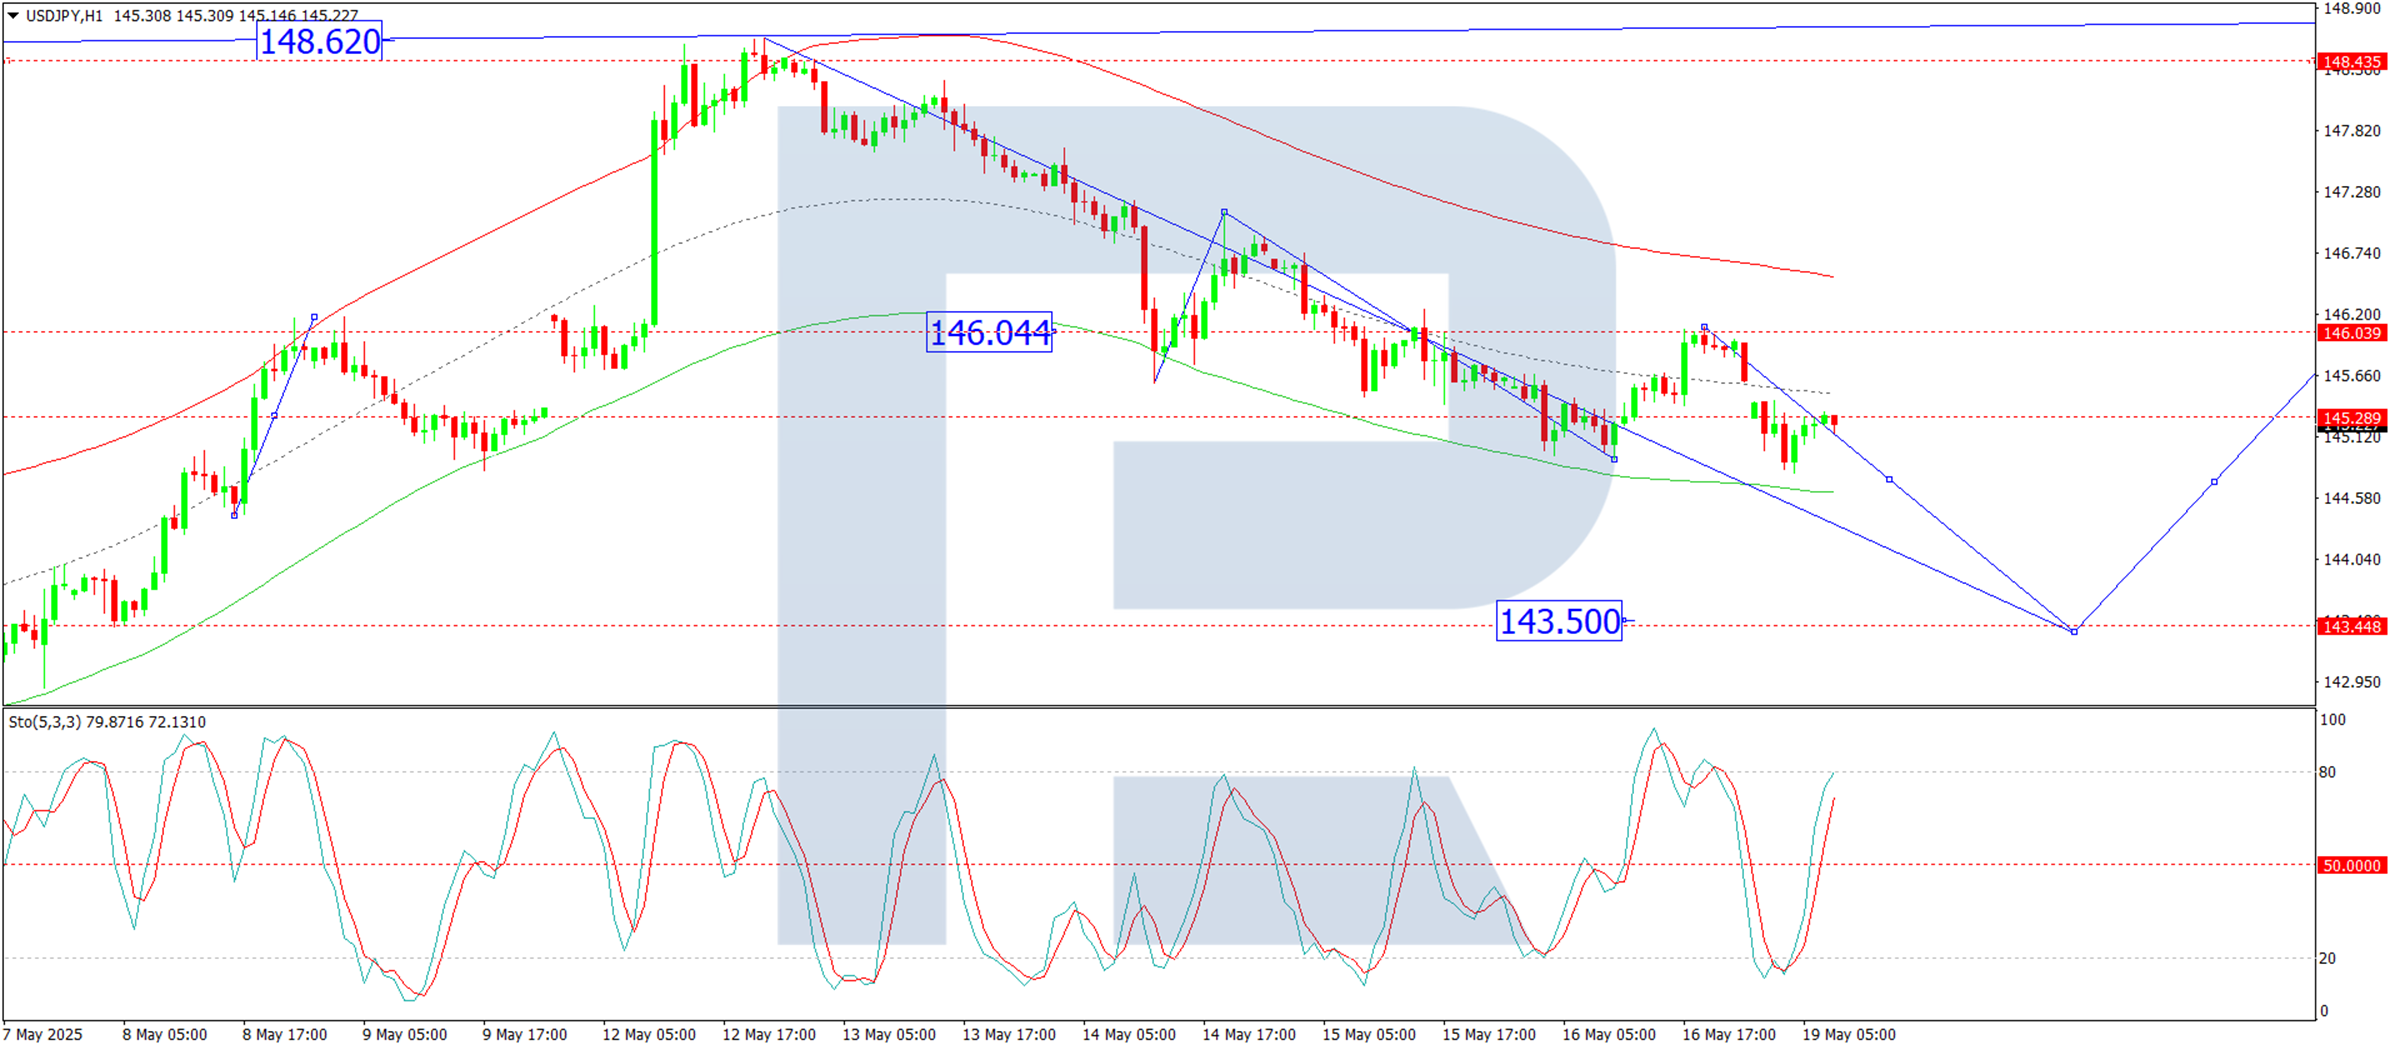
On the H1 chart, the pair consolidated around 146.04 before breaking downward. The current focus is on completing the fifth decline wave towards 143.50. So far, the pair has reached 144.80, followed by a minor correction to 145.30. The next expected move is a further drop to 144.15, with an eventual extension towards 143.50. This outlook is reinforced by the Stochastic oscillator, where the signal line has dipped below 80 and is trending sharply downward towards 20.
Conclusion
The US dollar’s weakness, exacerbated by Moody’s downgrade, continues to drive USD/JPY lower, while Japan’s economic contraction adds further complexity. Traders should monitor trade developments and technical levels for near-term direction.
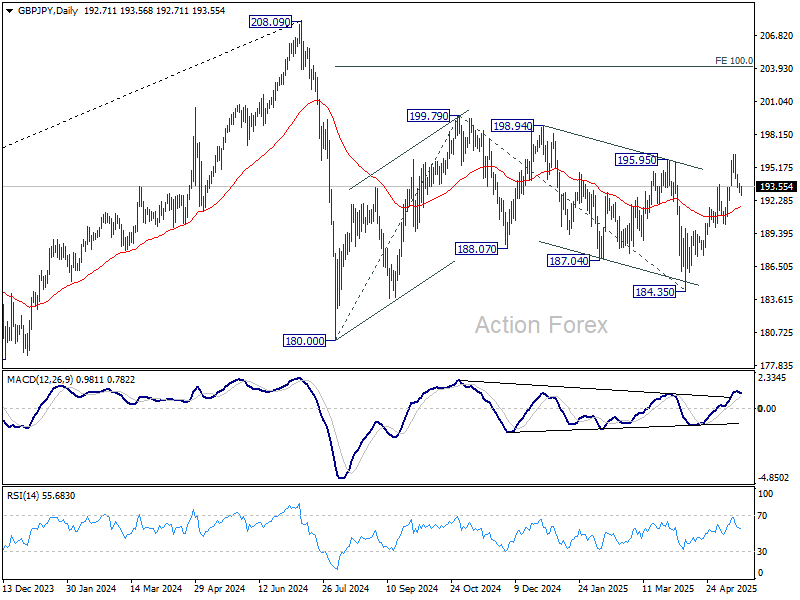
GBP/JPY Daily Outlook
Daily Pivots: (S1) 192.96; (P) 193.52; (R1) 194.00; More...
Intraday bias in GBP/JPY remains neutral and more consolidations could be seen below 196.38. Further rise is in favor as long as 190.22 support holds. On the upside, firm break of 195.95 will suggest that whole choppy decline from 199.79 has completed, and target this resistance next.
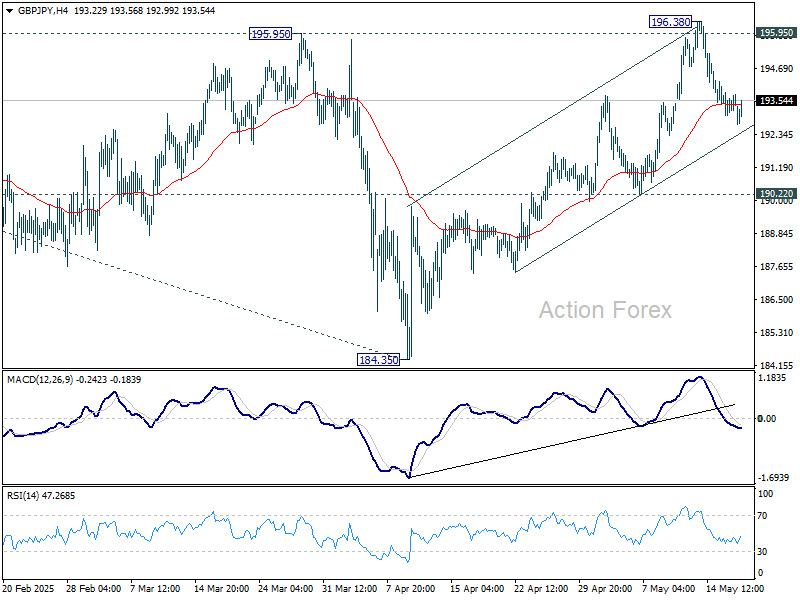
In the bigger picture, price actions from 208.09 are seen as a correction to rally from 123.94 (2020 low). Strong support should be seen from 38.2% retracement of 123.94 to 208.09 at 175.94 to contain downside. However, sustained break of 175.94 will bring deeper fall even still as a correction.
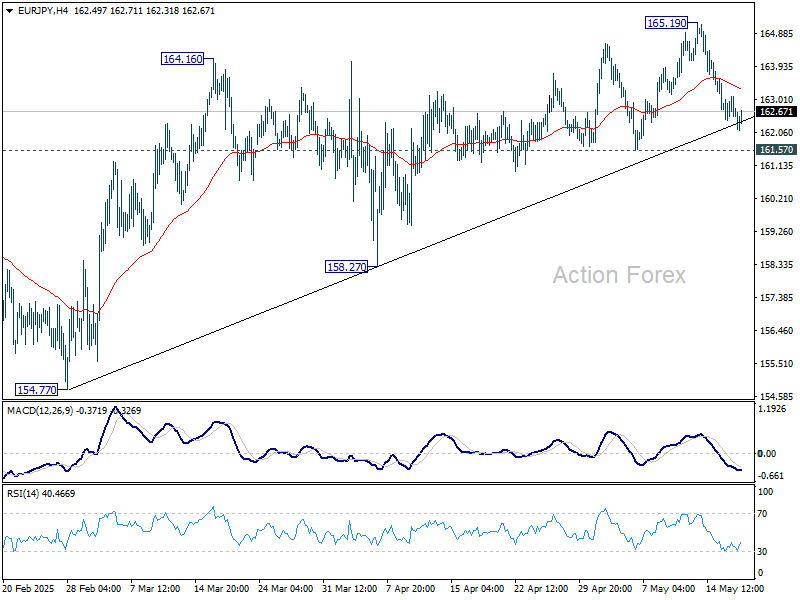
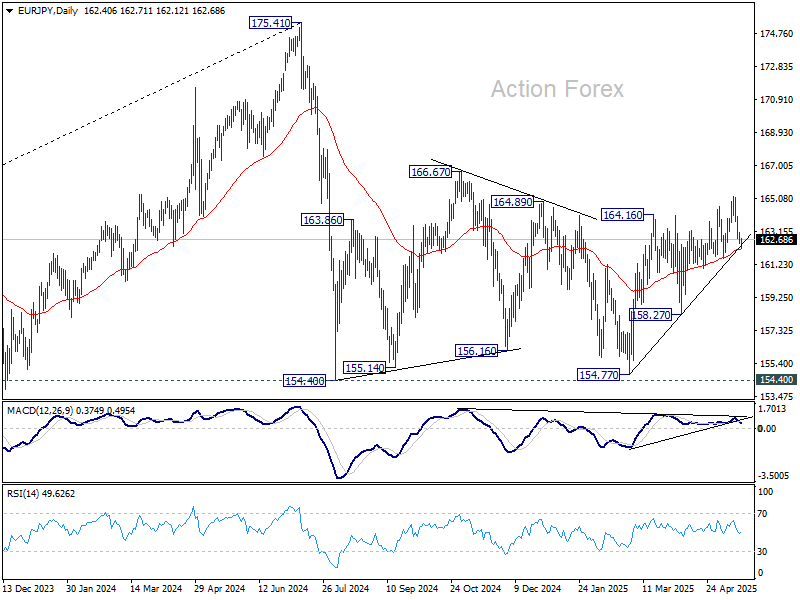
EUR/JPY Daily Outlook
Daily Pivots: (S1) 162.32; (P) 162.72; (R1) 162.97; More...
Intraday bias in EUR/JPY remains neutral and more consolidations could be seen below 165.19. Further rally is in favor as long as 161.57 support holds. Break of 165.19 will resume the rise from 154.77 to 166.67 resistance. However, firm break of 161.57 will indicate near term reversal, and turn bias back to the downside.
In the bigger picture, price actions from 175.41 are seen as correction to rally from 114.42 (2020 low). Strong support should be seen from 38.2% retracement of 114.42 to 175.41 at 152.11 to contain downside. However, sustained break of 152.11 will bring deeper fall even still as a correction.
EUR/GBP Daily Outlook
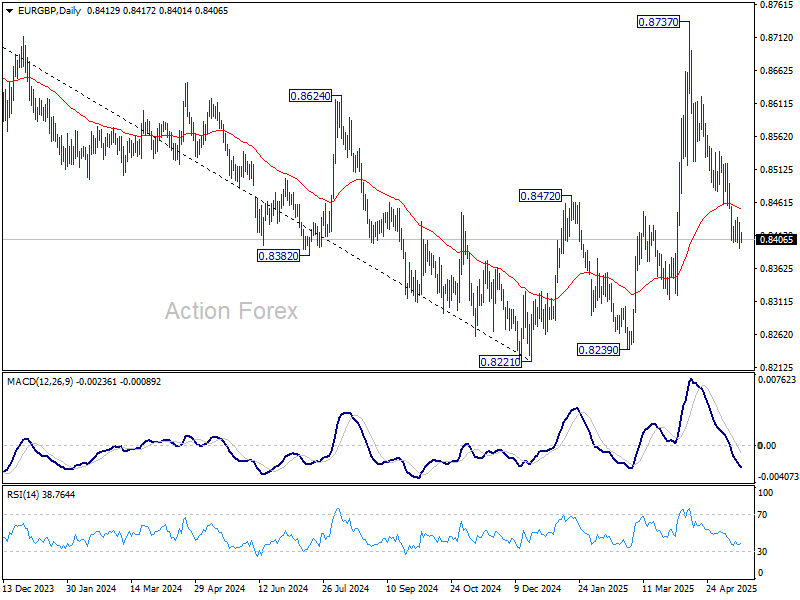
Daily Pivots: (S1) 0.8389; (P) 0.8411; (R1) 0.8428; More...
Intraday bias in EUR/GBP remains on the downside at this point. As noted before, rise from 0.8221 should have completed as a correction to 0.8737. Initial bias is on the downside this week for 0.8221/8239 support zone. On the upside, above 0.8439 minor resistance will turn intraday bias neutral again first.
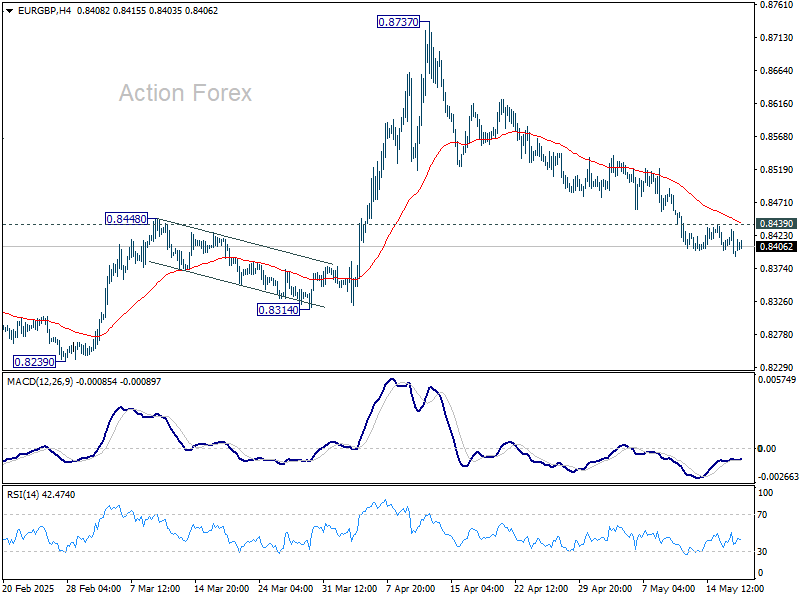
In the bigger picture, current development suggests that price actions from 0.8221 medium term bottom are merely forming a corrective pattern. However, there is no clear momentum to break through 0.8201 key support (2022 low) yet. Hence, range trading is expected between 0.8221/8737 for now.
EUR/AUD Daily Outlook
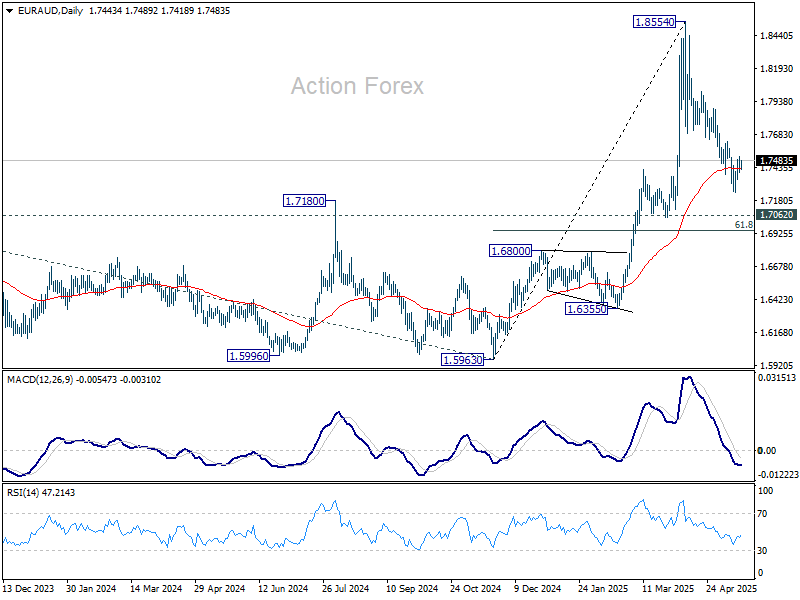
Daily Pivots: (S1) 1.7383; (P) 1.7451; (R1) 1.7502; More...
Intraday bias in EUR/AUD remains neutral at this point. On the upside, firm break of 1.7628 resistance will suggest that fall from 1.8554 as completed as a correction, and retain larger bullishness. Intraday bias will be back on the upside for stronger rebound. However, below 1.7245 will resume the fall to 61.8% retracement of 1.5963 to 1.8554 at 1.6953.
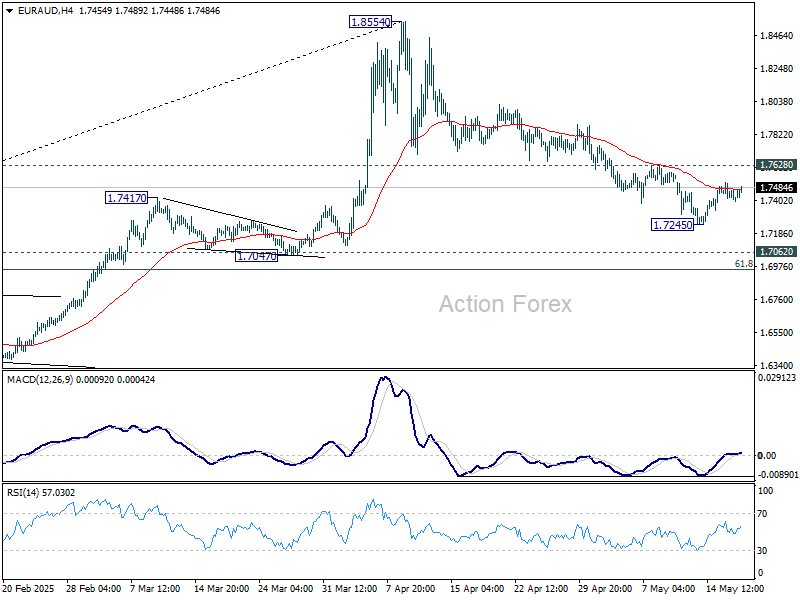
In the bigger picture, as long as 1.7062 resistance turned support (2023 high) holds, up trend from 1.4281 (2022 low) should still be in progress. Break of 1.8554 will target 100% projection of 1.4281 to 1.7062 from 1.5963 at 1.8744. However, sustained break of 1.7062 will confirm medium term topping and bring deeper fall back to 1.5963 support.
EUR/CHF Daily Outlook
Daily Pivots: (S1) 0.9328; (P) 0.9355; (R1) 0.9377; More....
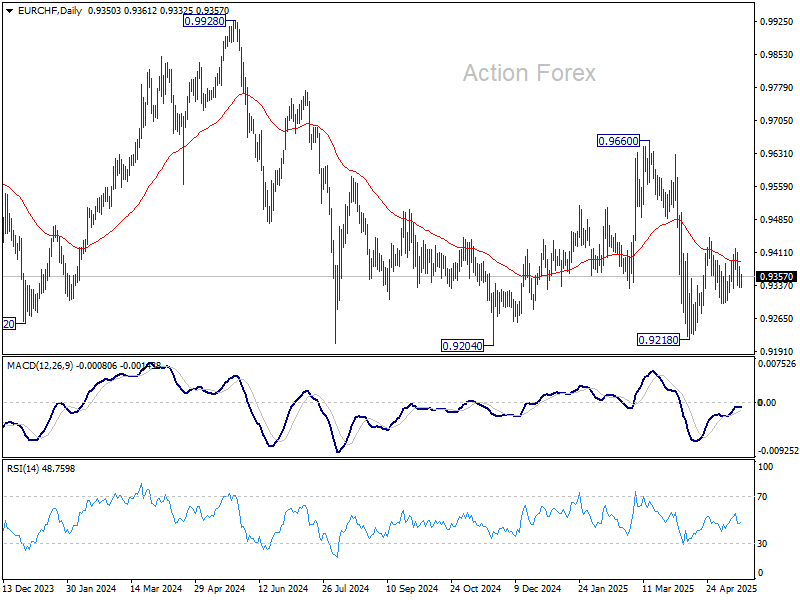
Intraday bias in EUR/CHF remains neutral as sideway trading continues. Price actions from 0.9218 are seen as either a corrective move or the third leg of the pattern from 0.9204. On the upside, break of 0.9419 will resume the rise from 0.9218 through 0.9445 resistance. However, break of 0.9296 support will bring retest of 0.9218 low.
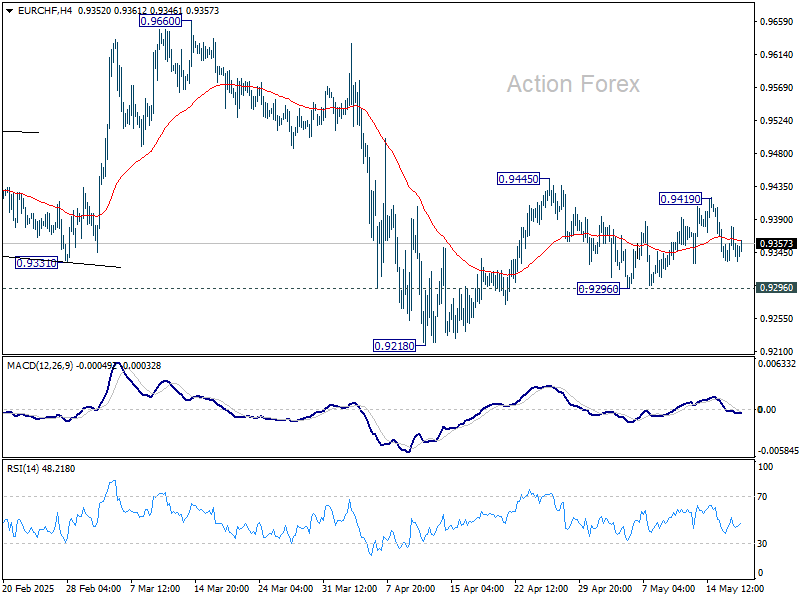
In the bigger picture, prior rejection by long-term falling channel resistance (now at 0.9548) retains medium term bearishness. That is, down trend from 1.2004 (2018 high) is still in progress. Firm break of 0.9204 (2024 low) will confirm resumption. This will remain the favored case as long as 0.9660 resistance holds.
Gold and WTI Crude Oil Prices Target Fresh Gains
Gold price started a fresh increase above the $3,210 resistance level. WTI Crude oil prices are gaining bullish momentum and might even test $63.50.
Important Takeaways for Gold and WTI Crude Oil Prices Analysis Today
- Gold price started a steady increase from the $3,120 zone against the US Dollar.
- A connecting bullish trend line is forming with support at $3,210 on the hourly chart of gold at FXOpen.
- WTI Crude climbed above the $60.90 and $61.50 resistance levels.
- There is a key rising channel forming with support at $61.30 on the hourly chart of XTI/USD at FXOpen.
Gold Price Technical Analysis
On the hourly chart of Gold at FXOpen, the price found support near the $3,120 zone. The price formed a base and started a fresh increase above the $3,150 level.
The bulls cleared the $3,200 zone and the 50-hour simple moving average. There was also a spike above the 50% Fib retracement level of the downward move from the $3,347 swing high to the $3,120 low. The RSI is now above 50 and the price could aim for more gains.
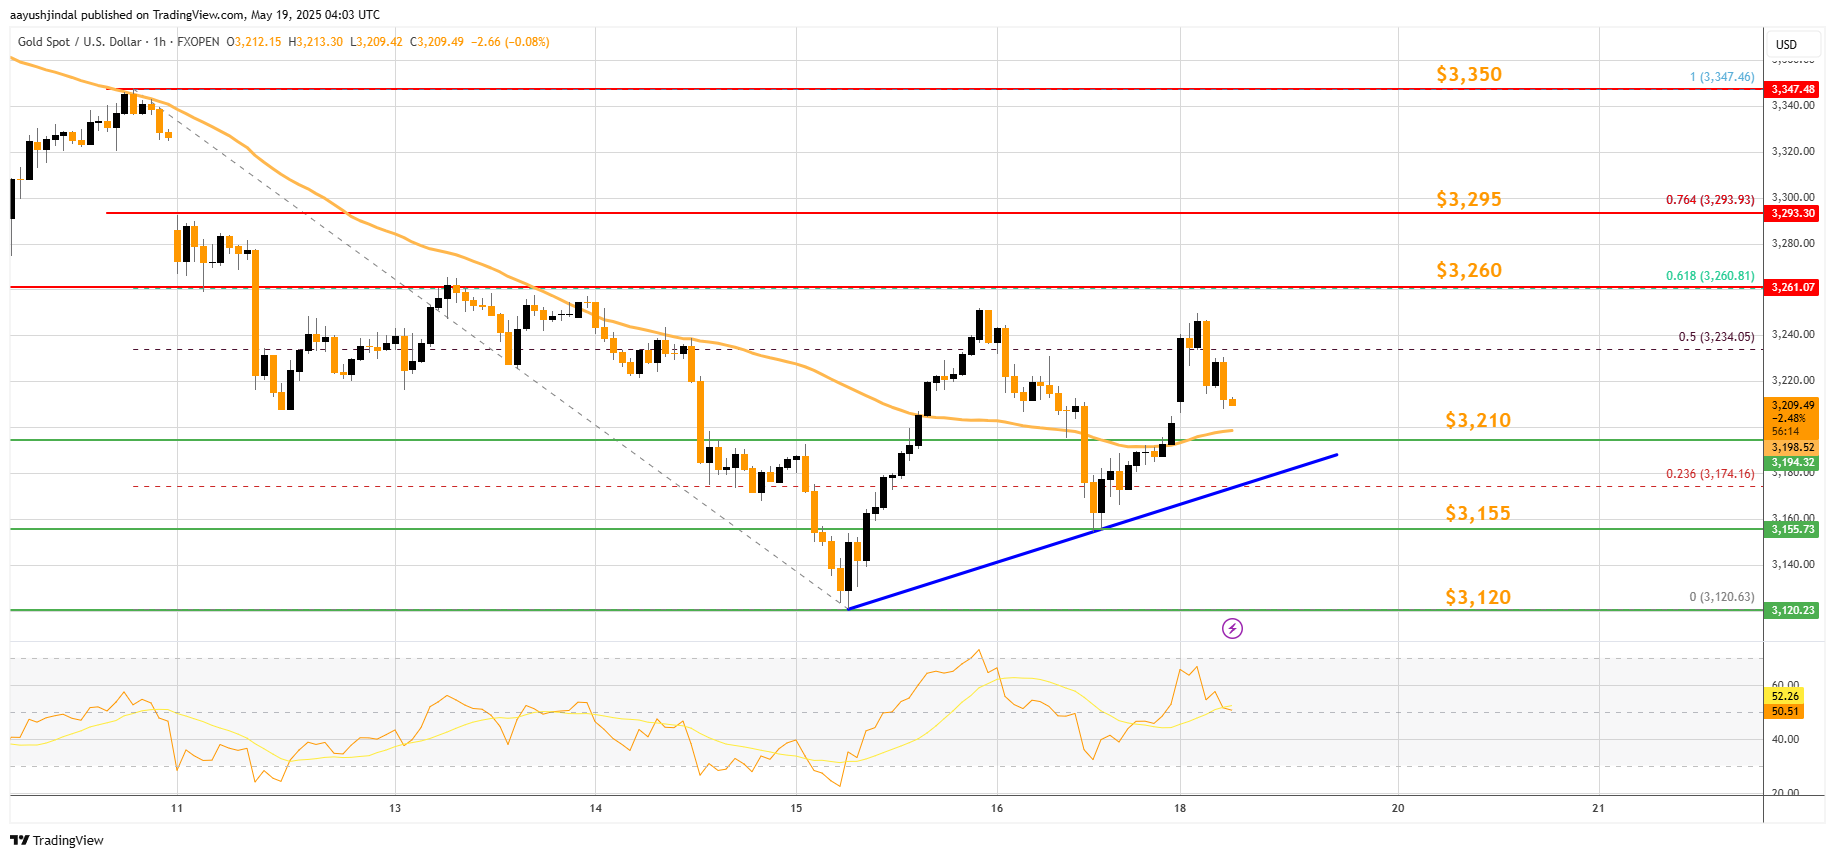
Immediate resistance is near the 61.8% Fib retracement level of the downward move from the $3,347 swing high to the $3,120 low at $3,260.
The next major resistance is near the $3,295 level. An upside break above the $3,295 resistance could send Gold price toward $3,350. Any more gains may perhaps set the pace for an increase toward the $3,385 level.
Initial support on the downside is near the $3,210 zone. There is also a connecting bullish trend line forming with support at $3,210. If there is a downside break below the $3,210 support, the price might decline further.
In the stated case, the price might drop toward the $3,155 support. The next major support sits at $3,120. Any more losses might send the price toward the $3,060 level.
WTI Crude Oil Price Technical Analysis
On the hourly chart of WTI Crude Oil at FXOpen, the price started a fresh upward move from $60.10 against the US Dollar. The price gained bullish momentum after it broke the $60.90 resistance.
The bulls pushed the price above the 50% Fib retracement level of the downward move from the $63.45 swing high to the $60.08 low. The price even climbed above the 50-hour simple moving average.
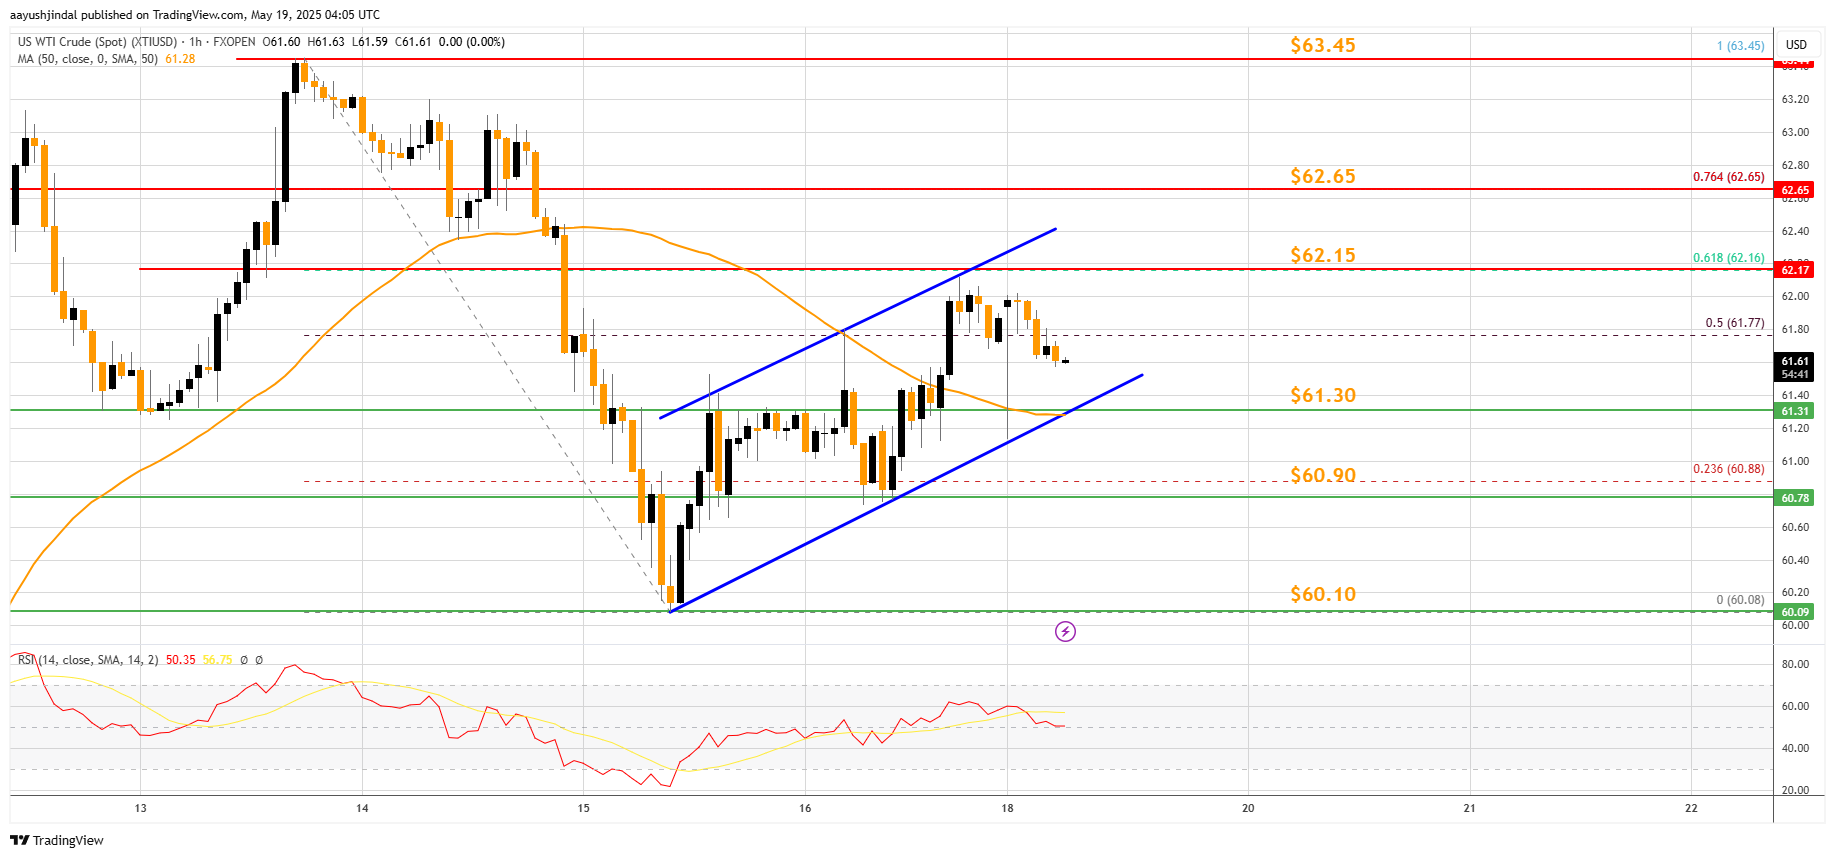
It tested the $62.15 resistance zone and the 61.8% Fib retracement level of the downward move from the $63.45 swing high to the $60.08 low. There is now a key rising channel forming with support at $61.30.
The RSI is now near the 50 level and the price could aim for more gains. If the price climbs higher again, it could face resistance near $62.15. The next major resistance is near the $62.65 level. Any more gains might send the price toward the $63.45 level or even $65.00.
Conversely, the price might correct gains and test the $61.30 support level. The next major support on the WTI crude oil chart is near the $60.90 zone, below which the price could test the $60.10 zone.
If there is a downside break, the price might decline toward $58.50. Any more losses may perhaps open the doors for a move toward the $55.50 support zone.
Start trading commodity CFDs with tight spreads. Open your trading account now or learn more about trading commodity CFDs with FXOpen.
This article represents the opinion of the Companies operating under the FXOpen brand only. It is not to be construed as an offer, solicitation, or recommendation with respect to products and services provided by the Companies operating under the FXOpen brand, nor is it to be considered financial advice.
EUR/USD Daily Outlook
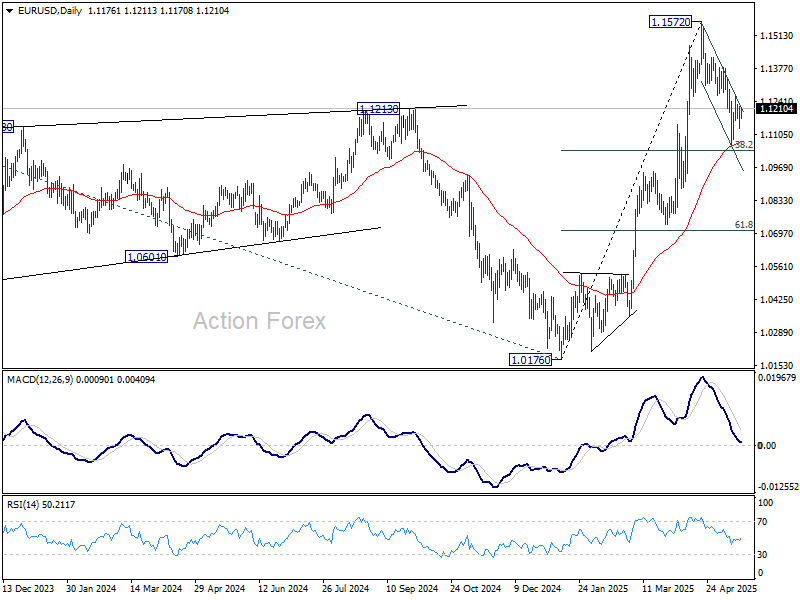
Daily Pivots: (S1) 1.1123; (P) 1.1171; (R1) 1.1212; More...
Intraday bias in EUR/USD remains neutral for the moment. Strong support is still expected from 38.2% retracement of 1.0176 to 1.1572 at 1.1039 to complete the correction from 1.1572. On the upside, above 1.1292 will bring stronger rise back to retest 1.1572. However, sustained break of 1.1039 will dampen this view and target 61.8% retracement at 1.0709 next.
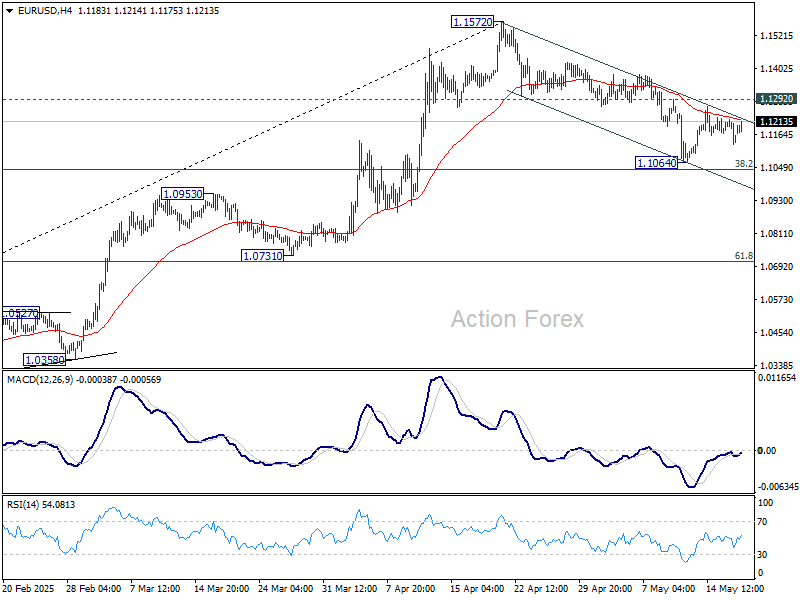
In the bigger picture, rise from 0.9534 long term bottom could be correcting the multi-decade downtrend or the start of a long term up trend. In either case, further rise should be seen to 100% projection of 0.9534 to 1.1274 from 1.0176 at 1.1916. This will now remain the favored case as long as 55 W EMA (now at 1.0818) holds.
GBP/USD Daily Outlook
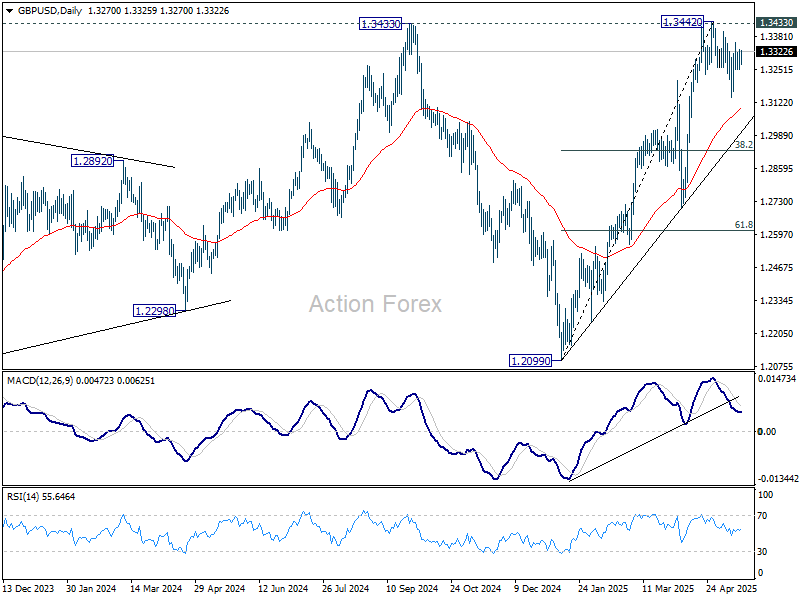
Daily Pivots: (S1) 1.3242; (P) 1.3288; (R1) 1.3325; More...
Intraday bias in GBP/USD remains neutral and more range trading could be seen. On the upside, decisive break of 1.3433/42 key resistance zone will confirm larger up trend resumption. Nevertheless, below 1.3138 will resume the correction from 1.3442. But downside should be contained by 38.2% retracement of 1.2099 to 1.3442 at 1.2929 to bring rebound.
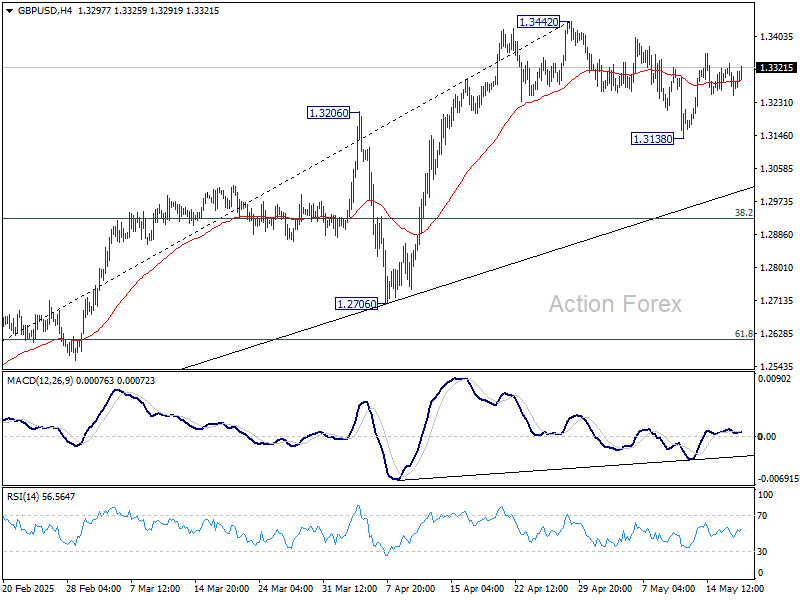
In the bigger picture, price actions from 1.3433 are seen as a corrective pattern to the up trend from 1.3051 (2022 low). Rise from 1.2099 could either be resuming the up trend, or the second leg of a consolidation pattern. Overall, GBP/USD should target 1.4248 key resistance (2021 high) on decisive break of 1.3433 at a later stage.
USD/JPY Daily Outlook
Daily Pivots: (S1) 145.01; (P) 145.56; (R1) 146.19; More...
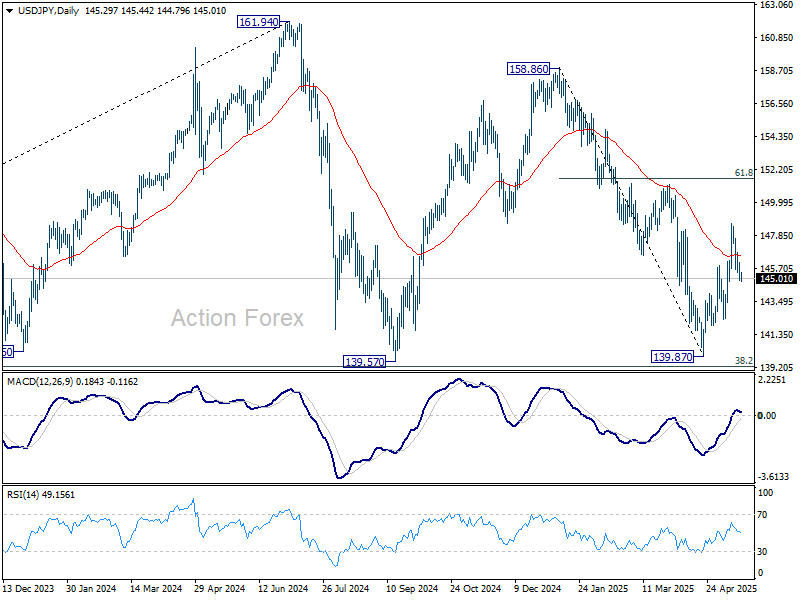
Intraday bias in USD/JPY remains neutral for the moment. . Fall from 158.86 might have completed at 139.87 already. Further rise is in favor as long as 144.02 support holds. Above 148.64 will target 61.8% retracement of 158.86 to 139.87 at 151.60 next. However, firm break of 144.02 will bring retest of 139.87 low instead.
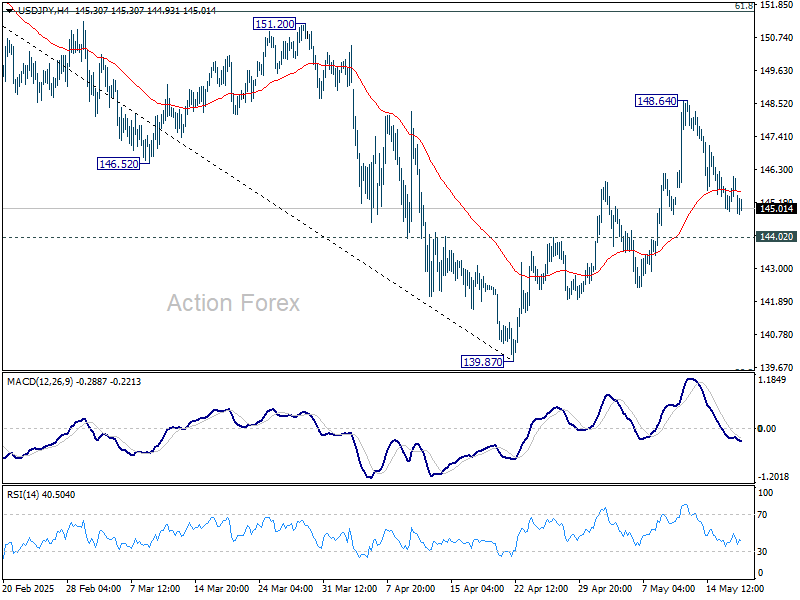
In the bigger picture, price actions from 161.94 are seen as a corrective pattern to rise from 102.58 (2021 low), with fall from 158.86 as the third leg. Strong support should be seen from 38.2% retracement of 102.58 to 161.94 at 139.26 to bring rebound. However, sustained break of 139.26 would open up deeper medium term decline to 61.8% retracement at 125.25.