
Sample Category Title
USD/CHF Daily Outlook
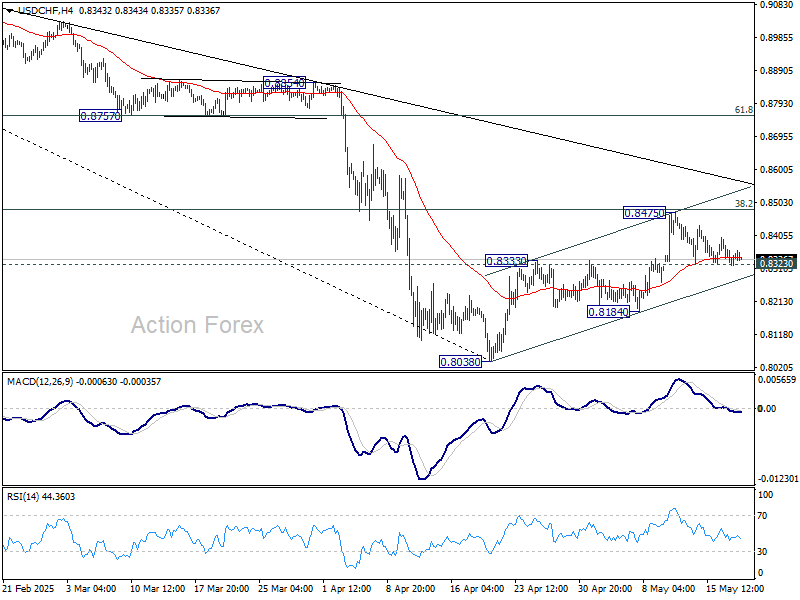
Daily Pivots: (S1) 0.8318; (P) 0.8349; (R1) 0.8378; More….
Intraday bias in USD/CHF remains neutral as sideway trading continues. On the downside, firm break of 0.8323 support will argue that corrective rebound from 0.8038 has completed at 0.8475, after rejection by 38.2% retracement of 0.9200 to 0.8038 at 0.8482. Intraday bias will be back on the downside for 0.8184, and then retest of 0.8038 low. However, sustained trading above 0.8482 will dampen this bearish view and target 61.8% retracement at 0.8756 next.
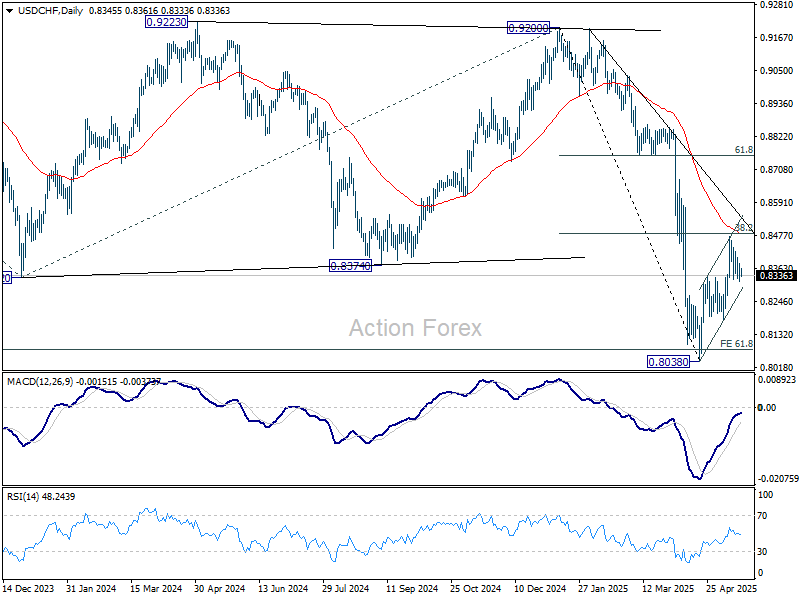
In the bigger picture, long term down trend from 1.0342 (2017 high) is still in progress and met 61.8% projection of 1.0146 (2022 high) to 0.8332 from 0.9200 at 0.8079 already. In any case, outlook will stay bearish as long as 55 W EMA (now at 0.8765) holds. Sustained break of 0.8079 will target 100% projection at 0.7382.
USD/CAD Daily Outlook
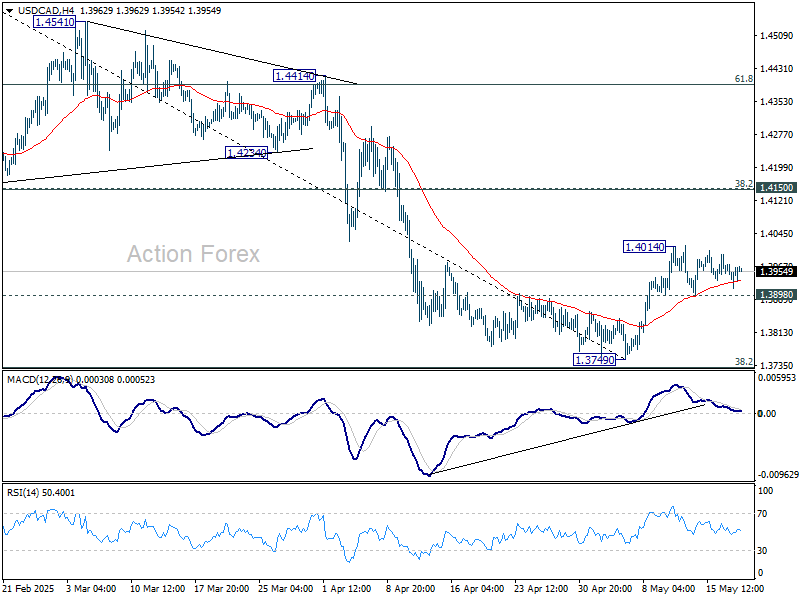
Daily Pivots: (S1) 1.3920; (P) 1.3947; (R1) 1.3977; More...
Sideway trading continues in USD/CAD below 1.4014 and intraday bias stays neutral. Further rise is in favor with 1.3898 support intact. On the upside, above 1.4014 will resume the rebound from 1.3749 short term bottom to 1.4150 cluster resistance (38.2% retracement of 1.4791 to 1.3749 at 1.4147). However, firm break of 1.3898 will bring retest of 1.3749 low instead.
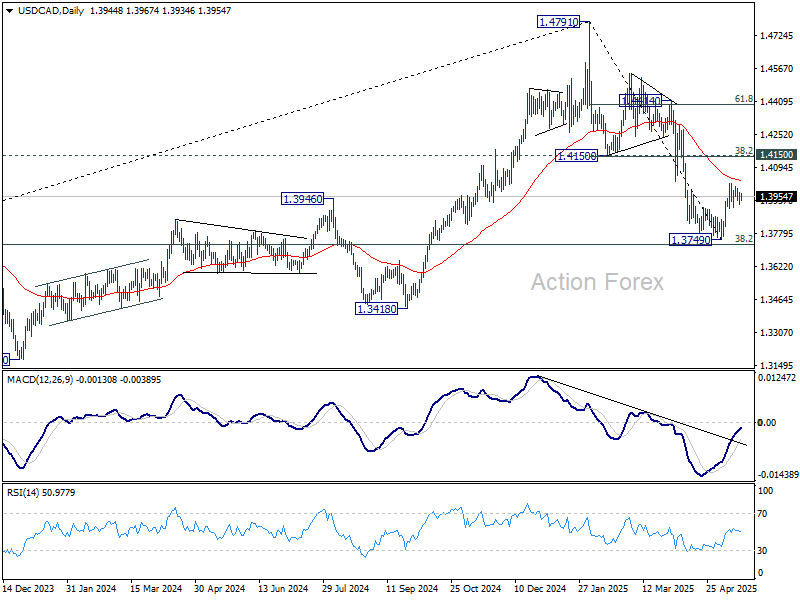
In the bigger picture, price actions from 1.4791 medium term top could either be a correction to rise from 1.2005 (2021 low), or trend reversal. In either case, further decline is expected as long as 1.4150 resistance turned support holds. Firm break of 38.2% retracement of 1.2005 (2021 low) to 1.4791 at 1.3727 will pave the way back to 61.8% retracement at 1.3069.
AUD/USD Daily Report
Daily Pivots: (S1) 0.6415; (P) 0.6440; (R1) 0.6482; More...
AUD/USD dips mildly today but stays in range of 0.6356/6511. Intraday bias remains neutral and further rise is in favor. One the upside, break of 0.6511 will resume the rise from 0.5913 and target 61.8% retracement of 0.6941 to 0.5913 at 0.6548. However, firm break of 0.6356 will bring deeper pullback to 38.2% retracement of 0.5913 to 0.6511 at 0.6283 first.
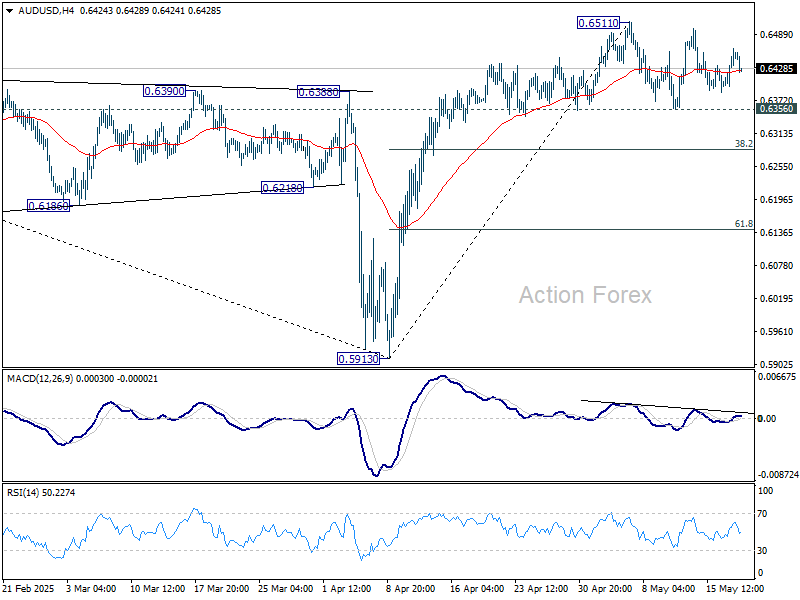
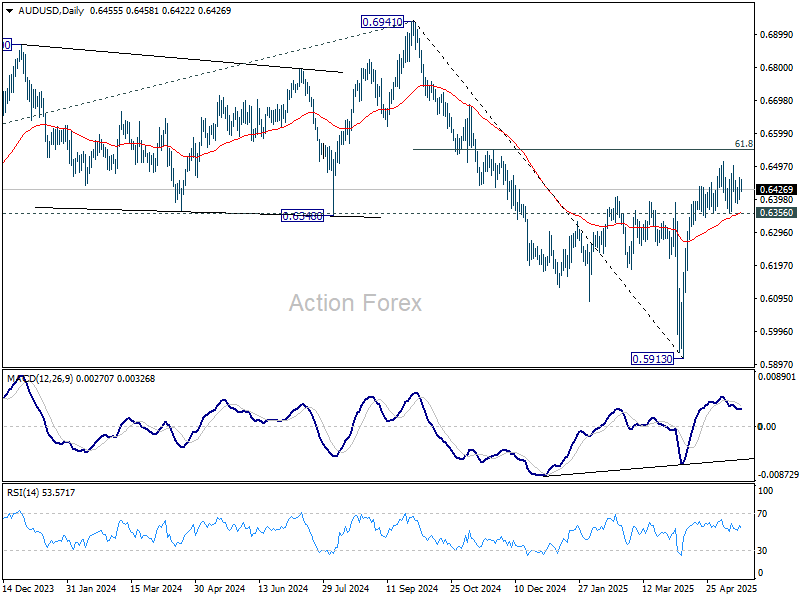
In the bigger picture, as long as 55 W EMA (now at 0.6438) holds, down trend from 0.8006 (2021 high) should resume later to 61.8% projection of 0.8006 to 0.6169 from 0.6941 at 0.5806. However, sustained trading above 55 W EMA will argue that a medium term bottom was already formed, and set up further rebound to 0.6941 resistance instead.
Aussie Dips on RBA’s Dovish Tilt, But Risk Sentiment Provides Cushion
Aussie softened modestly following the RBA’s widely expected 25bps rate cut to 3.85%. But selling was contained as broader market sentiment remained supportive.
While the move itself was no surprise, the updated economic forecasts leaned dovish, notably with headline CPI now seen at just 3.0% by year-end, down from the previous 3.7% projection. This downward revision in inflation opens the door for RBA to maintain a steady path of policy easing.
More importantly, should global trade tensions re-escalate or downside risks materialize, especially from US tariff policy uncertainty, there is ample room for the central bank to accelerate its rate cuts.
Despite the RBA’s dovish bias, Aussie found some footing amid steady risk sentiment. US equities shrugged off the initial shock from Moody’s credit rating downgrade, with major indexes finishing higher. Meanwhile, US 10-year yields also retreated from their earlier spike, indicating that investor appetite for Treasuries remains intact for now. Across Asia, sentiment was further bolstered by China’s latest easing move, with the PBoC cutting its key LPRs for the first time in seven months.
Meanwhile, on the trade front, Japan is maintaining a firm stance in negotiations with the US. Top trade official Ryosei Akazawa reaffirmed that Tokyo would not rush into a deal at the expense of national interests. Japan continues to push for full tariff elimination, including automobiles, car parts, and metals. Talks with the US are ongoing at the working level, but no date has been set for a third ministerial meeting.
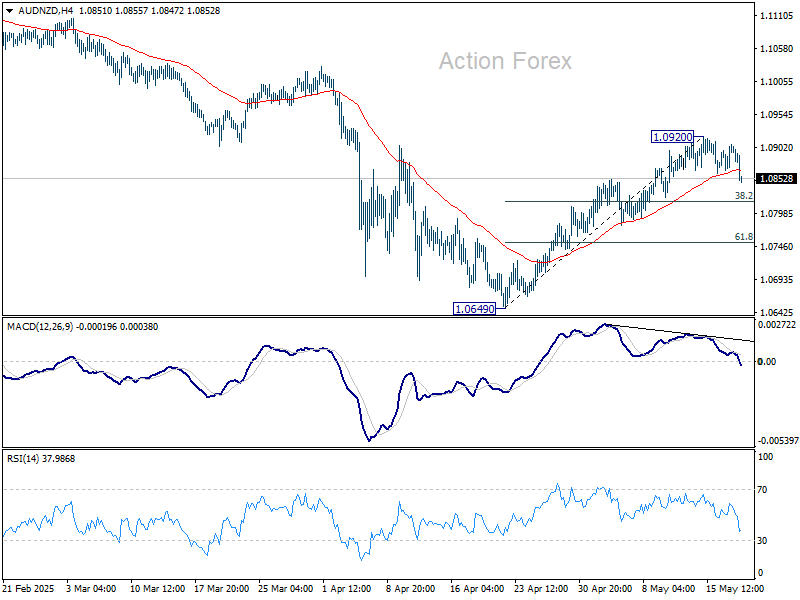
Technically, AUD/NZD's dip and break of 55 4H EMA today suggests that a short term top was formed at 1.0920, on bearish divergence condition in 4H MACD. Deeper retreat is now in favor to 38.2% retracement of 1.0649 to 1.0920 at 1.0816 to contain downside, at least on first attempt. However, firm break of 1.0816 will suggest near term reversal, and bring deeper fall to 61.8% retracement at 1.0753 instead.
In Asia, at the time of writing, Nikkei is up 0.25%. Hong Kong HSI is up 1.29%. China Shanghai SSE is up 0.38%. Singapore Strait Times is up 0.19%. Japan 10-year JGB yield is up 0.039 at 1.527. Overnight, DOW rose 0.32%. S&P 500 rose 0.09%. NASDAQ rose 0.02%. 10-year yield rose 0.034 to 4.475.
Looking ahead, Germany PPI is a focus in European session. Later in the day, attention will be on Canada CPI.
RBA cuts rates to 3.85%, lowers 2025 growth and inflation forecasts
RBA delivered a widely expected 25 bps rate cut, lowering the cash rate to 3.85%. In its statement, RBA said the risks to inflation had become "more balanced," with headline inflation now within the target range and upside pressures "appear to have diminished" amid deteriorating global economic conditions.
Still, the central bank remains cautious, citing significant uncertainty around both demand and supply dynamics, as well as the evolving impact of global trade tensions and geopolitical developments.
The Board acknowledged a "severe downside scenario" and emphasized that monetary policy is "well placed" to respond decisively if global shocks materially affect Australia's outlook. RBA flagged the unpredictability of global tariff policies and noted that households and businesses may hold back on spending amid heightened uncertainty. These concerns have contributed to a weaker outlook across growth, employment, and inflation.
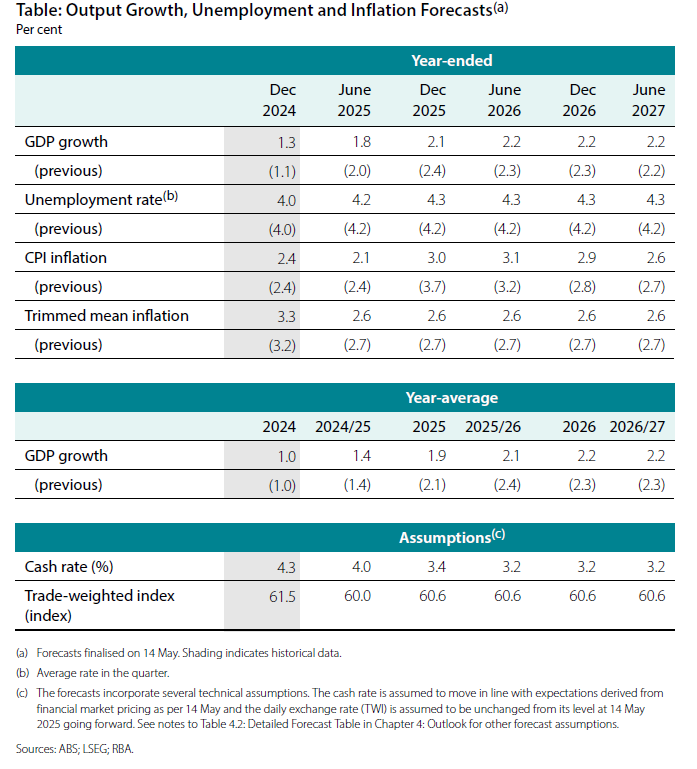
In its revised forecasts, RBA downgraded GDP growth for 2025 to 1.9% (from 2.1%) and for 2026 to 2.2% (from 2.3%). End-2025 headline CPI was revised down to 3.0% from 3.7%, with end-2026 projection lifted from 2.8% to 2.9%. Trimmed mean forecasts for the end-2025 and end 2026 were both cut slightly from 2.7% to 2.6%.
China cuts loan prime rates for first time in seven months
China’s central bank lowered its key lending benchmarks for the first time since October, delivering a long-anticipated move to support the economy.
PBoC lowered the one-year loan prime rate by 10 bps to 3.0%. The five-year LPR, a key reference for mortgages, was also trimmed by 10 bps to 3.5%.
The October 2025 easing was more aggressive at 25 basis points, but today’s cuts still mark a meaningful step in the ongoing monetary support cycle.
The move comes as part of a broader policy package unveiled by PBOC Governor Pan Gongsheng and top financial regulators ahead of high-level trade talks in Geneva that have since led to a temporary truce between China and the US on tariffs.
SNB’s Schlegel: Inflation outlook unclear, negative rates remain on the table
SNB Chair Martin Schlegel warned that the outlook for Swiss inflation remains highly uncertain and reiterated that the central bank could not rule out a return to negative interest rates.
Speaking at an event overnight, Schlegel said while such rates were an extraordinary measure, they had previously achieved their intended effect when used between 2014 and 2022.
“The uncertainty is currently enormous,” Schlegel said, citing volatility in both USD/CHF and EUR/CHF, adding that “investors are seeking a safe haven in stormy times,” which has put upward pressure on the Swiss franc.
Separately, Schlegel addressed concerns about global asset shifts, emphasizing that US treasuries remain foundational to global markets despite rising uncertainty. “There’s no current or foreseeable alternative to U.S. treasuries,” he said, citing their liquidity and dominance.
BoE’s Dhingra: Vote for bigger rate cut a signal of economic direction
BoE MPC member Swati Dhingra explained her decision to vote for a larger 50bps rate cut at the May 8 meeting as a deliberate signal about the UK's economic outlook.
Speaking in an FT interview, Dhingra said she wanted to send a "more categorical statement about where I think the economy is headed," noting that using such a larger move sparingly increases its impact on market expectations.
Her vote, along with Alan Taylor’s, diverged from the majority who supported a more measured 25bps cut.
AUD/USD Daily Report
Daily Pivots: (S1) 0.6415; (P) 0.6440; (R1) 0.6482; More...
AUD/USD dips mildly today but stays in range of 0.6356/6511. Intraday bias remains neutral and further rise is in favor. One the upside, break of 0.6511 will resume the rise from 0.5913 and target 61.8% retracement of 0.6941 to 0.5913 at 0.6548. However, firm break of 0.6356 will bring deeper pullback to 38.2% retracement of 0.5913 to 0.6511 at 0.6283 first.
In the bigger picture, as long as 55 W EMA (now at 0.6438) holds, down trend from 0.8006 (2021 high) should resume later to 61.8% projection of 0.8006 to 0.6169 from 0.6941 at 0.5806. However, sustained trading above 55 W EMA will argue that a medium term bottom was already formed, and set up further rebound to 0.6941 resistance instead.
RBA cuts rates to 3.85%, lowers 2025 growth and inflation forecasts
RBA delivered a widely expected 25 bps rate cut, lowering the cash rate to 3.85%. In its statement, RBA said the risks to inflation had become "more balanced," with headline inflation now within the target range and upside pressures "appear to have diminished" amid deteriorating global economic conditions.
Still, the central bank remains cautious, citing significant uncertainty around both demand and supply dynamics, as well as the evolving impact of global trade tensions and geopolitical developments.
The Board acknowledged a "severe downside scenario" and emphasized that monetary policy is "well placed" to respond decisively if global shocks materially affect Australia's outlook. RBA flagged the unpredictability of global tariff policies and noted that households and businesses may hold back on spending amid heightened uncertainty. These concerns have contributed to a weaker outlook across growth, employment, and inflation.
In its revised forecasts, RBA downgraded GDP growth for 2025 to 1.9% (from 2.1%) and for 2026 to 2.2% (from 2.3%). End-2025 headline CPI was revised down to 3.0% from 3.7%, with end-2026 projection lifted from 2.8% to 2.9%. Trimmed mean forecasts for the end-2025 and end 2026 were both cut slightly from 2.7% to 2.6%.
(RBA) Statement by the Reserve Bank Board: Monetary Policy Decisions
At its meeting today, the Board decided to lower the cash rate target by 25 basis points to 3.85 per cent.
Inflation continues to moderate.
Inflation has fallen substantially since the peak in 2022, as higher interest rates have been working to bring aggregate demand and supply closer towards balance. Data on inflation for the March quarter provided further evidence that inflation continues to ease. At 2.9 per cent, annual trimmed mean inflation was below 3 per cent for the first time since 2021 and headline inflation, at 2.4 per cent, remained within the target band of 2–3 per cent. Staff forecasts released today project that while headline inflation is likely to rise over the coming year to around the top of the band as temporary factors unwind, underlying inflation is now expected to be around the midpoint of the 2–3 per cent range throughout much of the forecast period.
The outlook remains uncertain.
Uncertainty in the world economy has increased over the past three months and volatility in financial markets rose sharply for a time. While recent announcements on tariffs have resulted in a rebound in financial market prices, there is still considerable uncertainty about the final scope of the tariffs and policy responses in other countries. Geopolitical uncertainties also remain pronounced. These developments are expected to have an adverse effect on global economic activity, particularly if households and firms delay expenditure pending greater clarity on the outlook. This has also contributed to a weaker outlook for growth, employment and inflation in Australia. That said, world trade policy is changing rapidly, thereby making the central forecasts subject to considerable uncertainty.
Setting aside overseas developments, private domestic demand appears to have been recovering, real household incomes have picked up and there has been an easing in some measures of financial stress. However, businesses in some sectors continue to report that weakness in demand makes it difficult to pass on cost increases to final prices.
At the same time, a range of indicators suggest that labour market conditions remain tight. Employment is continuing to grow, measures of labour underutilisation are at relatively low rates and business surveys and liaison suggest that availability of labour is still a constraint for a range of employers. Looking through quarterly volatility, wages growth has softened over the past year or so but productivity growth has not picked up and growth in unit labour costs remains high.
There are uncertainties about the outlook for domestic economic activity and inflation stemming from both domestic and international developments. While the central projection is for growth in household consumption to continue to increase as real incomes rise, recent data suggest that the pick-up will be a little slower than was expected three months ago. There is a risk that any pick-up in consumption is even slower than this, resulting in continued subdued growth in aggregate demand and a sharper deterioration in the labour market than currently expected. Alternatively, labour market outcomes may prove stronger than expected, given the signal from a range of leading indicators.
More broadly, there are uncertainties regarding the lags in the effect of monetary policy and how firms’ pricing decisions and wages will respond to the demand environment and weak productivity outcomes while conditions in the labour market remain tight.
Maintaining low and stable inflation is the priority.
The Board judged that the risks to inflation have become more balanced. Inflation is in the target band and upside risks appear to have diminished as international developments are expected to weigh on the economy. With inflation expected to remain around target, the Board therefore judged that an easing in monetary policy at this meeting was appropriate. The Board assesses that this move will make monetary policy somewhat less restrictive. It nevertheless remains cautious about the outlook, particularly given the heightened level of uncertainty about both aggregate demand and supply. The Board considered a severe downside scenario and noted that monetary policy is well placed to respond decisively to international developments if they were to have material implications for activity and inflation in Australia.
The Board will be attentive to the data and the evolving assessment of risks to guide its decisions. In doing so, it will pay close attention to developments in the global economy and financial markets, trends in domestic demand, and the outlook for inflation and the labour market. The Board is focused on its mandate to deliver price stability and full employment and will do what it considers necessary to achieve that outcome.
China cuts loan prime rates for first time in seven months
China’s central bank lowered its key lending benchmarks for the first time since October, delivering a long-anticipated move to support the economy.
PBoC lowered the one-year loan prime rate by 10 bps to 3.0%. The five-year LPR, a key reference for mortgages, was also trimmed by 10 bps to 3.5%.
The October 2025 easing was more aggressive at 25 basis points, but today’s cuts still mark a meaningful step in the ongoing monetary support cycle.
The move comes as part of a broader policy package unveiled by PBOC Governor Pan Gongsheng and top financial regulators ahead of high-level trade talks in Geneva that have since led to a temporary truce between China and the US on tariffs.
BoE’s Dhingra: Vote for bigger rate cut a signal of economic direction
BoE MPC member Swati Dhingra explained her decision to vote for a larger 50bps rate cut at the May 8 meeting as a deliberate signal about the UK's economic outlook.
Speaking in an FT interview, Dhingra said she wanted to send a "more categorical statement about where I think the economy is headed," noting that using such a larger move sparingly increases its impact on market expectations.
Her vote, along with Alan Taylor’s, diverged from the majority who supported a more measured 25bps cut.
SNB’s Schlegel: Inflation outlook unclear, negative rates remain on the table
SNB Chair Martin Schlegel warned that the outlook for Swiss inflation remains highly uncertain and reiterated that the central bank could not rule out a return to negative interest rates.
Speaking at an event overnight, Schlegel said while such rates were an extraordinary measure, they had previously achieved their intended effect when used between 2014 and 2022.
“The uncertainty is currently enormous,” Schlegel said, citing volatility in both USD/CHF and EUR/CHF, adding that “investors are seeking a safe haven in stormy times,” which has put upward pressure on the Swiss franc.
Separately, Schlegel addressed concerns about global asset shifts, emphasizing that US treasuries remain foundational to global markets despite rising uncertainty. “There’s no current or foreseeable alternative to U.S. treasuries,” he said, citing their liquidity and dominance.
GBP/USD Regains Traction — Is a Bullish Breakout on The Horizon?
Key Highlights
- GBP/USD started a decent increase from the 1.3250 zone.
- It cleared a key bearish trend line with resistance at 1.3340 on the 4-hour chart.
- EUR/USD started a recovery wave above the 1.1220 level.
- USD/JPY is showing a few bearish signs below 146.20.
GBP/USD Technical Analysis
The British Pound remained support near 1.3250 against the US Dollar. GBP/USD formed a base and started a fresh increase above 1.3300.
Looking at the 4-hour chart, the pair surpassed a key bearish trend line with resistance at 1.3340. There was a close above the 1.3320 level, the 100 simple moving average (red, 4-hour), and the 200 simple moving average (green, 4-hour).
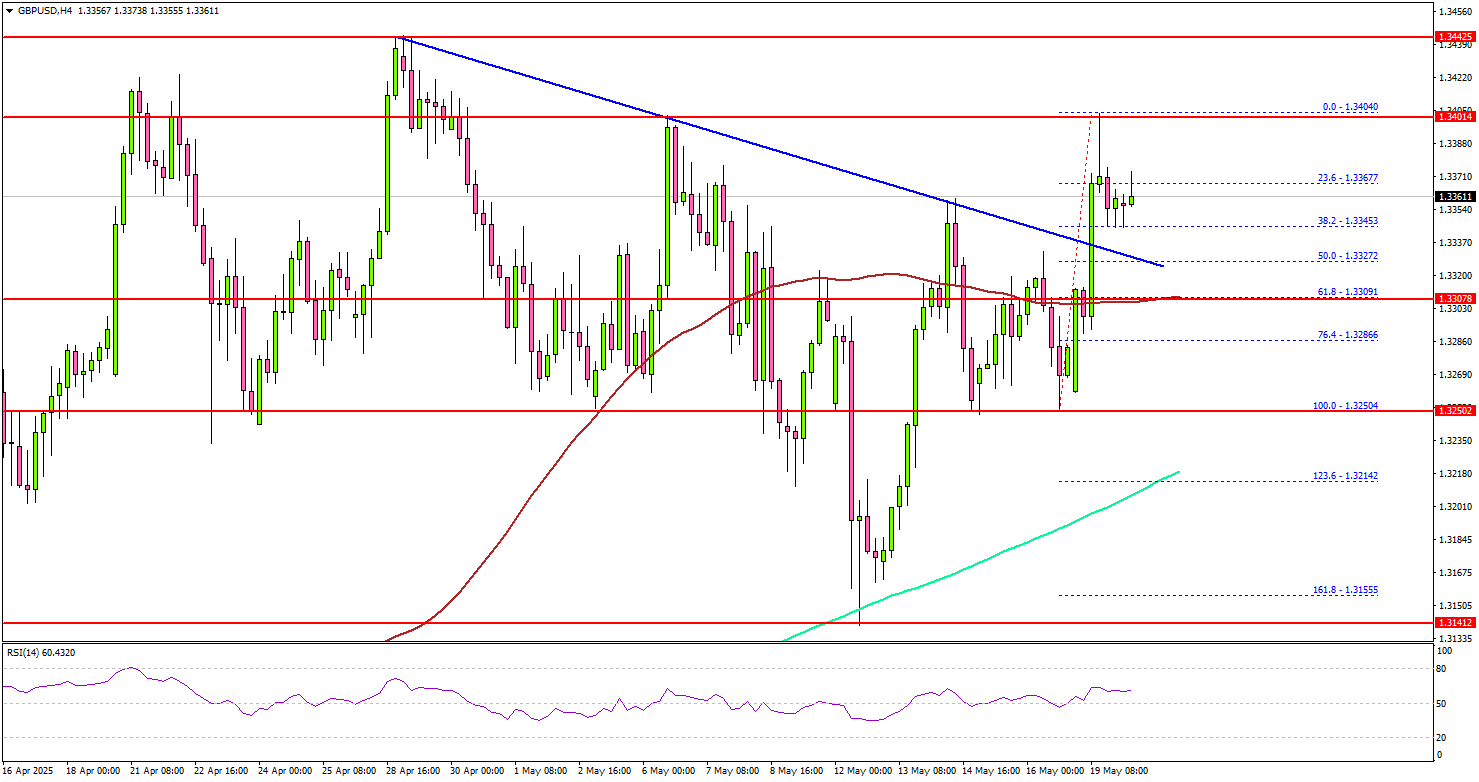
The pair even tested the 1.3400 zone. On the upside, the pair could face resistance near the 1.3400 level. The next key resistance sits near the 1.3420 level. The first major resistance sits at 1.3450.
A close above the 1.3450 level could set the pace for another increase. In the stated case, the pair could even clear the 1.3500 resistance. The next major stop for the bulls could be near the 1.3620 resistance.
On the downside, immediate support sits near the 1.3320 level. The next key support sits near 1.3300 and the 100 simple moving average (red, 4-hour). Any more losses could send the pair toward the 1.3250 pivot level in the near term. The mains support could be near 1.3200 and the 200 simple moving average (green, 4-hour).
Looking at EUR/USD, the pair managed to avoid more losses and started a recovery wave above the 1.1220 level.
Upcoming Economic Events:
- Fed's Bostic speech.
- Fed's Daly speech.
- Fed's Hammack speech.