
Sample Category Title
Markets Eye Trade Deals, DAX Breaches 24000
Asian Session Market Wrap
The MSCI Asia Pacific index rose by 0.4% after the S&P 500 nearly entered a bull market on Monday. Hong Kong stocks went up by 1.3%, with Contemporary Amperex Technology surging up to 18% on its first trading day.
Markets shrugged off a Moody’s downgrade with risk assets largely continuing their rally. There was some caution on show as safe havens like Gold did gain a bid yesterday.
Optimism from the US-China 90 day pause may be waning at the moment with market participants looking toward other trade deal announcements to boost sentiment.
Market participants are closely watching US trade talks with India and Japan after a recent tariff-lowering deal with China raised hopes.
India is working on a three-part trade deal with the US and aims to finalize an interim agreement before July, when Trump’s reciprocal tariffs are set to start, according to insiders. Meanwhile, Japan’s top trade negotiator, Ryosei Akazawa, is planning a third round of talks in the US as early as this week.
Japan’s finance minister is also arranging a meeting with US Treasury Secretary Scott Bessent this week to discuss issues like currency, which boosted the yen.
Additionally, Vietnam and the US began their second round of talks on a bilateral tariff agreement in Washington DC on Monday, with discussions continuing until Thursday.
Following on from yesterday's Chinese data, major Chinese banks cut deposit rates again, in the latest efforts to drive consumers to spend more amid a flagging economy. This was evident by the retail sales numbers yesterday.
Developments and announcements on these trade deals could help boost market sentiment and potentially stir another bullish rally in risk assets.
The European Open
Heading into the European open, S&P 500 futures dropped 0.2%, indicating a six-day advance may be poised to end. Contracts for Europe strengthened 0.5%
The pan-European STOXX 600 index rose 0.2%, reaching its highest level in seven weeks. The DAX index printed fresh all-time highs and peaked just above the 24000 handle but trades slightly down on the day.
Utility stocks went up by 1.1%, with Portugal's EDP Renovaveis gaining 3.5% after Deutsche Bank upgraded its rating from "hold" to "buy."
On the FX front, the US dollar stayed steady at 144.75/yen, after hitting 144.66 on Monday, its weakest level since May 8. The dollar index dropped 0.1%, following a 0.6% decline in the previous session.
The Australian dollar fell 0.5% to 0.6423, giving up part of Monday's 0.8% gain. This came after the Reserve Bank of Australia (RBA) lowered its main cash rate to 3.85%, a two-year low, due to a weaker global outlook and slowing inflation at home.
The British pound remained steady at 1.3353, while the euro stayed flat at 1.1249.
Currency Power Balance
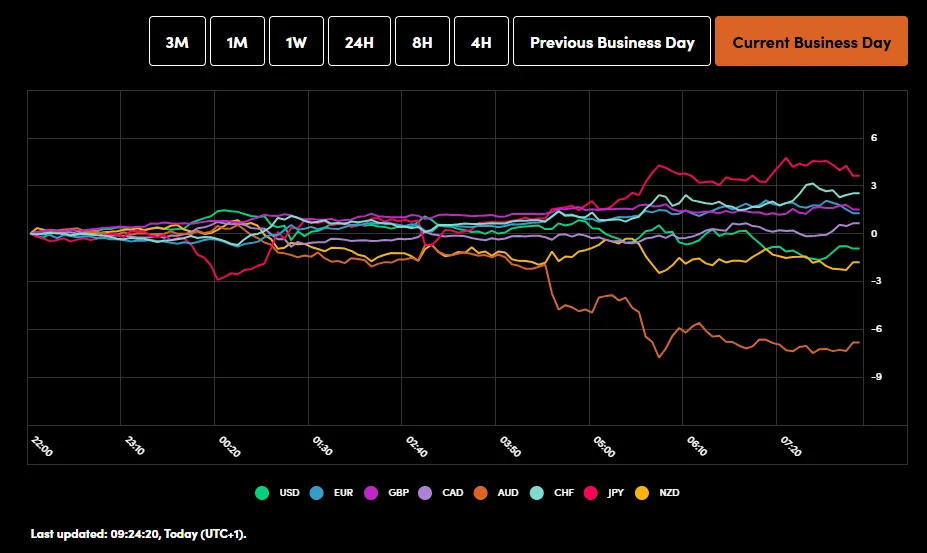
Source: OANDA Labs
Economic Data Releases
Looking at the economic calendar, it is a quiet one in Europe with a few ECB policymakers being the highlight. Later in the day we have Canadian CPI data and a few Federal Reserve policymakers which could stoke volatility as well.
For now, news and comments on potential trade deals as well as any new information on the Russia-Ukraine truce could have an impact on market moves.
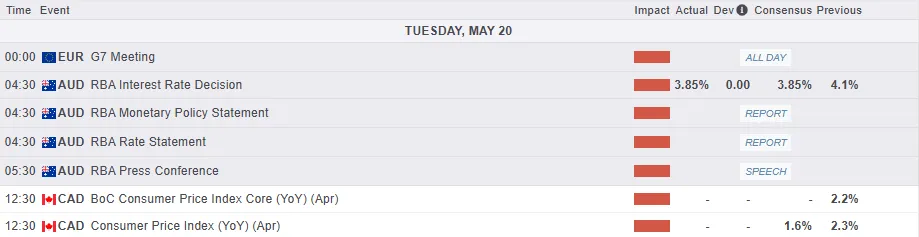
For all market-moving economic releases and events, see the MarketPulse Economic Calendar. (click to enlarge)
Chart of the day - DAX
From a technical standpoint, the DAX index has printed a fresh all-time high just above the 24000 handle.
In early European trade the index is trading slightly down on the day and this could be due to some caution and potential profit taking.
The daily candle did close above the 24000 handle and could help push the Index higher.
However, looking at recent price action and the last time the index printed a fresh all-time high we did see about three days of consolidation before the next push to the upside. Will history repeat itself?
The period-14 RSI remains in overbought territory with immediate support resting at 23750 before the 23471 handle comes back into focus.
A move beyond 24000 and i will be paying attention to whole numbers at 24250 and 24500 respectively.
DAX Index Daily Chart, May 20, 2025
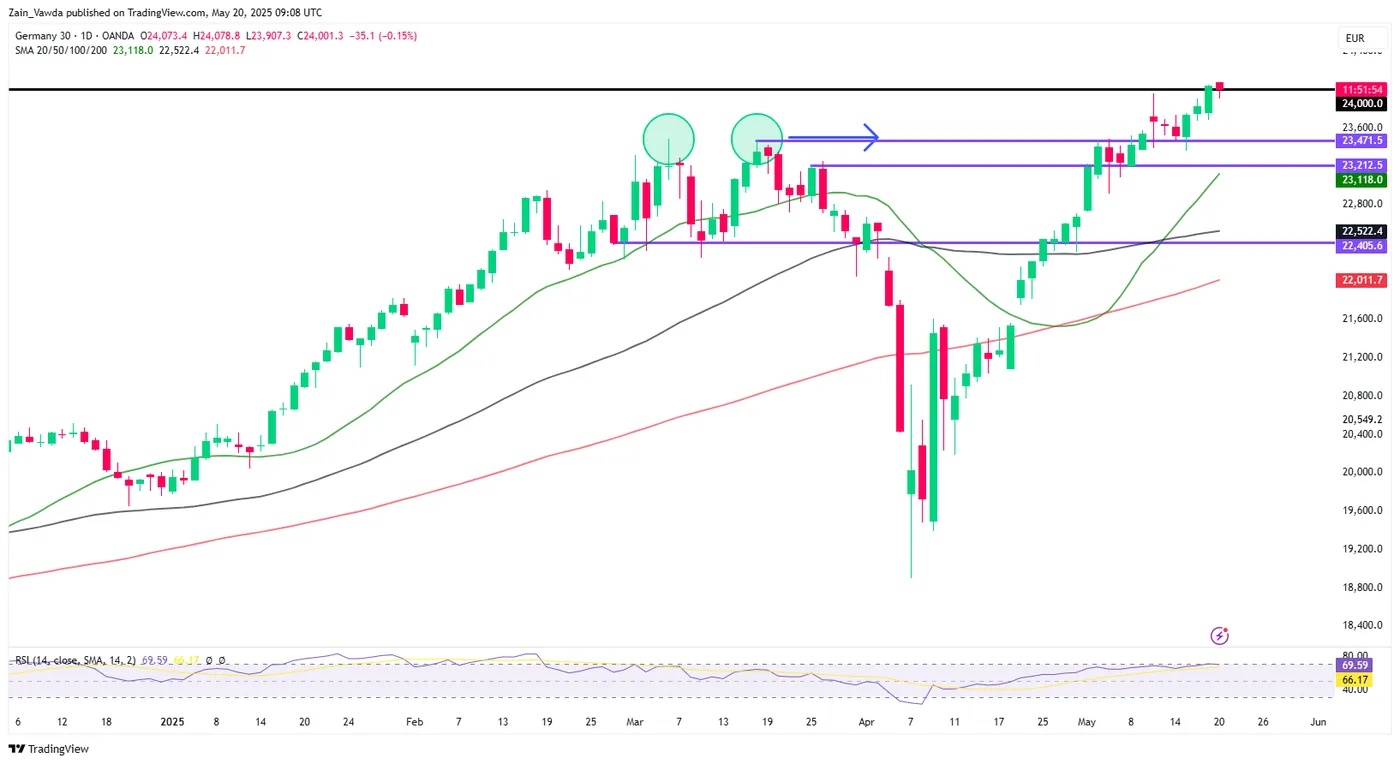
Source: TradingView.com (click to enlarge)
Euro Rises as US Dollar Comes Under Pressure Amid Budget Deficit Concerns
The EUR/USD pair climbed to 1.1243 on Tuesday, marking another attempt to break free from the narrow trading range it has occupied for over a week. This latest upward movement could prove more decisive than previous efforts.
Key drivers affecting EUR/USD
The US dollar came under sustained pressure in the previous session, driven by growing concerns over the widening US debt and budget deficit. These fears were exacerbated by a warning from Moody’s of a potential downgrade to the US credit rating.
Fiscal risks intensified following the House Budget Committee’s approval of President Donald Trump’s fiscal bill, which could add trillions of dollars to the deficit over the next decade. Despite criticism, the administration maintains that tax cuts will spur economic growth, boost revenues, and ultimately reduce the deficit.
Meanwhile, Raphael Bostic, President of the Federal Reserve Bank of Atlanta, reiterated expectations of a single rate cut this year, citing ongoing uncertainty arising from trade tariffs.
Today, market attention turns to the Eurozone’s preliminary consumer confidence index for May. No major US economic releases are scheduled.
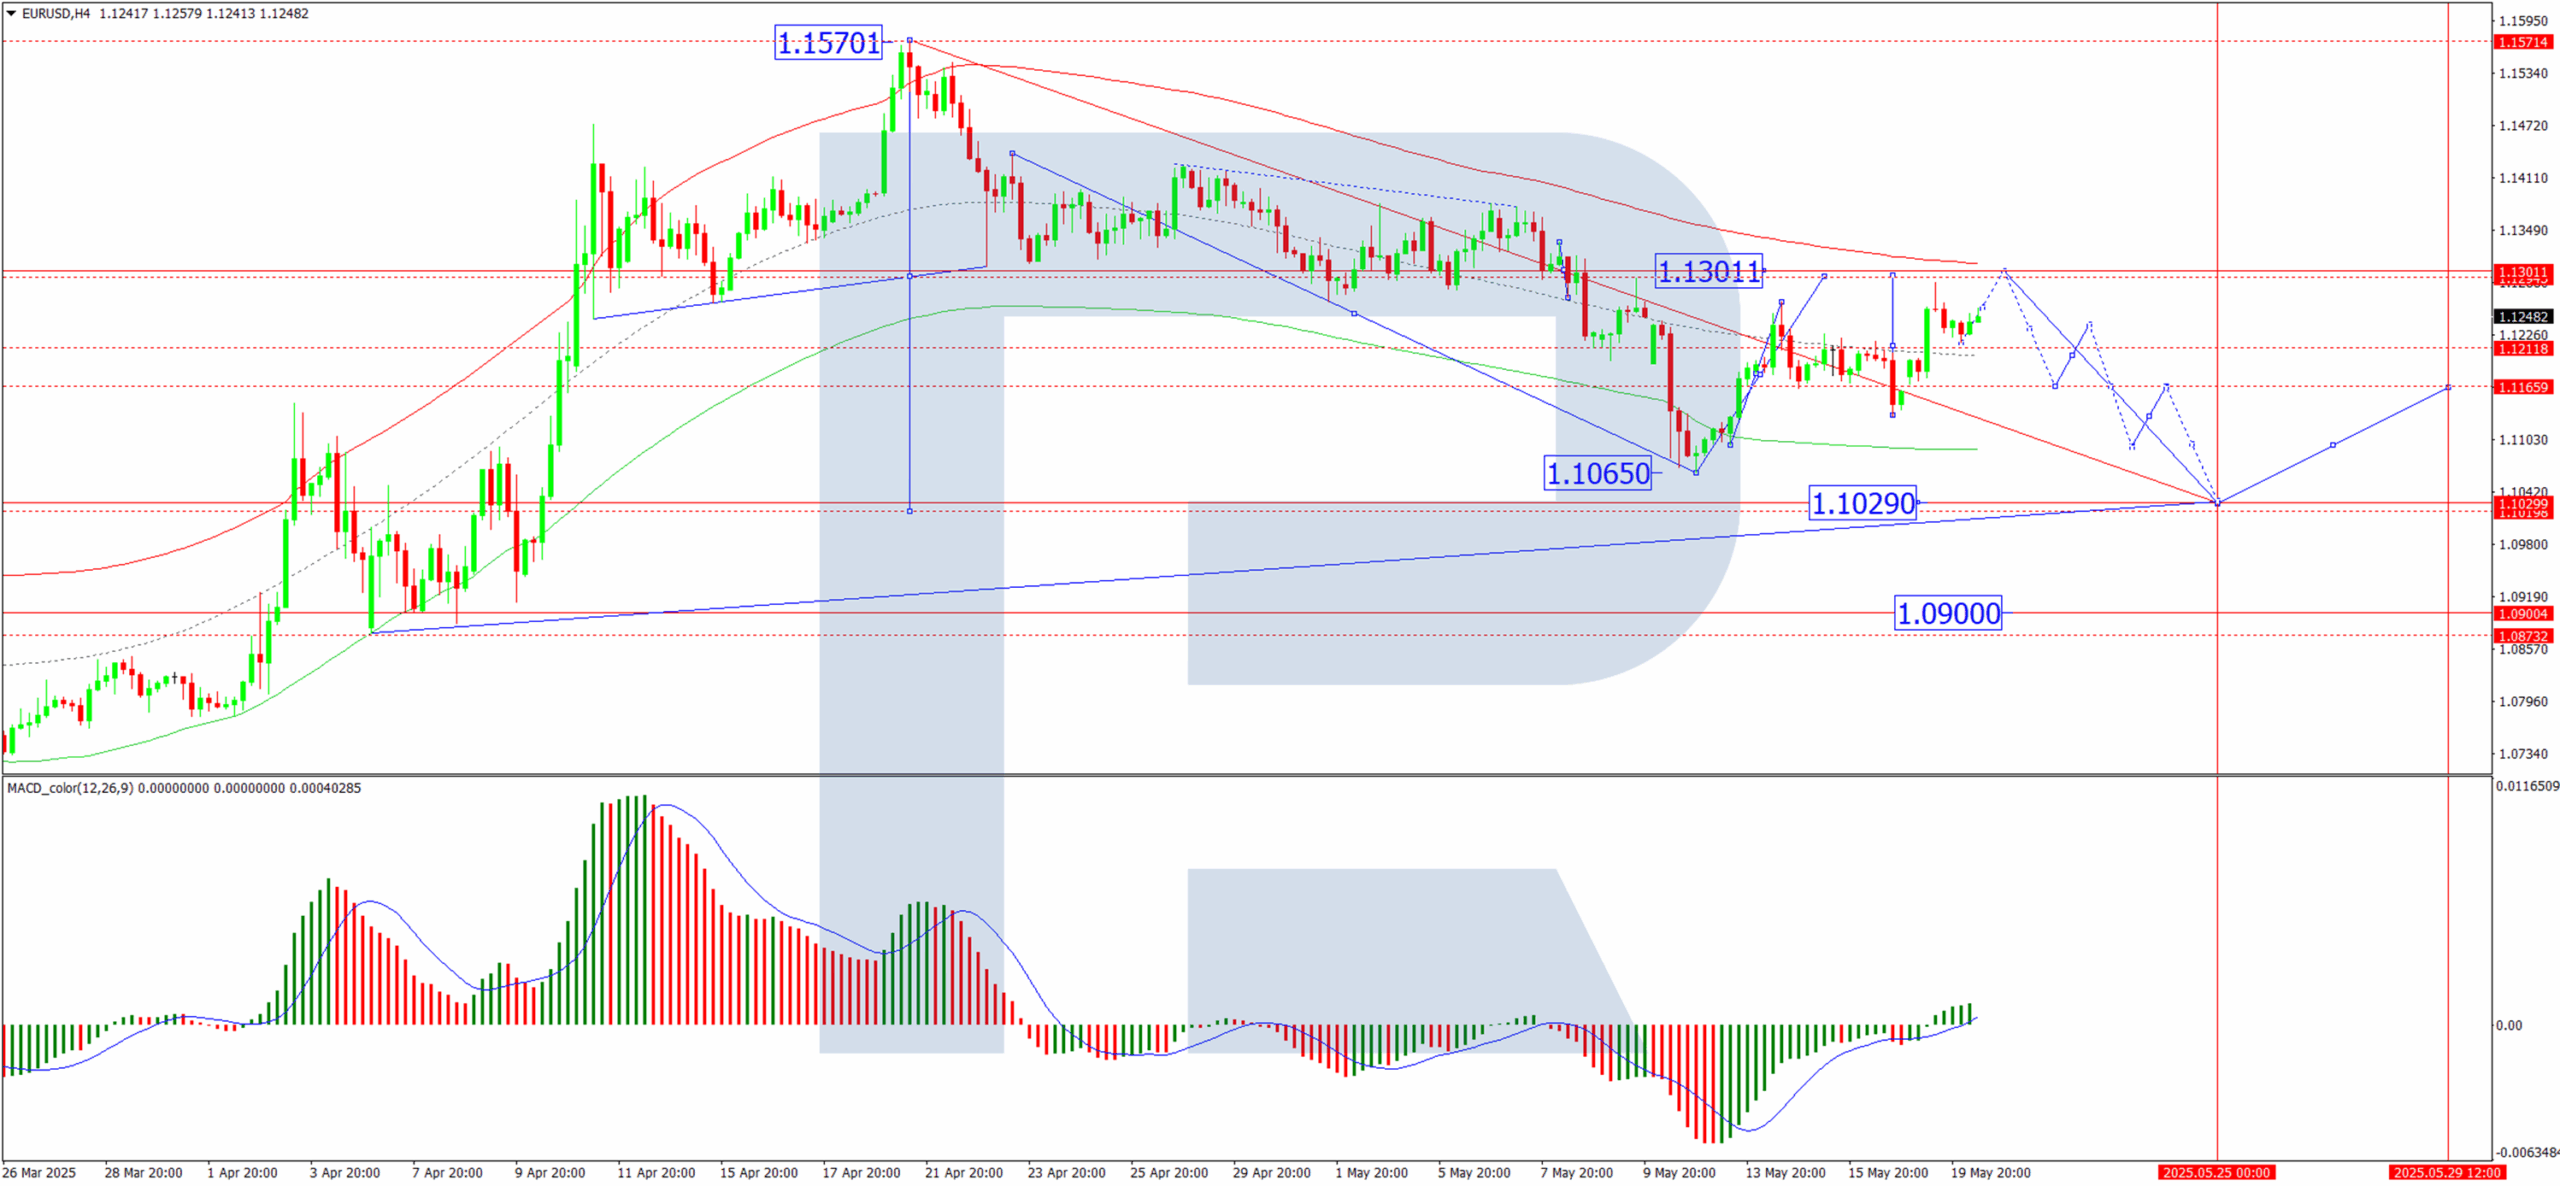
Technical analysis: EUR/USD
H4 Chart:
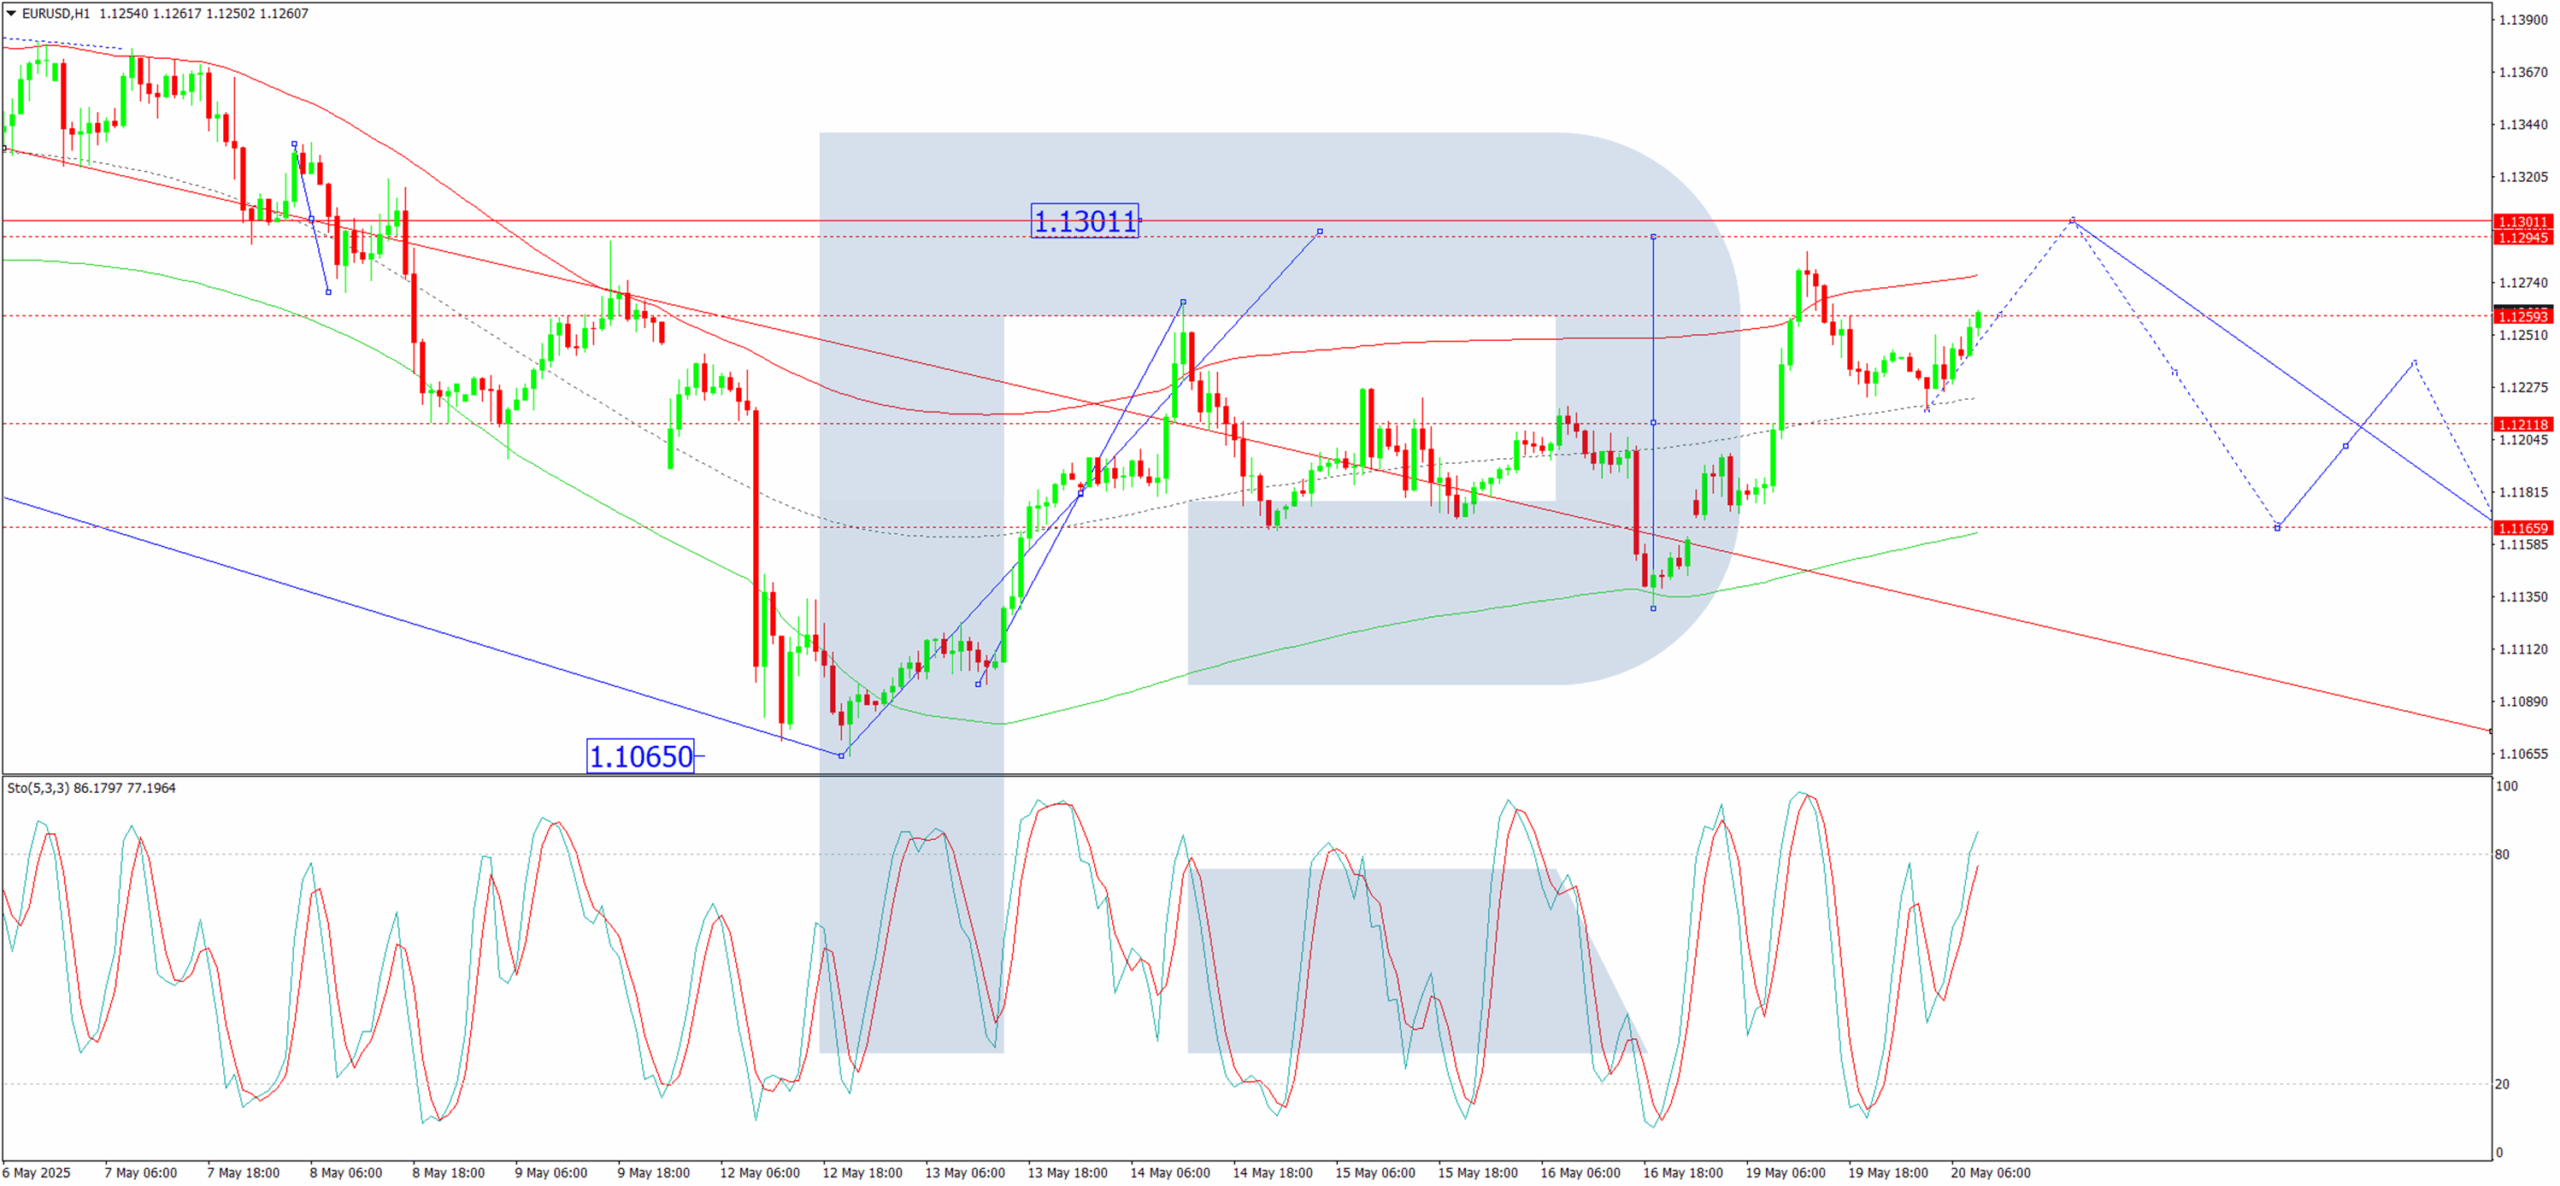
The EUR/USD pair continues to consolidate around 1.1212, with the potential for an upward move towards 1.1300 (testing from below). The current uptrend is a corrective phase following the most recent decline. Once this correction concludes, a new downward wave may emerge, targeting 1.1029 as the initial objective. This outlook is supported by the MACD indicator, with its signal line remaining above zero and trending upwards.
H1 Chart:
The pair is forming a fifth-wave structure within the correction towards 1.1300. Traders should monitor whether this level is reached today. A resumption of the downtrend may follow, with 1.1166 as the next key level. The Stochastic oscillator supports this scenario, with its signal line above 50 and ascending towards 80.
Conclusion
The EUR/USD pair’s latest rally reflects dollar weakness prompted by fiscal concerns, while technical indicators suggest a potential reversal once the current correction has played out. With no major US releases, traders will look to Eurozone sentiment for further direction.
BoE’s Pill: Quarterly rate cuts may be too rapid given increasing intrinsic inflation persistence
BoE Chief Economist Huw Pill explained his vote to keep the Bank Rate unchanged at the May MPC meeting as a "skip" rather than a pause in the broader easing cycle.
In speech today, Pill said that while disinflation remains on track, the pace of quarterly 25bps cuts since last summer may be " too rapid" given current inflation dynamics.
He expressed particular concern that structural changes in wage and price-setting behavior have heightened the "intrinsic persistence" of inflation in the UK.
As a result, Pill argued that a more cautious approach to monetary easing is warranted, reinforcing the need to slow the pace of rate reductions while continuing the broader policy normalization.
ECB’s Schnabel: Disinflation on track, steady hand needed amid new shocks
ECB Executive Board member Isabel Schnabel said the Eurozone’s disinflation process remains on track, but “new shocks” — particularly from trade tariffs — are presenting emerging risks.
While tariffs may dampen inflation in the short term, Schnabel warned they pose medium-term upside risks, warranting a “steady hand” in monetary policy.
She emphasized the importance of not overlooking "supply-side shocks" if they appear persistent, as doing so could risk "de-anchoring inflation expectations".
Schnabel also highlighted the Eurozone’s relative resilience following the tariff escalation on April 2, noting Euro’s appreciation and a shift in perception toward the region as a "safe haven." She characterized this as a “historical opportunity” to strengthen the international role of Euro.
RBA Cuts Rates. AUD Declines
Today, the Reserve Bank of Australia (RBA) decided to cut the interest rate from 4.10% to 3.85%, continuing its easing policy after a previous cut from 4.35% in February.
According to Reuters, the RBA today cited:
→ progress made in bringing inflation under control;
→ economic risks linked to the ongoing global trade war.
Although the RBA’s decision was widely expected, the Australian dollar weakened noticeably against other currencies — including the New Zealand dollar. The AUD/NZD rate fell to its lowest level in nearly two weeks.
Technical Analysis of the AUD/NZD Chart
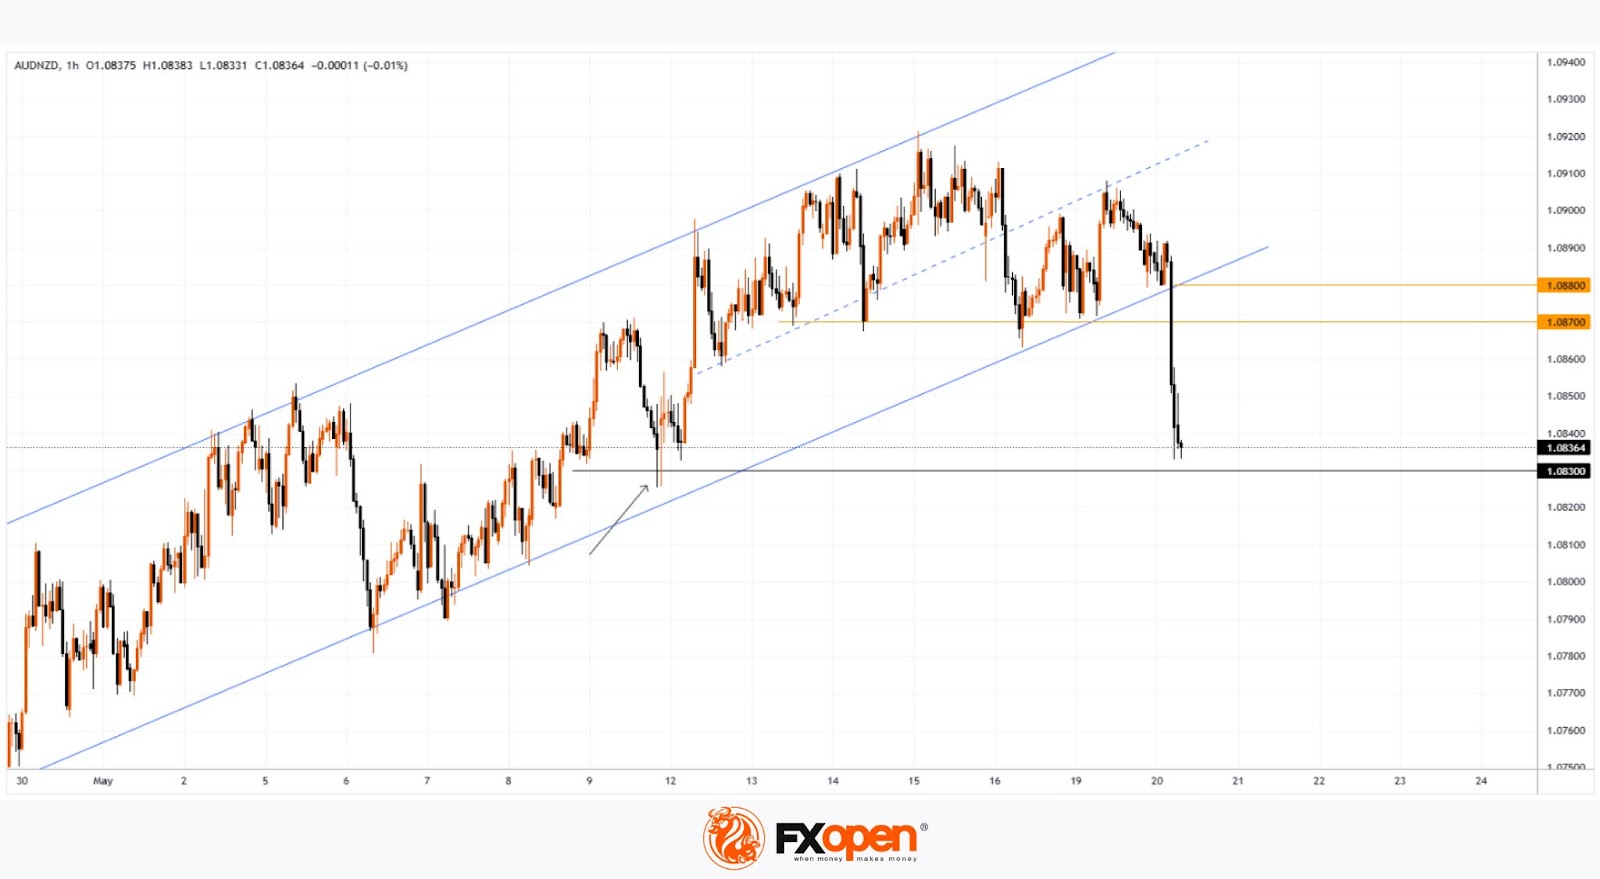
From a technical perspective, a bearish breakout occurred:
→ below the lower boundary of the upward trend channel that began in April;
→ and below the 1.087 level, which had served as support in mid-May.
It is possible that:
→ the decline may slow around the 1.083 support zone, where strong demand was evident in the long lower wicks of the 9 May candles (marked with an arrow);
→ the 1.0870–1.0880 area will act as resistance going forward, potentially leading to a retest of the bearish breakout zone on the AUD/NZD chart.
As the market continues to price in the RBA’s decision, attention will turn to the Reserve Bank of New Zealand meeting on 28 May, where a similar rate cut could be on the table.
Trade over 50 forex markets 24 hours a day with FXOpen. Take advantage of low commissions, deep liquidity, and spreads from 0.0 pips. Open your FXOpen account now or learn more about trading forex with FXOpen.
This article represents the opinion of the Companies operating under the FXOpen brand only. It is not to be construed as an offer, solicitation, or recommendation with respect to products and services provided by the Companies operating under the FXOpen brand, nor is it to be considered financial advice.
GBP/USD Exits Bearish Channel
- GBPUSD increases odds of bullish continuation.
- A break above 1.3440 could hand over control to the bulls.
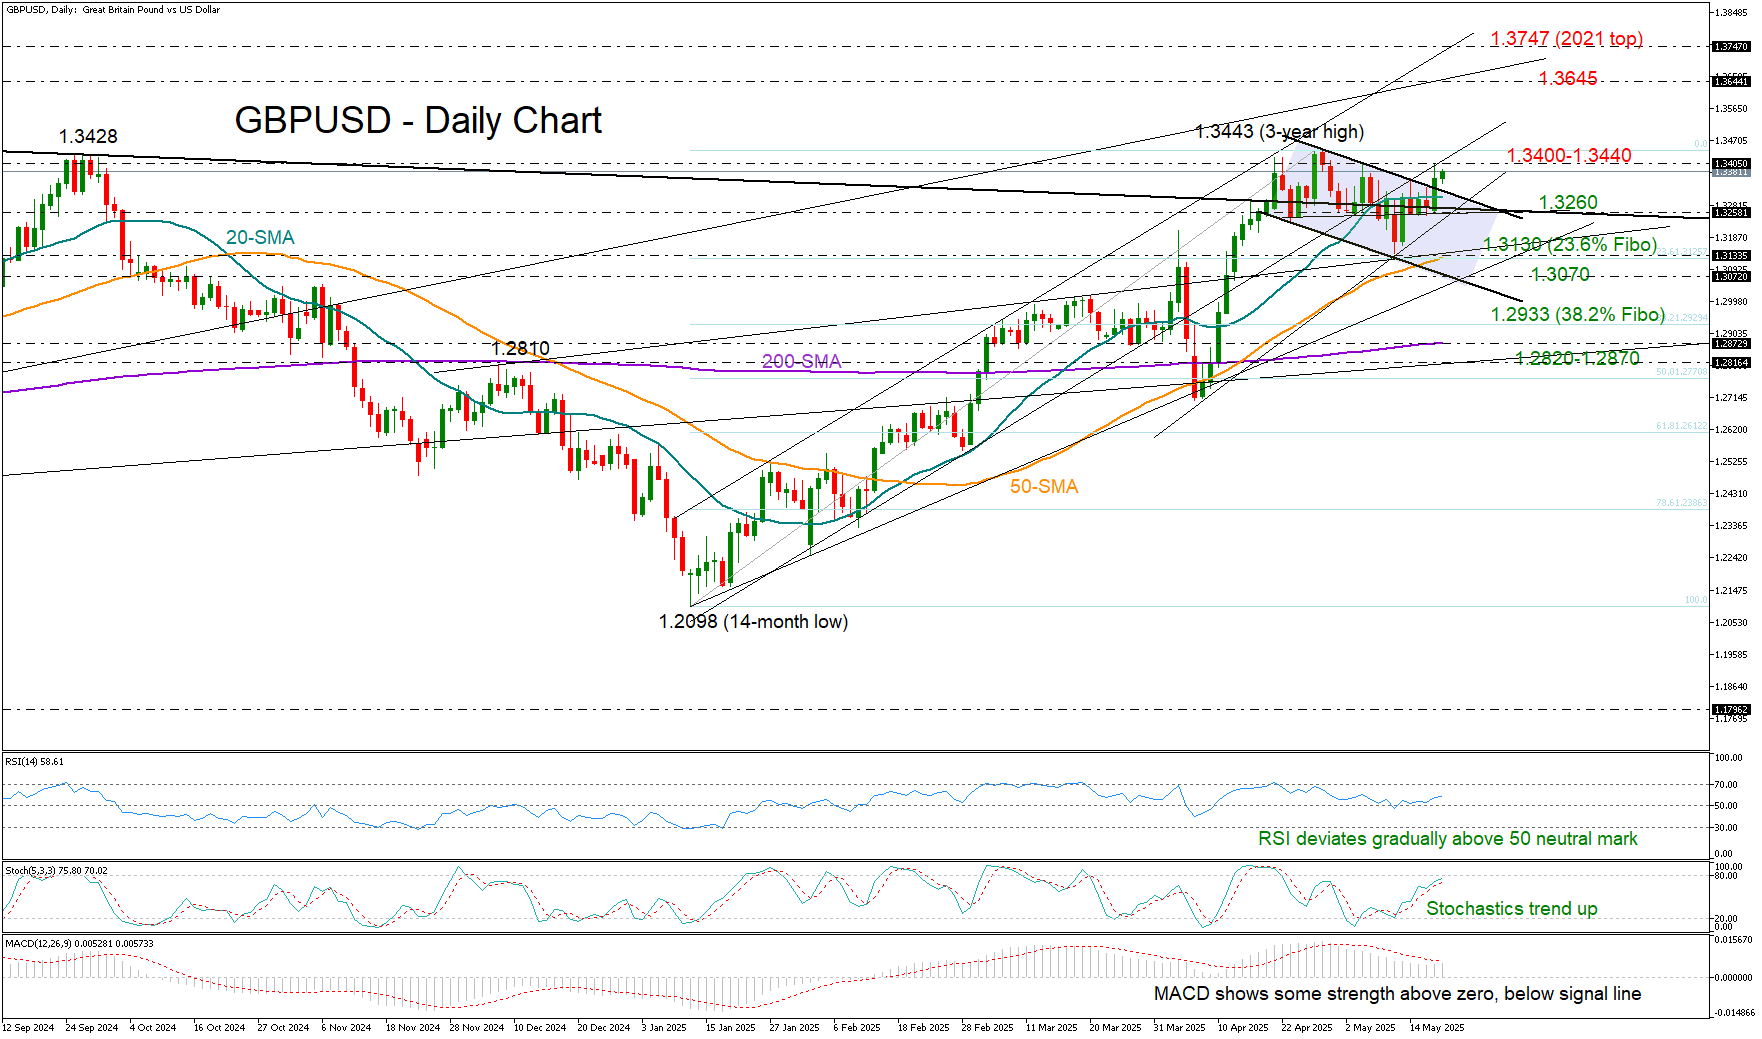
GBPUSD has broken above a bearish channel, as Moody’s credit downgrade of the US economy and improving EU-UK trade relations have brought bullish momentum into play.
A close above the 20-day simple moving average (SMA), along with a positive slope in the momentum indicators, continues to favor the bulls. However, the 1.3400–1.3440 resistance zone could still pose a challenge. A decisive break above this ceiling is likely needed to trigger a swift rally toward the 1.3645 resistance zone. Beyond that, the 1.3750 level - aligned with the 2021 high - may be the next obstacle before the 1.3830 barrier.
On the downside, the 1.3260 support base could keep bearish pressure in check. If that level fails, the price may drop toward the 50-day SMA, located near the 23.6% Fibonacci retracement of the 2025 uptrend at 1.3130, or potentially down to the lower boundary of the downward-sloping channel at 1.3070. A further decline could then target the 38.2% Fibonacci level at 1.2933 and the 200-day SMA at 1.2870.
In summary, GBPUSD is shaping a bullish path, with investors awaiting a confirmed break above the 1.3440 level to ramp up buying activity.
RBA’s ‘Confident’ 25bps Rate Cut – Job Done But Uncertainties High
RBA cuts cash rate by 25bps as expected, policy still restrictive. Inflation now comfortably in the 2–3% target range with balanced risks.
As we expected and the market was pricing, the RBA cut the cash rate target by 25bps at its May Monetary Policy Board meeting. This brings the cash rate target to 3.85%, which the media release described as “somewhat less restrictive”, but nonetheless still at least a bit restrictive. The commentary at the media conference also showed a more dovish tone than what we heard in February and even April.
In the post-meeting statement and media conference, the Governor and Board noted that “underlying inflation is now expected to be around the midpoint of the 2–3 per cent range throughout much of the forecast period”. Inflation has tracked downwards broadly as both we and the RBA expected since the previous cut in February. Although the Governor expressed caution about using such shorter-run measures, it is noteworthy that trimmed mean inflation was already running at an annual rate of 2½% (the midpoint of the target) over the most recent two quarters.
In its April post-meeting statement, the Board said that it “needs to be confident that this progress [in getting inflation down] will continue so that inflation returns to the midpoint of the target band on a sustainable basis”. The further progress on inflation since then, in line with expectations, has allowed the rhetoric to shift to highlighting that inflation is now on target, and the policy challenge is to keep it there in the face of considerable uncertainty. In the media conference, the Governor described the moves as encouraging.
Indeed, with inflation inside the target range, and at its midpoint on some metrics, it would have been hard to construct a case to hold the cash rate unchanged at a clearly restrictive level. The domestic inflation story was, on its own, enough to warrant this rate cut, a fact acknowledged by the Governor in the media conference. Also, in the media conference, the Governor noted in response to a question that the case to hold was discussed but quickly dismissed.
At the same time, the RBA has no need to rush or to accelerate the pace of easing. At the new level of 3.85%, it is not that far from most estimates of the ‘neutral’ level that neither weighs on nor stimulates the economy; the RBA does not seem to have revised its estimate of neutral since February, judging by the material in the Statement on Monetary Policy (SMP). And while it is possible that it will end up needing to provide support to the economy with expansionary policy, rather than simply being less restrictive, we are not there yet. In the media conference, Governor Bullock highlighted that the Board has scope to move a lot should that be necessary.
Offshore risks were key in the RBA’s change of view. The current “roller-coaster” trade war is seen as weighing on both global and domestic growth. That said, one of the key judgements in the RBA’s forecasts is that, like Westpac, it assesses that the Chinese authorities have a “high appetite” to achieve the 5% growth target for 2025, and thus that the Chinese economy will slow only modestly. (The RBA’s forecast is just shy of the target at 4.8%.)
It is also noteworthy that the RBA now regards recent trade developments as disinflationary for Australia (as do we). Back in April, the Board said that “Inflation… could move in either direction” because of the trade war. The possibility of higher inflation is now said to arise only if the trade dispute induces significant supply-chain disruption – an outcome that looks less likely now following the recent US–China interim deal.
In the end, the inflation forecasts were only scaled back slightly, with the trimmed mean outlook shifting from flat at 2.7% to flat at 2.6% for the entire forecast period. The Board now describes this as underlying inflation returning to and remaining sustainably around the midpoint of the 2–3% target rate.
One area that the RBA had previously pointed to as a reason for not being confident that inflation can be sustained at current levels is the tightness of the labour market. While it still highlighted indicators that suggested remaining tightness, the forecasts for unemployment have been lifted slightly, while those for employment and wages growth have been reduced slightly.
Documents released under Freedom of Information show that, as at March this year, the RBA’s models were implying that the NAIRU was 4.69%, only marginally down from the 4.75% estimate these models produced at the time of the February 2025 SMP. This is noticeably above the average estimate of the market economists that the
RBA itself polls, and slightly above the maximum estimate reported in its survey. The May SMP noted that its assessment of the location of full employment was unchanged, but both there and in the media conference, it was acknowledged that they could be overestimating the NAIRU and underestimating full employment. This contributed to some downward judgement in their inflation and wages growth forecasts.
While the staff are clearly grappling with the possibility they have been underestimating full employment, much of the analysis released in March centred on a ‘straw-man’ alternative hypothesis of a 4% NAIRU. Yet a NAIRU of 4¼% (in line with average estimate of market economists) would be enough to overturn the RBA’s concerns that the labour market is still too tight. Of course, the Governor would counter that they look at a broader range of metrics than just the unemployment rate relative to NAIRU estimates when assessing where the labour market is relative to full employment. In the end, though, their inflation models require a NAIRU estimate, so their inflation outlook hinges on the realism of those estimates.
The refreshed forecasts also significantly downgraded the RBA’s view on consumption. As we had previously highlighted, the RBA was well out of consensus in its bullish 2.6% forecast for growth in household consumption as at February. This was reduced to 1.9% in the current forecasts, though part of this is the near-term effect of Cyclone Alfred and there is some payback on the downgrade later on. In the media conference, Governor Bullock acknowledged that consumption growth had picked up more slowly than expected and that households were “being a little bit cautious” – a signal that has been evident for some time in Westpac’s Card Tracker and the Westpac–DataX Consumer Panel.
This month also marked the beginning of the RBA’s new system for implementing monetary policy. The media release accordingly no longer included an announcement of the exchange settlement funds rate, the rate that the RBA pays banks and others on deposits with the RBA.
Overall, this is a much less hawkish set of communication than February, or even April, and recalibrates the RBA away from its outlier view on the tightness of the domestic economy. We see no reason to adjust our view that the cash rate will be cut twice more this year (in August and November), taking it to 3.35% by year-end. This is contingent on underlying inflation trends remaining steady and no further downside shocks from abroad. As highlighted in the SMP scenario and in the Governor’s media conference, the Board has scope to cut further to support the economy should that become necessary.
Gold (XAU/USD) Forecast: Stagflation Risk May Reignite Bulls
Gold (XAU/USD) has staged an impressive positive performance of 19% in the first quarter of 2025, which even outperformed other cross asset classes, such as the US S&P 500 (-4.6%), US Dollar Index (-4%), and Bitcoin/USD (-11.7%) over the same period.
- Gold (XAU/USD) rose 19% in Q1 2025, outperforming major asset classes like the S&P 500, US Dollar Index, and Bitcoin.
- After hitting an all-time high of US$3,500 on 22 April, Gold corrected 10% to US$3,120 by 15 May, driven by a stronger US dollar and improved risk sentiment.
- Weak US consumer sentiment and rising inflation expectations suggest a lingering stagflation threat, supporting potential demand for Gold as a hedge.
- The 10% decline found support at the 50-day moving average, with bullish elements emerging, including a higher low and RSI stabilization.
- A break above US$3,305 could trigger a bullish reversal toward US$3,435–US$3,500, while a drop below US$3,056 may expose deeper support levels near US$2,833.
The yellow metal extended its bullish impulsive up move sequence in April to record a monthly gain of 5.3% and hit a fresh all-time intraday high of US$3,500 on 22 April 2025.
Thereafter, Gold (XAU/USD) staged a 10% corrective decline to print an intraday low of US$3,120 on 15 May 2025, within its ongoing major uptrend phase. This was triggered by a revival of the US dollar and risk-on sentiment due to optimism arising from the de-escalation of US-China trade tensions.
Interestingly, there are several factors at play now that suggest Gold (XAU/USD)’s recent three weeks of corrective decline have hit an inflection zone to kickstart a potential medium-term bullish reversal process.
Stagflation risk is still lingering around
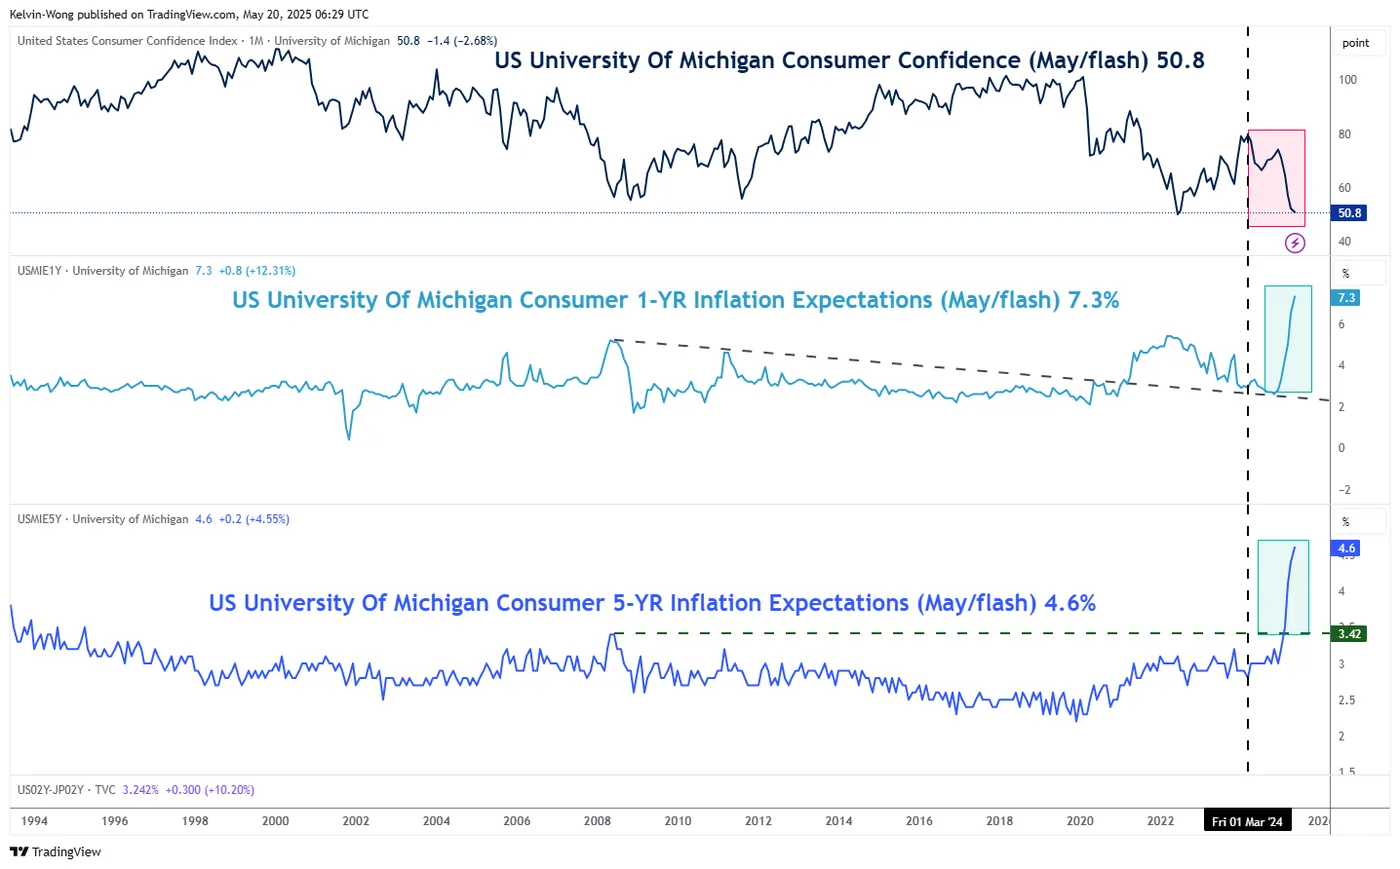
Fig 1: University of Michigan Consumer Sentiment & Inflation Expectations as of May 2025 (Source: TradingView)
Consumer sentiment survey results are considered leading “soft” economic data, which may translate into similar outcomes for “hard” data such as retail sales in the coming months.
Given that retail sales in the US play a pivotal role in shaping the trend of services activities, which contribute close to three-quarters of US economic growth, such “soft” data on consumer sentiment is likely to be scrutinized by market participants, in turn, triggering a feedback loop back into the financial markets.
Despite the recent conclusion of the 90-day pause on reduced tariff rates between the US and China that was agreed on 11 May, the latest preliminary University of Michigan Consumer Sentiment survey results for May, conducted between 22 April to 13 May dropped sharply to 50.8 down from 52.2 in April and well below market expectations of 53.4. This marks the fifth consecutive monthly decline, the lowest reading since June 2022, and the second lowest on record (see Fig 1).
In addition, the subcomponents of the University of Michigan survey also cover inflationary expectations (future inflationary trends in the US). The one-year head inflation expectations in the US accelerated for the sixth consecutive month to 7.3% in May 2025, reaching a new high since November 1981.
Meanwhile, the five-year inflation expectations quickened for the fifth month to 4.6% in May, its steepest reading since March 1991.
Overall, these observations point to a persistent risk of stagflation in the US, which could drive increased hedging demand for Gold (XAU/USD).
Let’s review Gold (XAU/USD) to decipher its medium-term directional bias from a technical analysis perspective.
Technical chart of Gold -10% corrective decline managed to stall at the 50-day MA
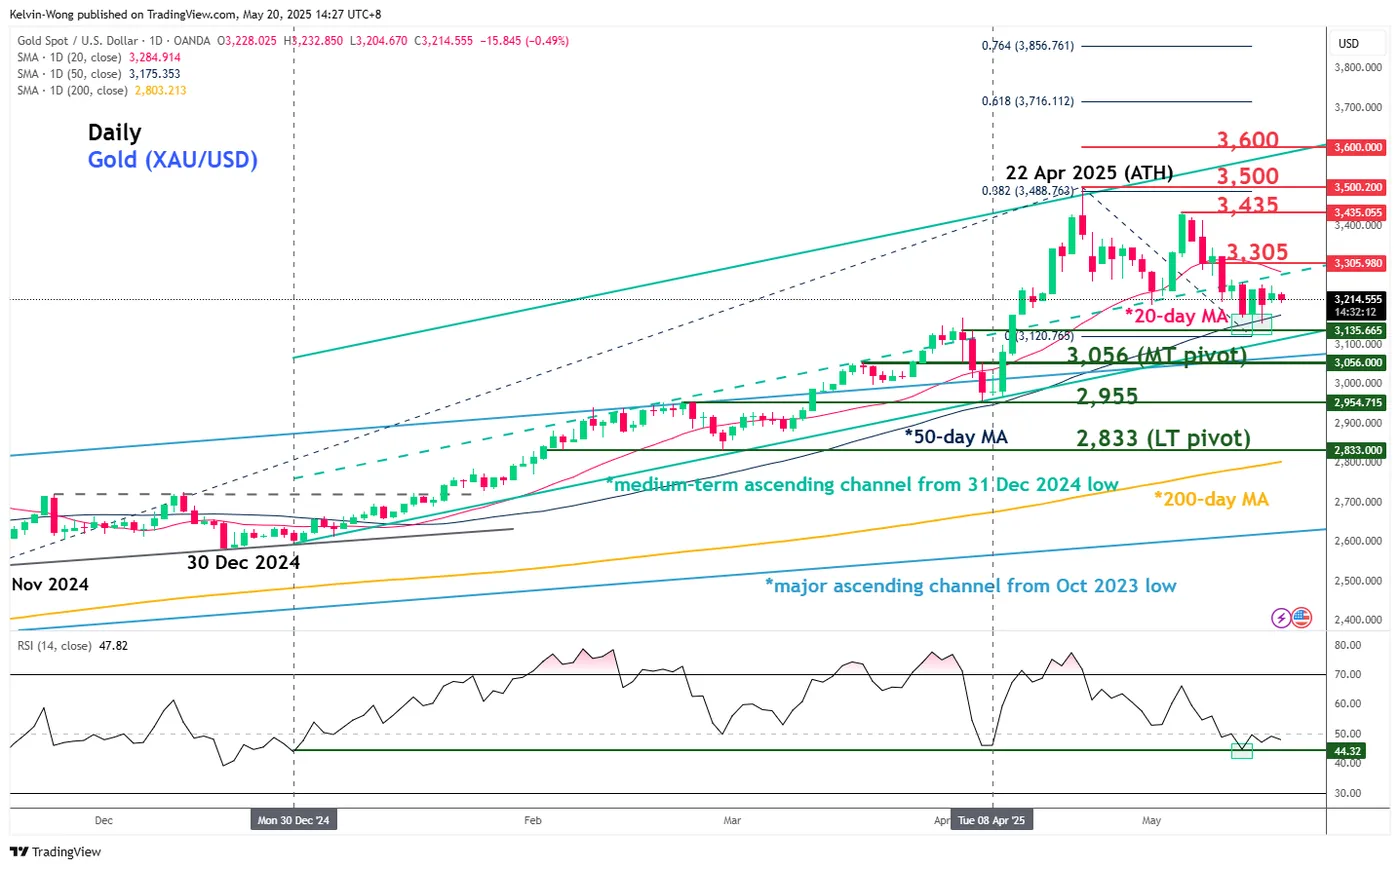
Fig 2: Gold (XAU/USD) medium-term & major trends as of 20 May 2025 (Source: TradingView)
Interestingly, in the past week, several technical conditions have emerged to suggest that the bearish momentum of the 10% corrective decline from 22 April to 15 May has eased, where the next price movement of Gold (XAU/USD) may stage a bullish reversal.
Firstly, the corrective decline has managed to stall right at the rising 50-day moving average, acting as an intermediate support at around US$3,130 on 15 May, thereafter price actions staged a rebound of 3.8% before a retest on the 50-day moving average on Friday, 16 May, and formed a “higher low”.
Secondly, the daily RSI momentum indicator has managed to find “support” at the 44 level on 14 May, where two prior similar observations occurred previously on 30 December 2024, and 8 April 2025 led to significant bullish reversal in the price actions of Gold (XAU/USD) (see Fig 2).
Watch the US$3,056 key medium-term pivotal support, and a clearance above US$3,305 (also the 20-day moving average) increases the impetus of a potential bullish reversal to see the next medium-term resistances coming in at US$3,435 and US$3,500 in the first step.
However, failure to hold at US$3,056 invalidates the bullish reversal scenario for an extension of the corrective decline sequence to expose the next medium-term support at US$2,955, and a break below it may see a further drop towards the US$2,833 long-term pivotal support area (also the key 200-day moving average).
RBA’s Bullock: Debated 25 vs 50bps cut debated; trade risks tilt toward disinflation
Following RBA’s decision to cut the cash rate by 25bps to 3.85%, Governor Michele Bullock revealed in the post-meeting press conference that the Board briefly considered holding rates but quickly moved to debate between 25 and 50 basis point reductions.
Ultimately, the more measured 25bps cut was preferred, given that inflation is within target and unemployment remains resilient. Bullock emphasized that while easing was justified, "it doesn't rule out that we might need to take action in the future."
Bullock also noted that the Board views recent global trade developments as broadly "disinflationary" for Australia. However, she cautioned that risks remain tilted both ways.
"There is a risk to inflation on the upside, trade policies could lead to supply chain issues, which could raise prices for some imports, much as we saw during the pandemic," she emphasized.
Both Bonds and Stocks Fully Erased Intraday Losses But Dollar Did Not
Markets
The 30-yr bond yield at some point yesterday surged more than 13 bps, including last Friday’s late-session move, to 5.03%. Trump’s Big Beautiful but costly Bill getting shaped in the House only proved Moody’s point for its AAA-rating downgrade and added fuel to the fire. But the Treasury sell-off lured dip buyers into the arena and by the end of yesterday’s trading day we saw a full recovery of all losses – to the exact basis point. The symbolical 5% resistance area lives to fight another day but it’s clear fiscal sustainability as a market theme is again front-and-center. It’s another argument next to the developing trade story for the Fed not to rush into cuts. Both Bostic (Atlanta) and Williams (NY) yesterday stressed it could take well into or even after the summer before things have cleared up somewhat to allow for informed, data-based decisions. As US bonds found some footing, so did UK gilts. The UK is trapped in a similar tricky budget situation and yields, particularly long-term ones, shot up to 10 bps higher as well before paring gains to just 2.5 bps tops (30-yr). German yields followed the US intraday pattern, outperforming them along the way. Net daily changes eventually varied between flat (30-yr) and -1.2 bps (2-yr). The dust quickly settled on equity markets too. Wall Street gapped lower but recovered throughout the session. Both bonds and stocks fully erased their intraday losses but the dollar did not. EUR/USD rose to a 1.1288 high and closed at 1.124 compared to 1.116 at the open. The trade-weighted DXY came close to the 100 barrier. USD/JPY returned sub 145 with JPY extending gains this morning after Japan’s finance minister Kato is arranging a meeting with USTS Bessent to discuss FX. Japanese yields trade sharply higher. A poor 20-year Japanese bond sale this morning flings long-term rates up in the sky and ups the ante for next week’s 40-yr auction. The 30-year yield adds more than 13 (!) bps and smashes through the 3% to 3.11%. Since Japan began issuing 30-year bonds in 1999 yields have only been higher in 2000. The 3.13% hit back then is about to get tested. At the heart lie … fiscal risks. The topic will continue to draw attention all week as Trump’s bill gets discussed in the House and given the relatively light eco calendar, with the exception of Thursday’s PMIs. That should offer downside to US/core bond yields. In terms of market momentum, we could see some hesitation or consolidation after a recent push towards the levels seen in the aftermath of Liberation Day. EUR/USD remains trapped in a sideways trading range where 1.14 serves as an intermediate resistance area. Sterling hovers north of EUR/GBP 0.84. Yesterday’s announcement of a broad-ranging post-Brexit deal where defense lies at the center had limited impact. The UK releases CPI numbers tomorrow.
News & Views
The Reserve Bank of Australia (RBA) this morning cut its policy rate by 25 bps to 3.85%. The RBA said demand and supply are closer towards balance. Inflation continues to ease. Trimmed mean Q1 annual inflation (2.9%) for the first time since 2021 returned below 3.0% and headline inflation (2.4%) remained within the 2-3% target band. New forecasts indicated that headline inflation might drift back higher due to temporary factors, but underlying inflation would to stay around the mid-point of the 2-3% target. (International) uncertainty remains high and might have adverse effects on the economy. Even so, the RBA assess that domestic demand appears to have been recovering, that real household incomes have picked up and that the labour market remains relatively tight. Still businesses continue to report weakness in demand. The RBA expects GDP growth to pick up, but at a more gradual pace than initially expected (2025 2.1%; 2026 2.2%). The outlook for inflation also has been revised a little lower (trimmed mean EoY 2025 and 2026 2.6% from 2.7%). Markets expected a more hawkish assessment. The 3-y bond yield dropped 10 bps to 3.53%. Money markets see two more cuts this year with the next 25 bps step fully discounted for August. The Aussie dollar eases marginally (0.644), holding within the recent narrow range (0.6315/0.6515).
The head of the Swiss National Bank (SNB), Martin Schlegel, in a speech said that inflation in the country can turn negative in certain months this year. Y/Y inflation in the country printed at 0.0% in April. The SNB head pointed to a negative contribution from external factors. With giving guidance on next month’s policy meeting, Schlegel indicated that the interest rate is very important for the exchange rate. In this respect, the SNB according to Schlegel, is prepared to bring the interest rate into negative territory if required. Interest rates remain the main policy tool of the SNB, but FX interventions might also be put in place. Markets expected SNB to cut the policy rate from 0.25% to 0.0% in June. EUR/CHF, after a CHF rally early April, recently held a tight range between 0.93 and 0.945.