Sample Category Title
PBoC, RBA Cut Rates
The People’s Bank of China (PBoC) and the Reserve Bank of Australia (RBA) lowered their interest rates today, hoping to tame and counter the negative impact of the global trade war on their economies and job markets. The moves were expected and received mixed reactions across stock markets.
The CSI 300 index is up by 0.62% at the time of writing, while the Hang Seng has jumped around 1.30%, boosted by CATL’s IPO, which went according to plan and led to a 14% surge in its Hong Kong debut. Meanwhile, the ASX is giving back earlier gains as trade headlines are turning sour. Remember, the US—unhappy with the pace of negotiations—announced last week that it would impose unilateral tariffs on trade partners before the end of the 90-day pause period. Trump insists that Apple manufacture its phones in the US and now wants the company to abandon its AI partnership with Alibaba for devices sold in China. This is another blow to Apple’s Chinese business. AI-powered systems could have helped reverse Apple’s falling market share in the country, and partnering with a local player made strategic sense given the severe restrictions on accessing data in China. Alas, it may no longer be possible. Apple, which pledged to invest up to $500 billion in the US, could now be pressured to spend that money on manufacturing infrastructure instead of innovation and R&D...
Meanwhile in China—despite the demographic and housing crises—technological advancements continue to challenge Western peers. Companies like Alibaba and Baidu are developing AI models; Huawei and SMIC are producing chips; and BYD, Xpeng, and Xiaomi are challenging Tesla globally by building powerful but more affordable EVs. Xiaomi announced that its new model, competing directly with Tesla’s Model Y, will launch this Thursday in China. Its share price is up 4% today and approaching all-time highs.
In summary: sentiment in Chinese tech is improving. Lower interest rates and ample fiscal support should help bolster this momentum. Investor appetite for US Big Tech remains strong, but current valuations could prove excessive if Trump’s trade war backfires—forcing companies to waste resources reorganizing supply chains or fight costly regulatory battles (I am thinking of a possible EU retaliation). These risks are not insignificant and could be avoided.
A Brexit breakthrough
Good news came from Europe, as the EU and the UK sealed their most comprehensive deal since Brexit and pledged ‘to discuss British access’ to Europe’s €150 billion defense fund. The Stoxx Europe Aerospace & Defence ETF soared 2% to a fresh high, while the Stoxx 600 eked out a small gain despite looming tariff concerns. The index has now recovered around 80% of its March–April losses and is approaching all-time highs and potentially overbought territory.
On the data front, yesterday’s CPI print confirmed an uptick in euro area’s April core inflation. However, that unwelcome development was somewhat offset by new EU Commission forecasts showing eurozone inflation could slow toward the 2% target by mid-year and average around 1.7% in 2026. This outlook should give the European Central Bank (ECB) enough room to keep rates in a sweet spot alongside easing energy prices and a possible resolution to the war in Ukraine.
The EURUSD rallied to 1.1288 yesterday and remains bid against a broadly softer US dollar, while German bonds continue to attract buyers seeking low-risk alternatives to US debt.
What rating cut?
Interestingly, markets rapidly shrugged off the US rating downgrade. The 10-year yield eased below 4.50%, and the 30-year fell back under the 5% threshold. Still, the broader narrative of declining confidence in US Treasuries and the US dollar remains intact. This opens a window of opportunity for investors looking beyond US markets—an exciting prospect for those seeking the next big destination.
On the Federal Reserve (Fed) front, New York Fed President Williams said ‘It’s not going to be that in June or July we’re going to understand what’s happening’ —emphasizing that it will take time to gather data and assess the situation. Atlanta Fed President Bostic echoed the cautious tone, saying he expects no more than one rate cut this year.
The S&P 500 reversed early-session losses to close slightly higher, but concerns remain: trade tensions, the Fed’s reluctance to provide support amid rising inflation expectations, and ongoing political uncertainty.
In corporate news, Nvidia announced that it will allow third-party chips to use its NVLink Fusion program and ‘connect their own third-party CPUs with Nvidia’s GPUs in AI data centers.’ The move aims to turn a competitive threat—of others building their own chips—into an opportunity to become the high-performance bridge everyone uses. Nvidia shares recovered early losses and closed above the $135 mark.
Elsewhere, Home Depot and Lowe’s earnings are in focus as investors complete the US consumer picture in the midst of trade turmoil. These companies remain heavily exposed to the trade war and may be forced to raise prices despite declining sales in order to protect their margins. A company like Home Depot has a net profit margin of around 9%, while Walmart operates closer to a 3% net profit margin. With tariffs ranging between 10% and 30%, price increases seem inevitable.
Higher prices mean higher inflation, limited Fed support, slower economic growth and – potentially – stagflation: a recipe for a deeper debt spiral and more financial pain.
Euro Area Consumer Confidence Due Today
In focus today
In the euro area, we will receive consumer confidence data for May, which will show how consumers have reacted to the improvements in trade talks between the US and China and following risk on sentiment in markets.
In Denmark, the government releases a new economic forecast, which according to media reports will show 3.0% GDP growth in 2025, which would imply quite weak q/q growth during the year. We also receive consumer confidence and flash Q1 GDP figures are being released. We anticipate a 0.5% q/q decline in GDP for Q1, following strong growth in 2024. However, there's high uncertainty due to unreliable real indicators for GDP growth, measured from the production side. While industrial production appears to have sharply decreased, the survey data may not accurately reflect current industry conditions.
Economic and market news
What happened overnight
China's central bank cut the 1-year and 5-year Loan Prime Rates by 10bp to 3.0% and 3.5% respectively, following the reverse repo rate which was lowered by 10bp on 6 May. These anticipated rate cuts aim to stimulate consumption and loan growth as the economy softens.
In Australia, the RBA cut it cash rate by 25bp to 3.85%, as expected, marking the second rate cut this year. This decision follows the return of underlying inflation back inside the RBA's target band.
What happened yesterday
Ukraine-Russia peace talks, following Trump's call with Putin, Trump stated that Russia and Ukraine would commence immediate negotiations aimed at achieving a ceasefire and ending the war, though the Kremlin cautioned the process would require time. Trump briefed Zelenskiy and EU leaders in a group call. European leaders agreed to intensify sanctions on Russia, while Trump opted not to introduce fresh sanctions.
In the euro area, the European Commission released its updated economic projections. It forecasts real GDP growth to be 0.9% y/y in 2025, down from November's estimate of 1.3% y/y. This revision is primarily due to increased tariffs and uncertainty stemming from recent changes in US trade policy. Next year, growth is expected to improve to 1.4% y/y. Inflation is projected at 2.1% y/y for 2025 and 1.7% in 2026. The 2026 inflation forecast has been reduced from 1.9% y/y aligning with ECB's December projections. This adjustment suggests the ECB might also lower its March forecast of 1.9% when the June projections are released, indicating a dovish stance given the similarity in their modelling frameworks.
Equities: Global equities ended higher yesterday, in what turned out to be a notable turnaround session. Early in the day, risk sentiment was soft, and we saw broad-based selling, particularly in US-linked assets. However, as the session progressed, sentiment reversed, and markets closed close to flat or slightly positive. This marked yet another day of gains in equities, continuing the positive streak we've seen over the past month. The S&P 500 is now nearly 20% above its recent lows just over a month ago. VIX ticked up slightly, while defensives outperformed cyclicals once again.
However, it is worth noting that this outperformance is happening in an up-market and comes on the heels of a strong month for cyclicals leading to P/E premium being back close to 30% again in cyclicals. In the past three sessions have seen consistent relative strength in defensives, but overall volatility remains anchored near historical norms, which is remarkable given the current level of political uncertainty. This likely reflects the resilience of the macro backdrop, which remains relatively strong. In the US yesterday Dow +0.32%, S&P 500 +0.09%, Nasdaq +0.02%, Russell 2000 (0.42%). Asian markets are mostly higher this morning after China cut rates, and there is some catch-up after yesterday's gains in Western markets. US equity futures are pointing slightly lower, while European futures are trading in positive territory.
FI&FX: This morning, we have made a slight change to our Fed forecast, now calling for the next 25bp cut in September (prev. June) but still maintaining our terminal rate view at 3-3.25%. As we pencil in quarterly rate cuts, the terminal rate will now be reached in September 2026. Market sentiment improved yesterday afternoon as the headwinds to US assets faded, and equities closed marginally in the green and 10y UST fell back almost to the same levels as before Moody's announcement on Friday. The USD remains on the backfoot however, with EURUSD lifting above 1.12 yesterday and our revised Fed call does not alter our EUR/USD outlook. We remain bearish USD and reiterate our 12M EUR/USD target of 1.20. We think the paid case in Norway has run a little too far relative to peers. Consequently, we yesterday booked profit on 3 of our short-end payer trades.
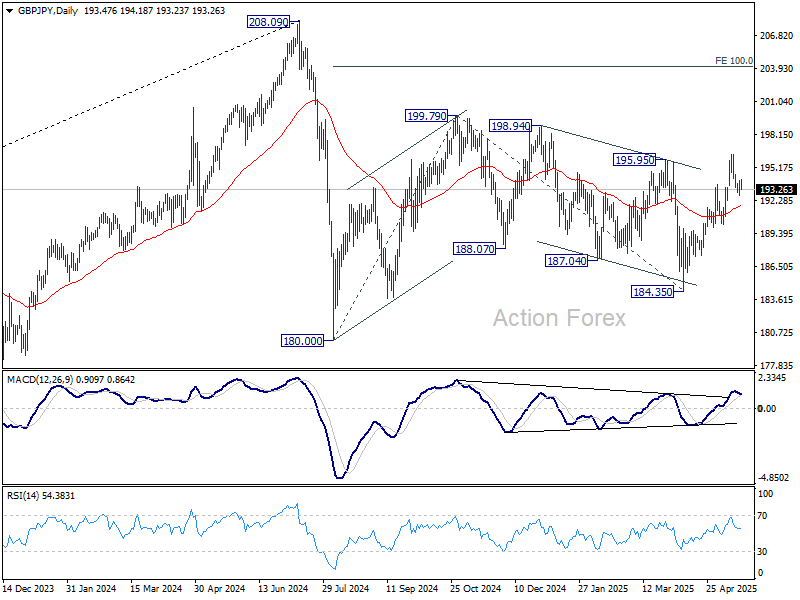
GBP/JPY Daily Outlook
Daily Pivots: (S1) 192.86; (P) 193.47; (R1) 194.16; More...
Intraday bias in GBP/JPY stays neutral and more more consolidations could be seen below 196.38. Further rise is in favor as long as 190.22 support holds. On the upside, firm break of 195.95 will suggest that whole choppy decline from 199.79 has completed, and target this resistance next.
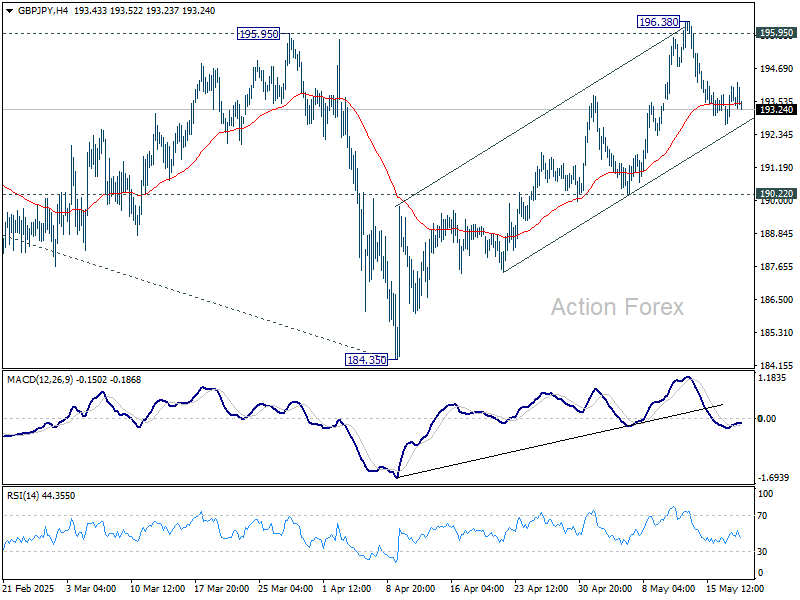
In the bigger picture, price actions from 208.09 are seen as a correction to rally from 123.94 (2020 low). Strong support should be seen from 38.2% retracement of 123.94 to 208.09 at 175.94 to contain downside. However, sustained break of 175.94 will bring deeper fall even still as a correction.
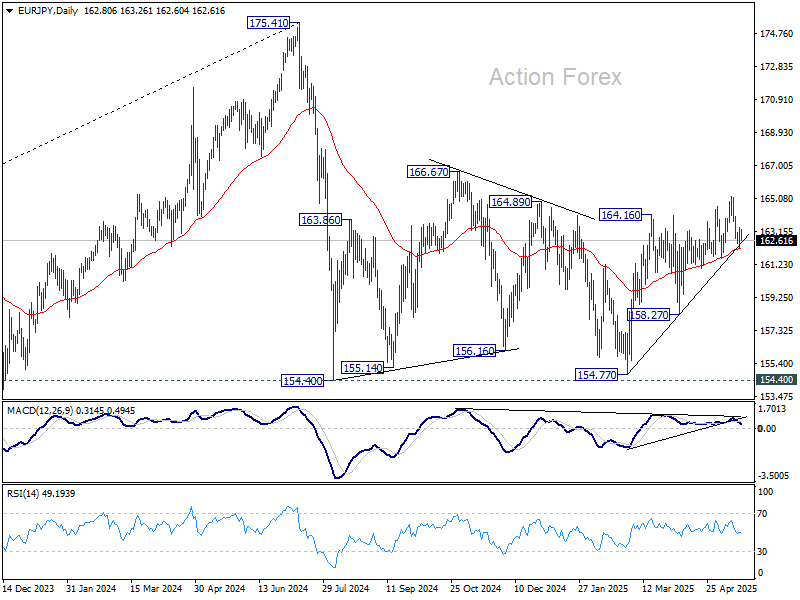
EUR/JPY Daily Outlook
Daily Pivots: (S1) 162.17; (P) 162.78; (R1) 163.42; More...
Range trading continues in EUR/JPY and intraday bias remains neutral. Further rally is in favor as long as 161.57 support holds. Break of 165.19 will resume the rise from 154.77 to 166.67 resistance. However, firm break of 161.57 will indicate near term reversal, and turn bias back to the downside.
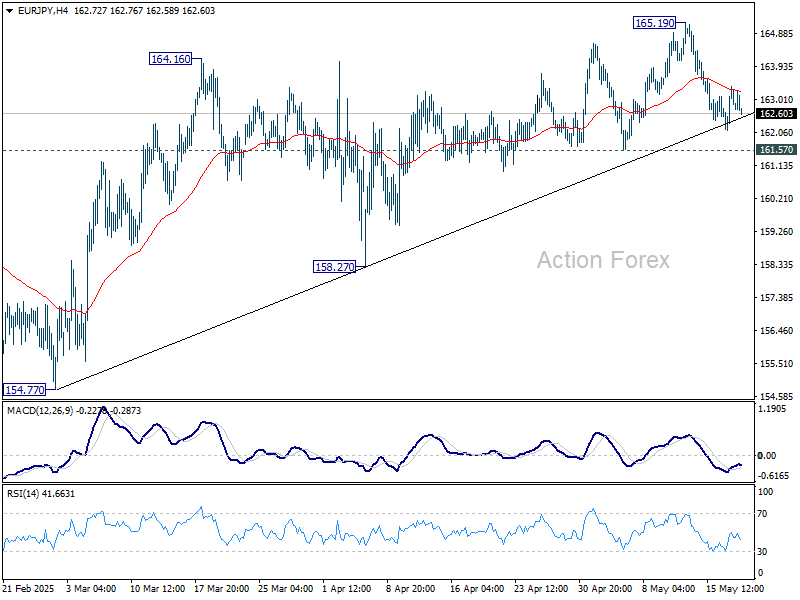
In the bigger picture, price actions from 175.41 are seen as correction to rally from 114.42 (2020 low). Strong support should be seen from 38.2% retracement of 114.42 to 175.41 at 152.11 to contain downside. However, sustained break of 152.11 will bring deeper fall even still as a correction.
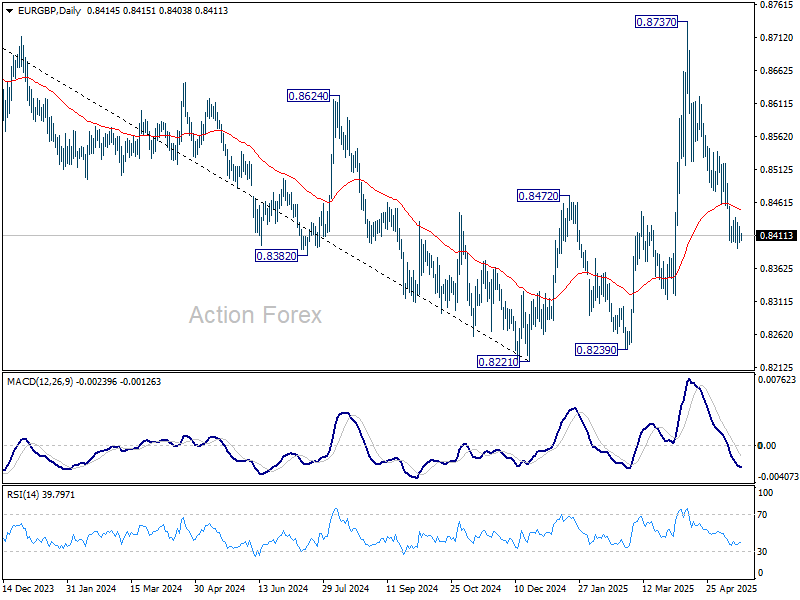
EUR/GBP Daily Outlook
Daily Pivots: (S1) 0.8402; (P) 0.8415; (R1) 0.8426; More...
Despite some loss of momentum, further fall is still in favor in EUR/GBP with 0.8439 minor resistance holds. Current decline from 0.8737 should target 0.8221/8239 support zone. On the upside, above 0.8439 will turn bias back to the upside for stronger rebound instead.
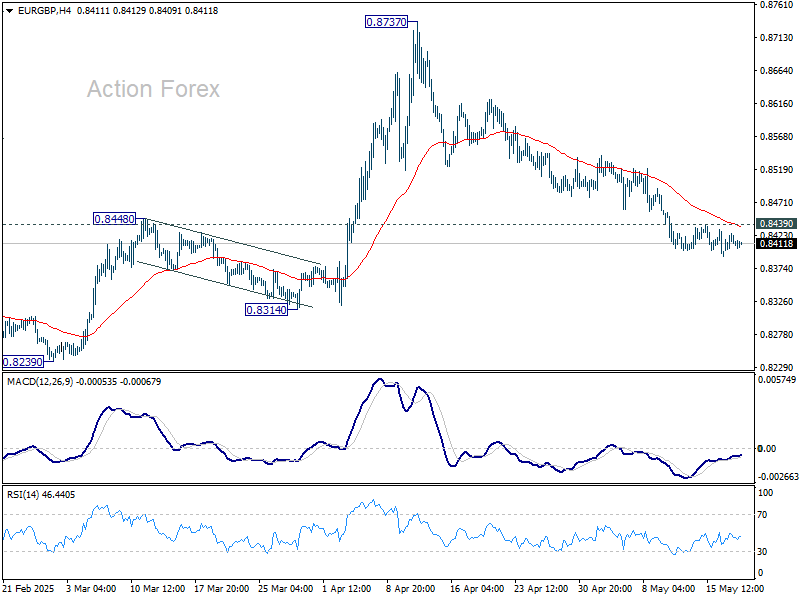
In the bigger picture, current development suggests that price actions from 0.8221 medium term bottom are merely forming a corrective pattern. However, there is no clear momentum to break through 0.8201 key support (2022 low) yet. Hence, range trading is expected between 0.8221/8737 for now.
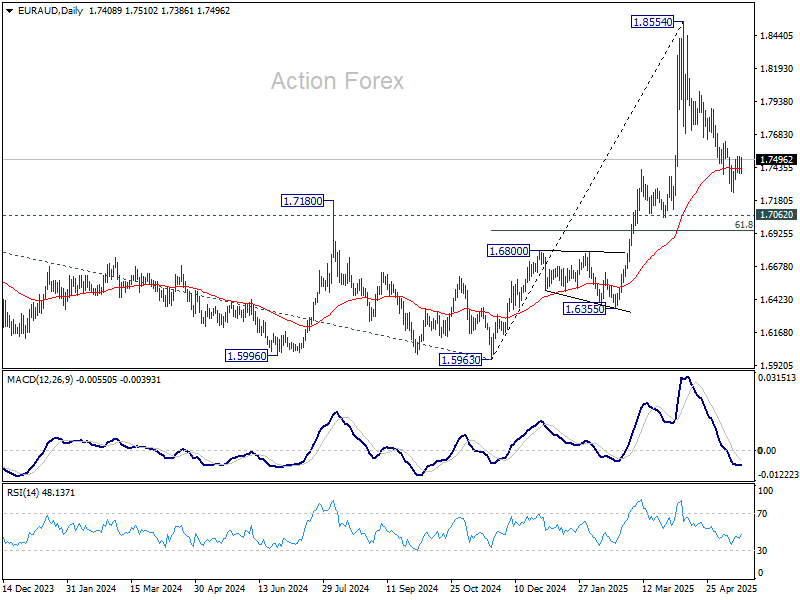
EUR/AUD Daily Outlook
Daily Pivots: (S1) 1.7359; (P) 1.7439; (R1) 1.7488; More...
Intraday bias in EUR/AUD stays neutral for the moment. On the upside, firm break of 1.7628 resistance will suggest that fall from 1.8554 as completed as a correction, and retain larger bullishness. Intraday bias will be back on the upside for stronger rebound. However, below 1.7245 will resume the fall to 61.8% retracement of 1.5963 to 1.8554 at 1.6953.
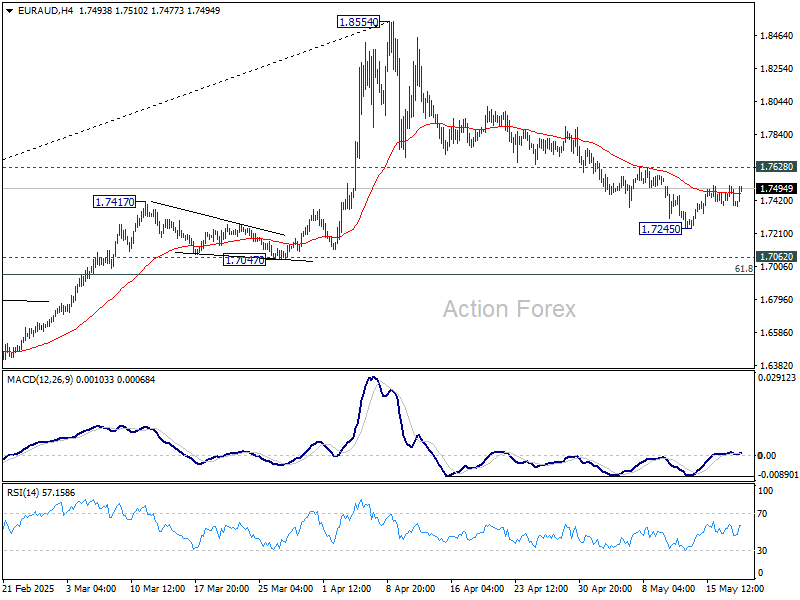
In the bigger picture, as long as 1.7062 resistance turned support (2023 high) holds, up trend from 1.4281 (2022 low) should still be in progress. Break of 1.8554 will target 100% projection of 1.4281 to 1.7062 from 1.5963 at 1.8744. However, sustained break of 1.7062 will confirm medium term topping and bring deeper fall back to 1.5963 support.
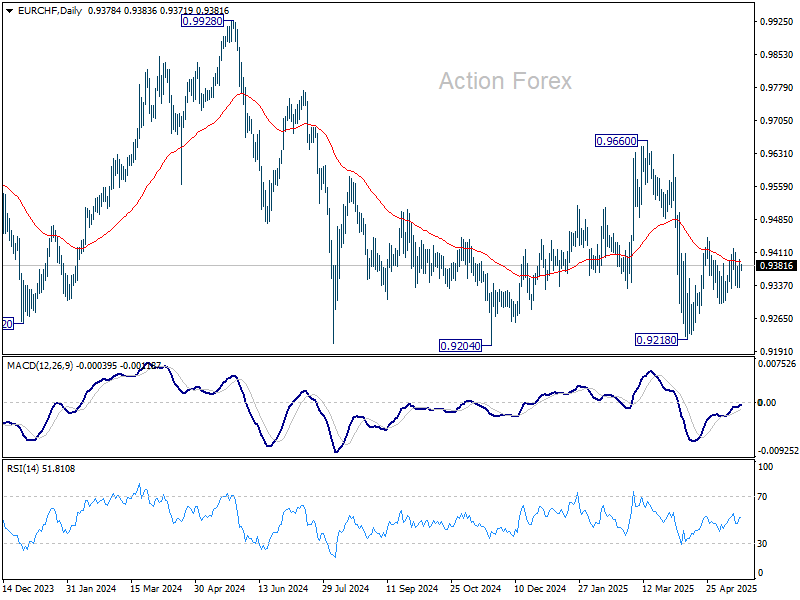
EUR/CHF Daily Outlook
Daily Pivots: (S1) 0.9348; (P) 0.9373; (R1) 0.9409; More....
EUR/CHF is still bounded in sideway trading and intraday bias stays neutral. Price actions from 0.9218 are seen as either a corrective move or the third leg of the pattern from 0.9204. On the upside, break of 0.9419 will resume the rise from 0.9218 through 0.9445 resistance. However, break of 0.9296 support will bring retest of 0.9218 low.
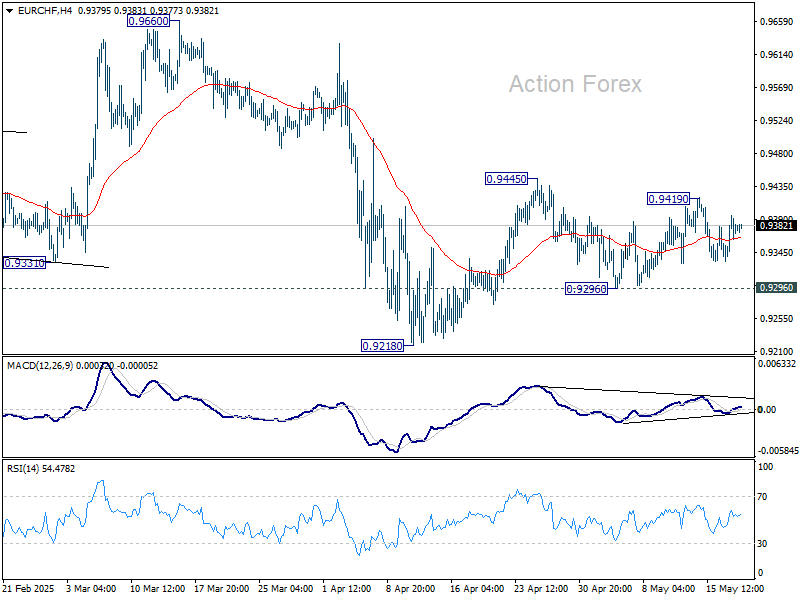
In the bigger picture, prior rejection by long-term falling channel resistance (now at 0.9548) retains medium term bearishness. That is, down trend from 1.2004 (2018 high) is still in progress. Firm break of 0.9204 (2024 low) will confirm resumption. This will remain the favored case as long as 0.9660 resistance holds.
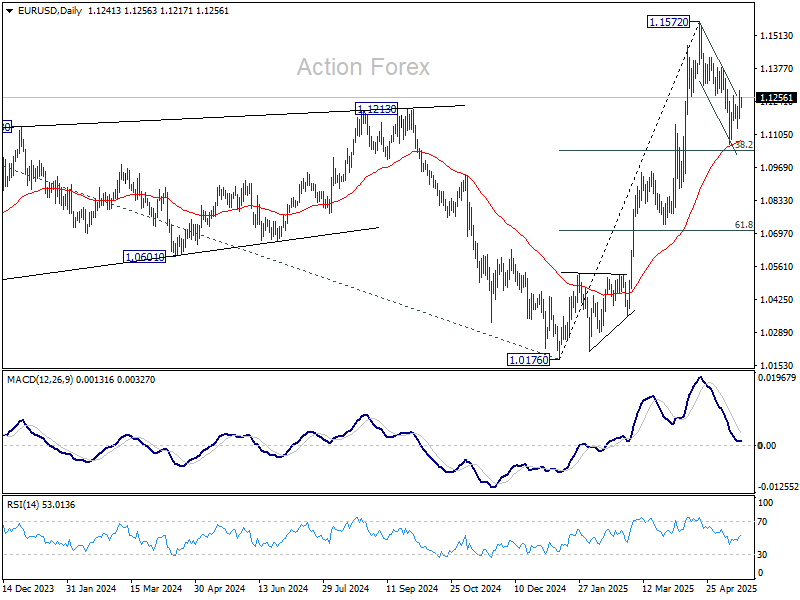
EUR/USD Daily Outlook
Daily Pivots: (S1) 1.1180; (P) 1.1234; (R1) 1.1296; More...
Intraday bias in EUR/USD remains neutral for the moment. On the upside, decisive break of 1.1292 resistance should indicate that correction from 1.1572 has already completed after defending 38.2% retracement of 1.0176 to 1.1572 at 1.1039. Intraday bias will be turned back to the upside for retesting 1.1572 next.
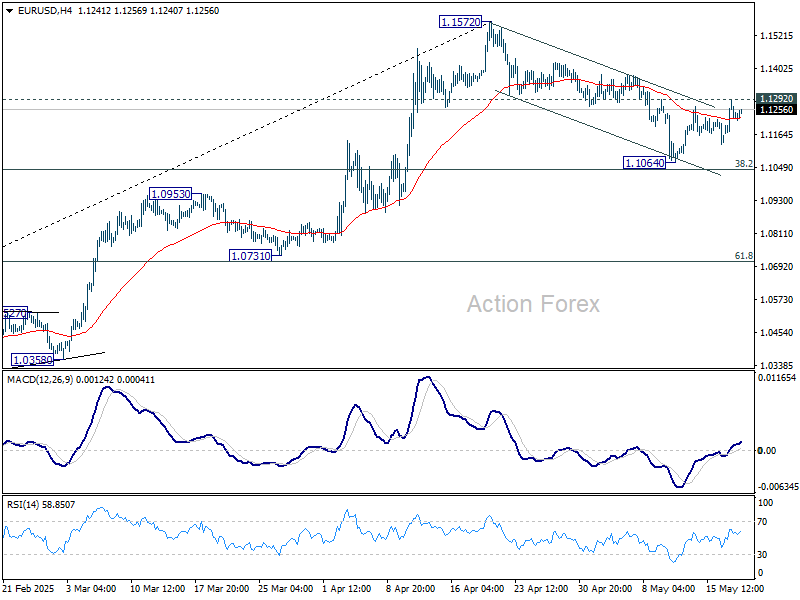
In the bigger picture, rise from 0.9534 long term bottom could be correcting the multi-decade downtrend or the start of a long term up trend. In either case, further rise should be seen to 100% projection of 0.9534 to 1.1274 from 1.0176 at 1.1916. This will now remain the favored case as long as 55 W EMA (now at 1.0818) holds.
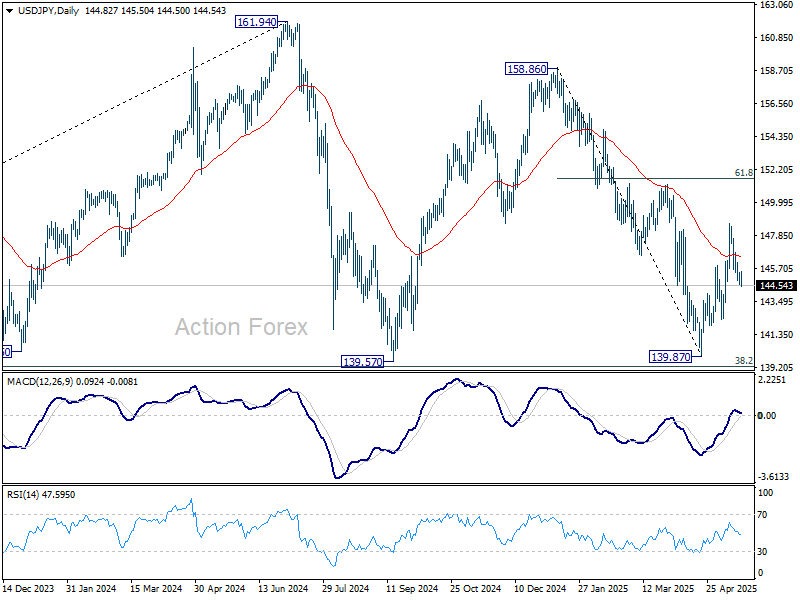
USD/JPY Daily Outlook
Daily Pivots: (S1) 144.52; (P) 145.00; (R1) 145.33; More...
Intraday bias in USD/JPY remains neutral first. Further rally is in favor as long as 144.02 support holds. Above 146.08 minor resistance will target 148.64 first. Firm break there will resume the rally from 139.87 to 61.8% retracement of 158.86 to 139.87 at 151.60 next. However, firm break of 144.02 will bring retest of 139.87 low instead.
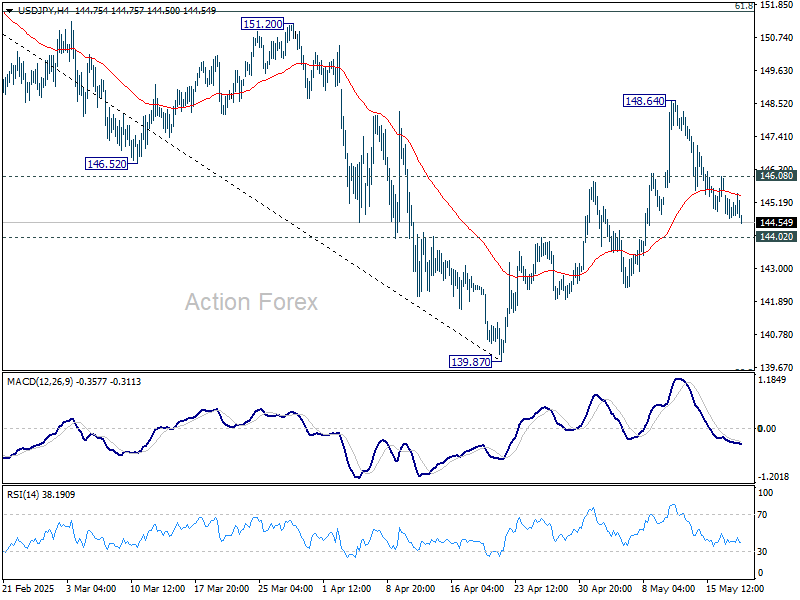
In the bigger picture, price actions from 161.94 are seen as a corrective pattern to rise from 102.58 (2021 low), with fall from 158.86 as the third leg. Strong support should be seen from 38.2% retracement of 102.58 to 161.94 at 139.26 to bring rebound. However, sustained break of 139.26 would open up deeper medium term decline to 61.8% retracement at 125.25.
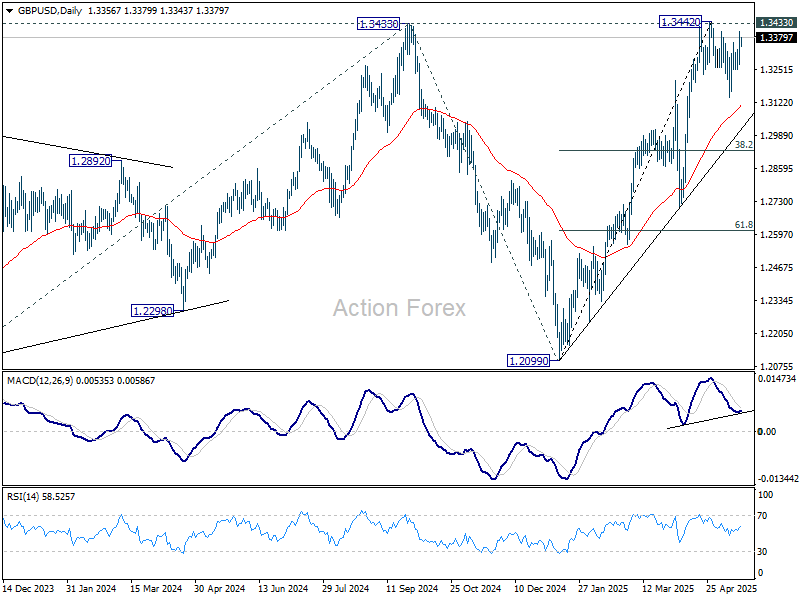
GBP/USD Daily Outlook
Daily Pivots: (S1) 1.3283; (P) 1.3344; (R1) 1.3421; More...
Intraday bias in GBP/USD is mildly on the upside for 1.3433/42 key resistance zone. Decisive break there will confirm larger up trend resumption. On the downside, though, below 1.3249 support will extend the corrective pattern from 1.3442 with another falling leg.
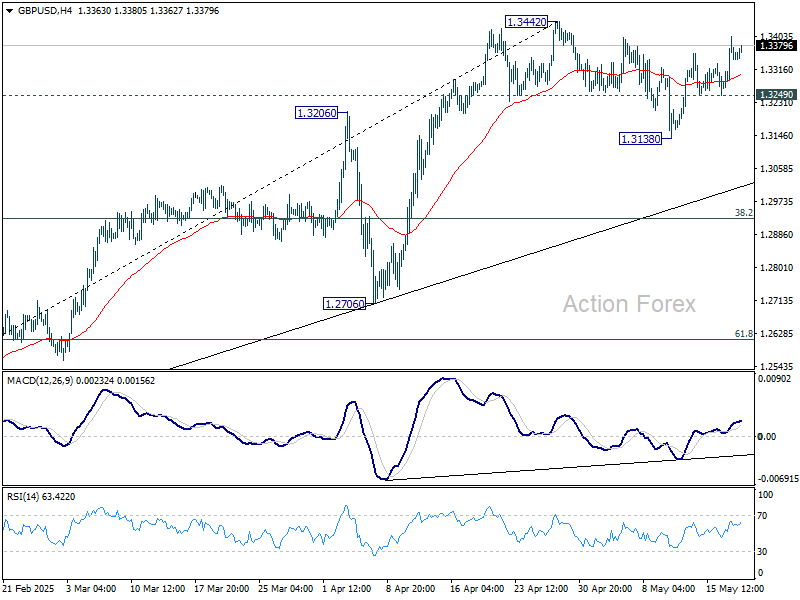
In the bigger picture, up trend from 1.3051 (2022 low) is still in progress. Decisive break of 1.3433 (2024 high) will confirm resumption. Next medium term target is 61.8% projection of 1.0351 to 1.3433 from 1.2099 at 1.4004. Nevertheless, sustained trading below 55 D EMA (now at 1.3112) will delay the bullish case and bring more consolidations first.